OEE Dashboard that helps you visualize your production data
Evocon’s OEE Dashboard provides the means to visualize your production data and helps monitor production performance in real time and on the go. Use it to upgrade your daily and weekly monitoring process and understand whether things are progressing in the direction you want.
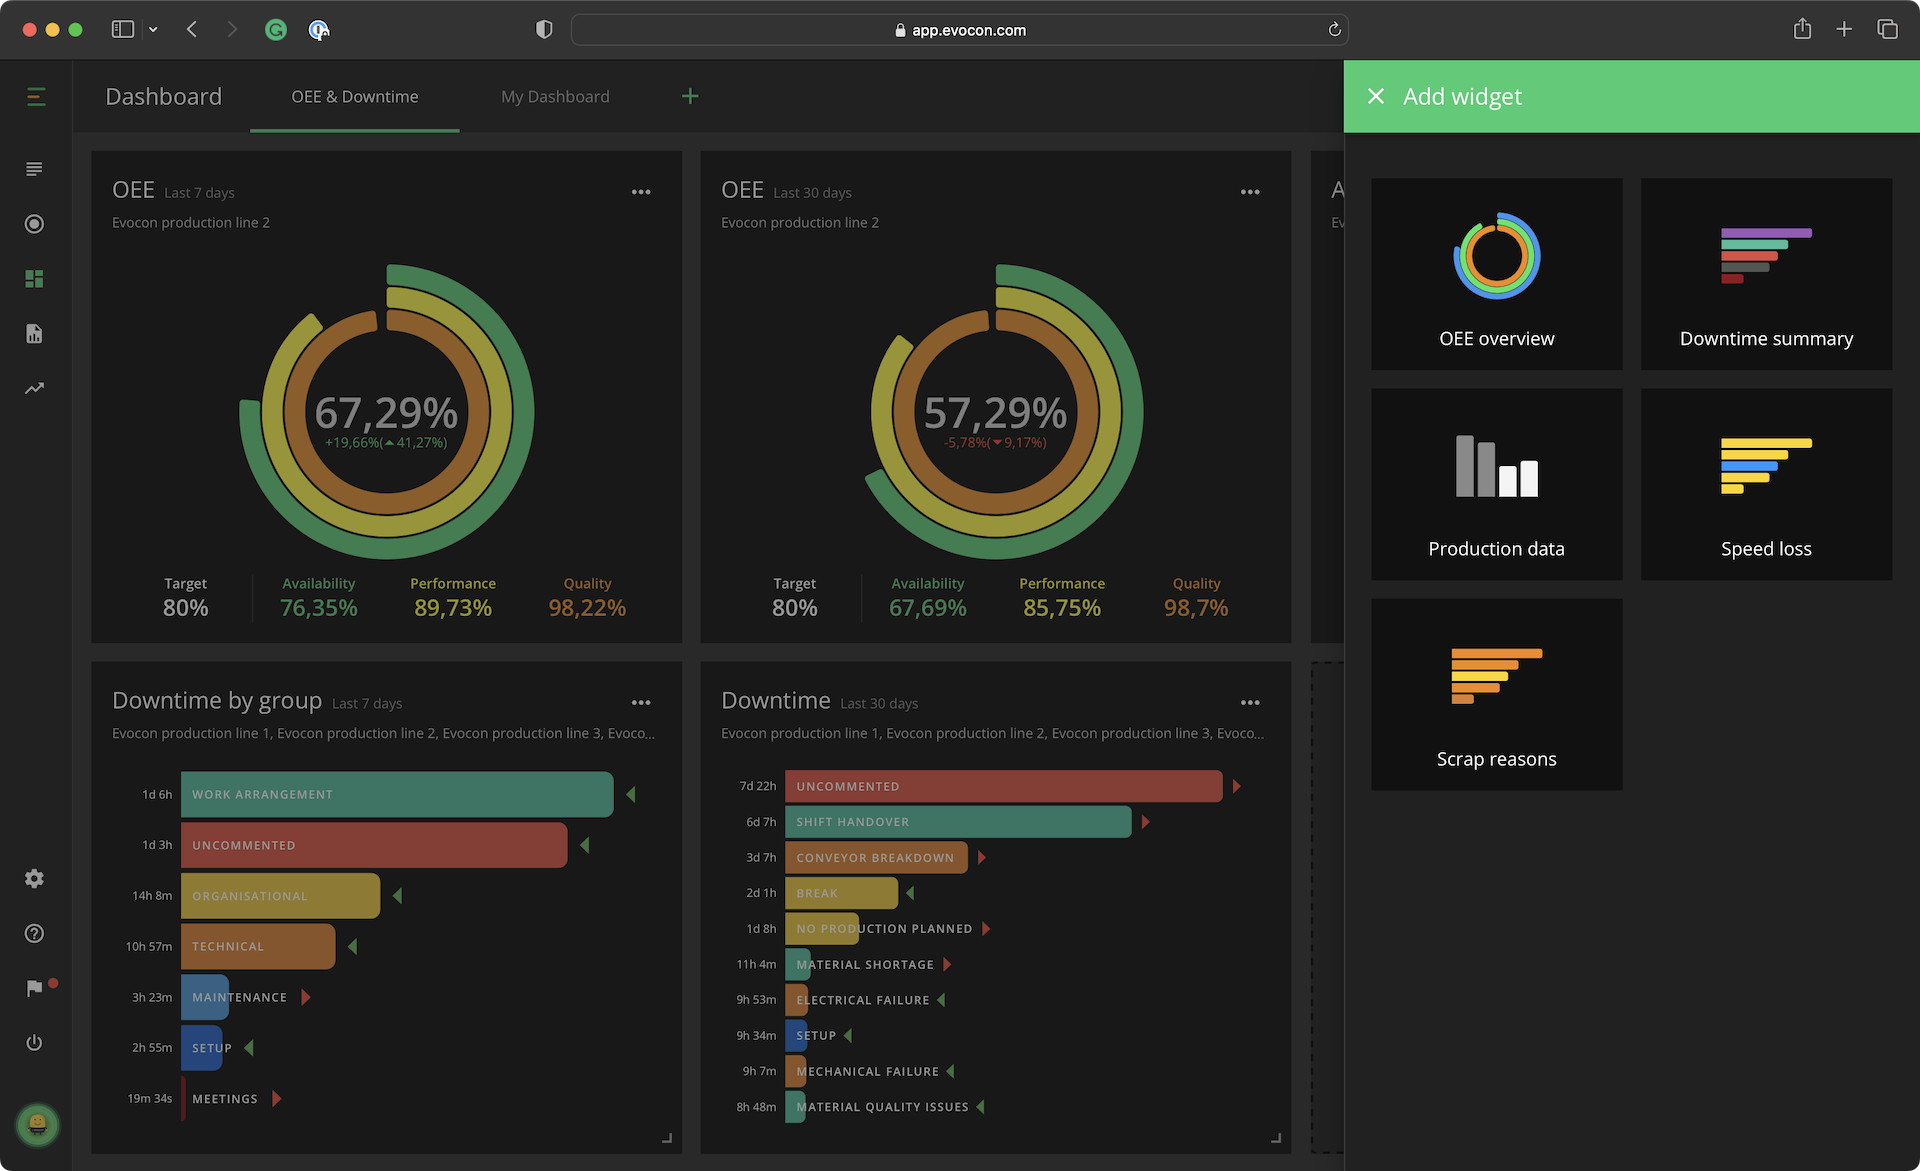
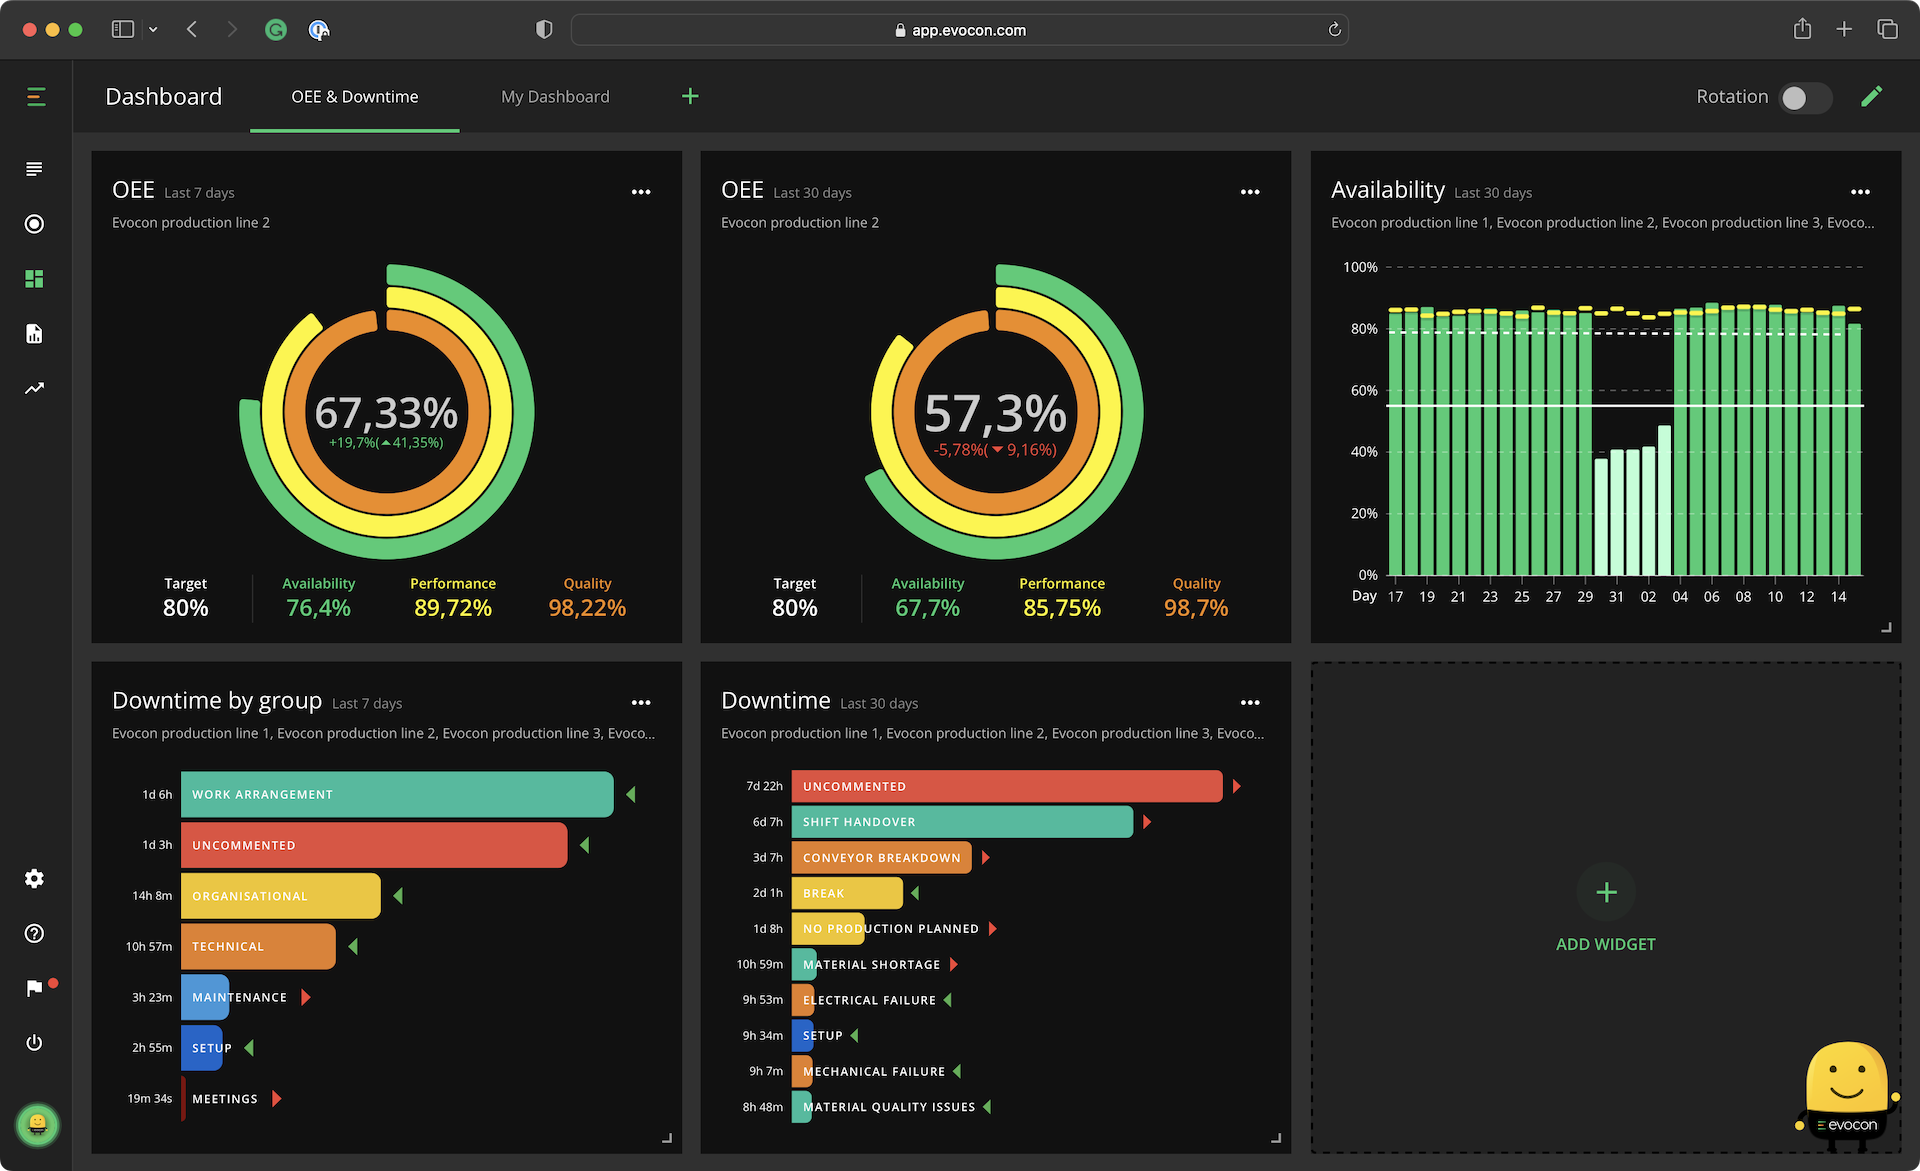
Different widgets, one goal
Evocon’s OEE Dashboard has different widgets so you can track the production KPIs you want the way you want.
All of them have one goal – to provide you with the production information you need to make better decisions and understand trends.
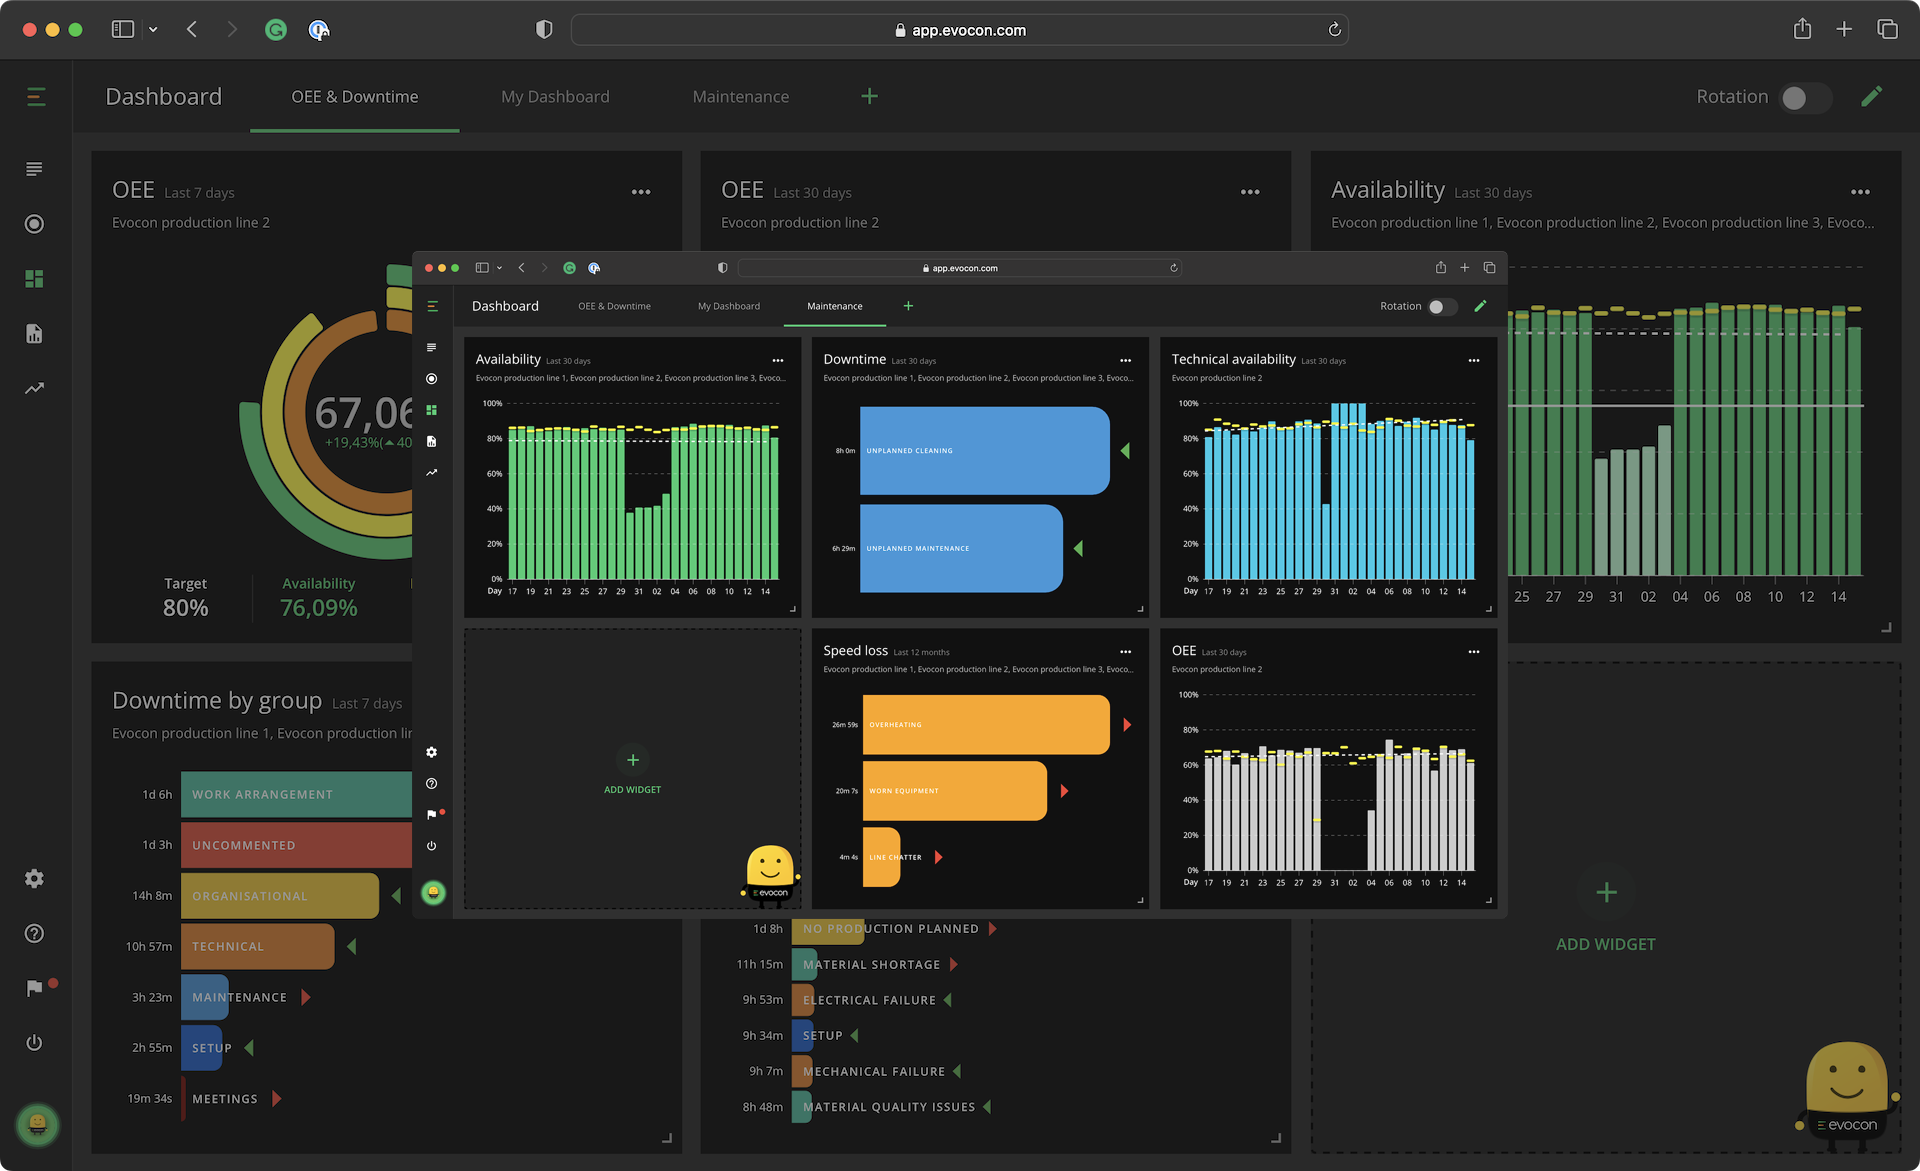
Customize for departments
With Evocon, you can give access to production data to as many users as you want.
By enabling different departments (production, maintenance, quality, etc.) to customize their OEE Dashboard, everyone gains valuable insight into your factory’s performance.
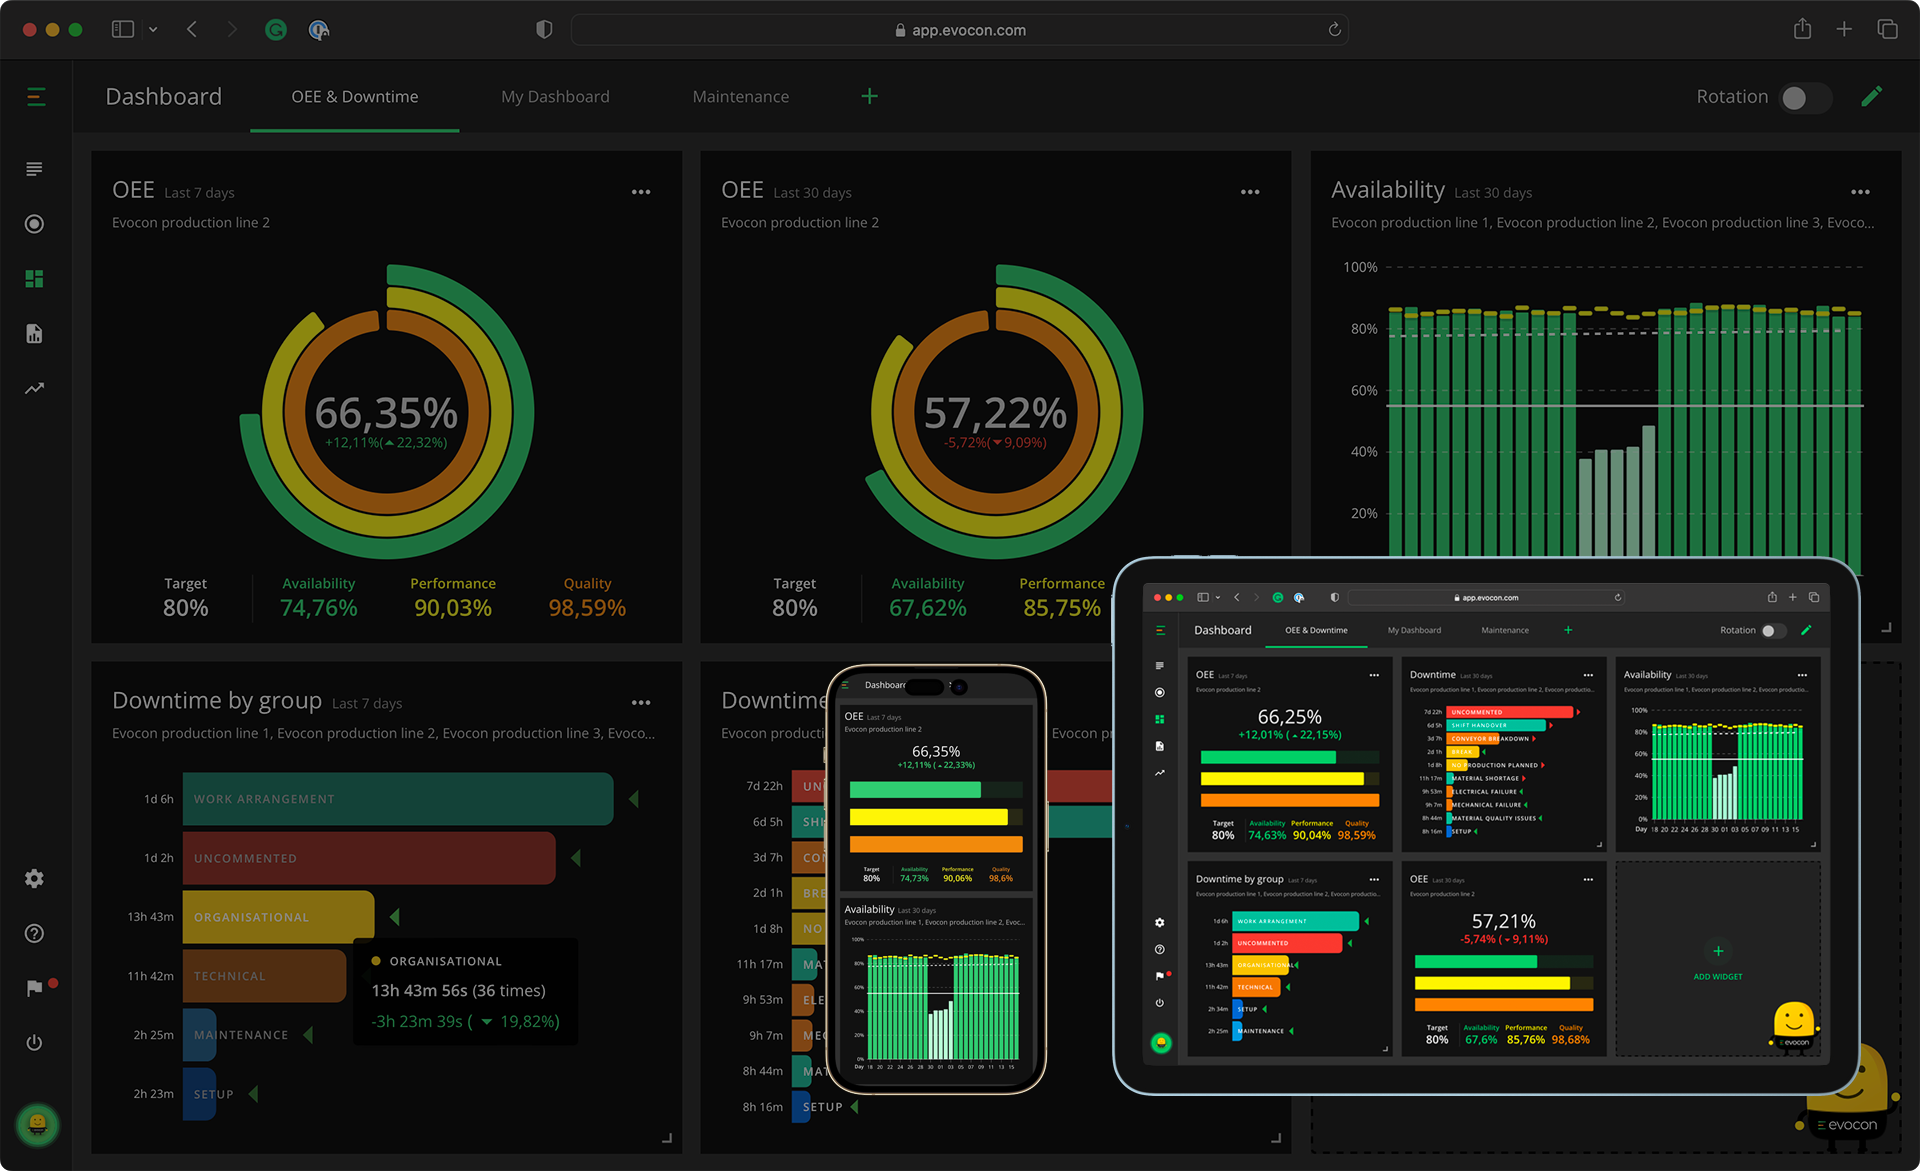
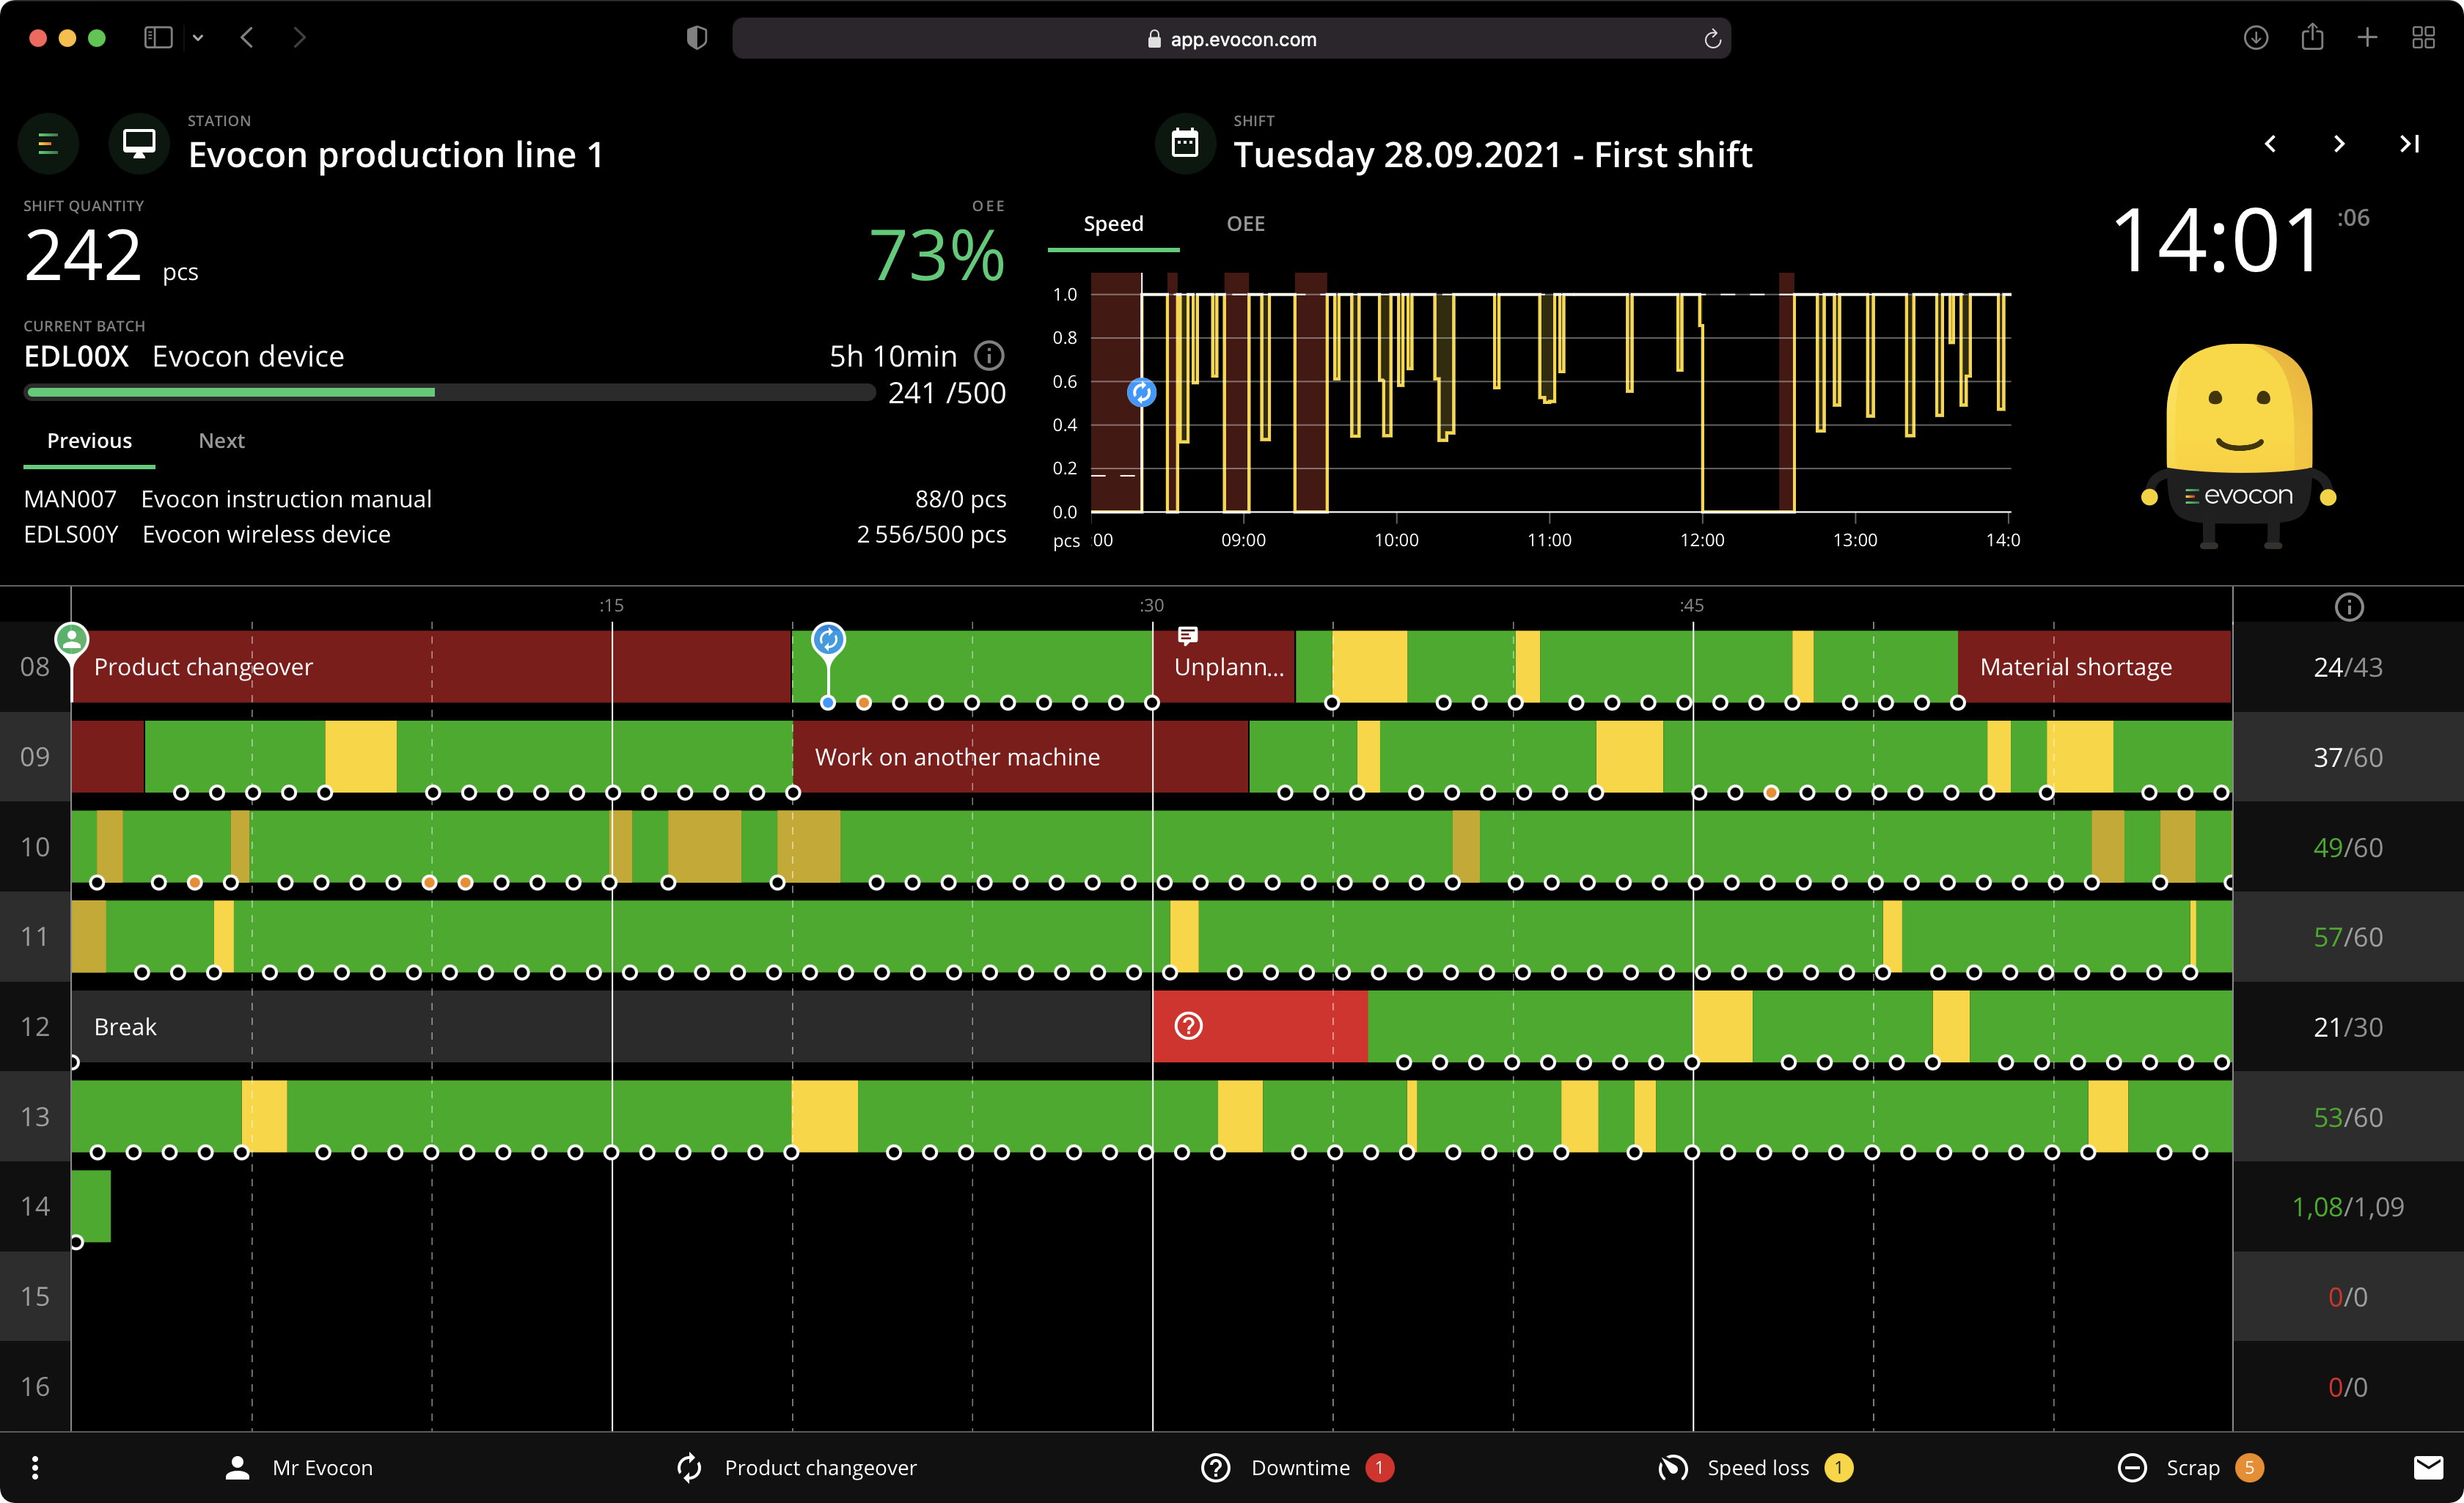
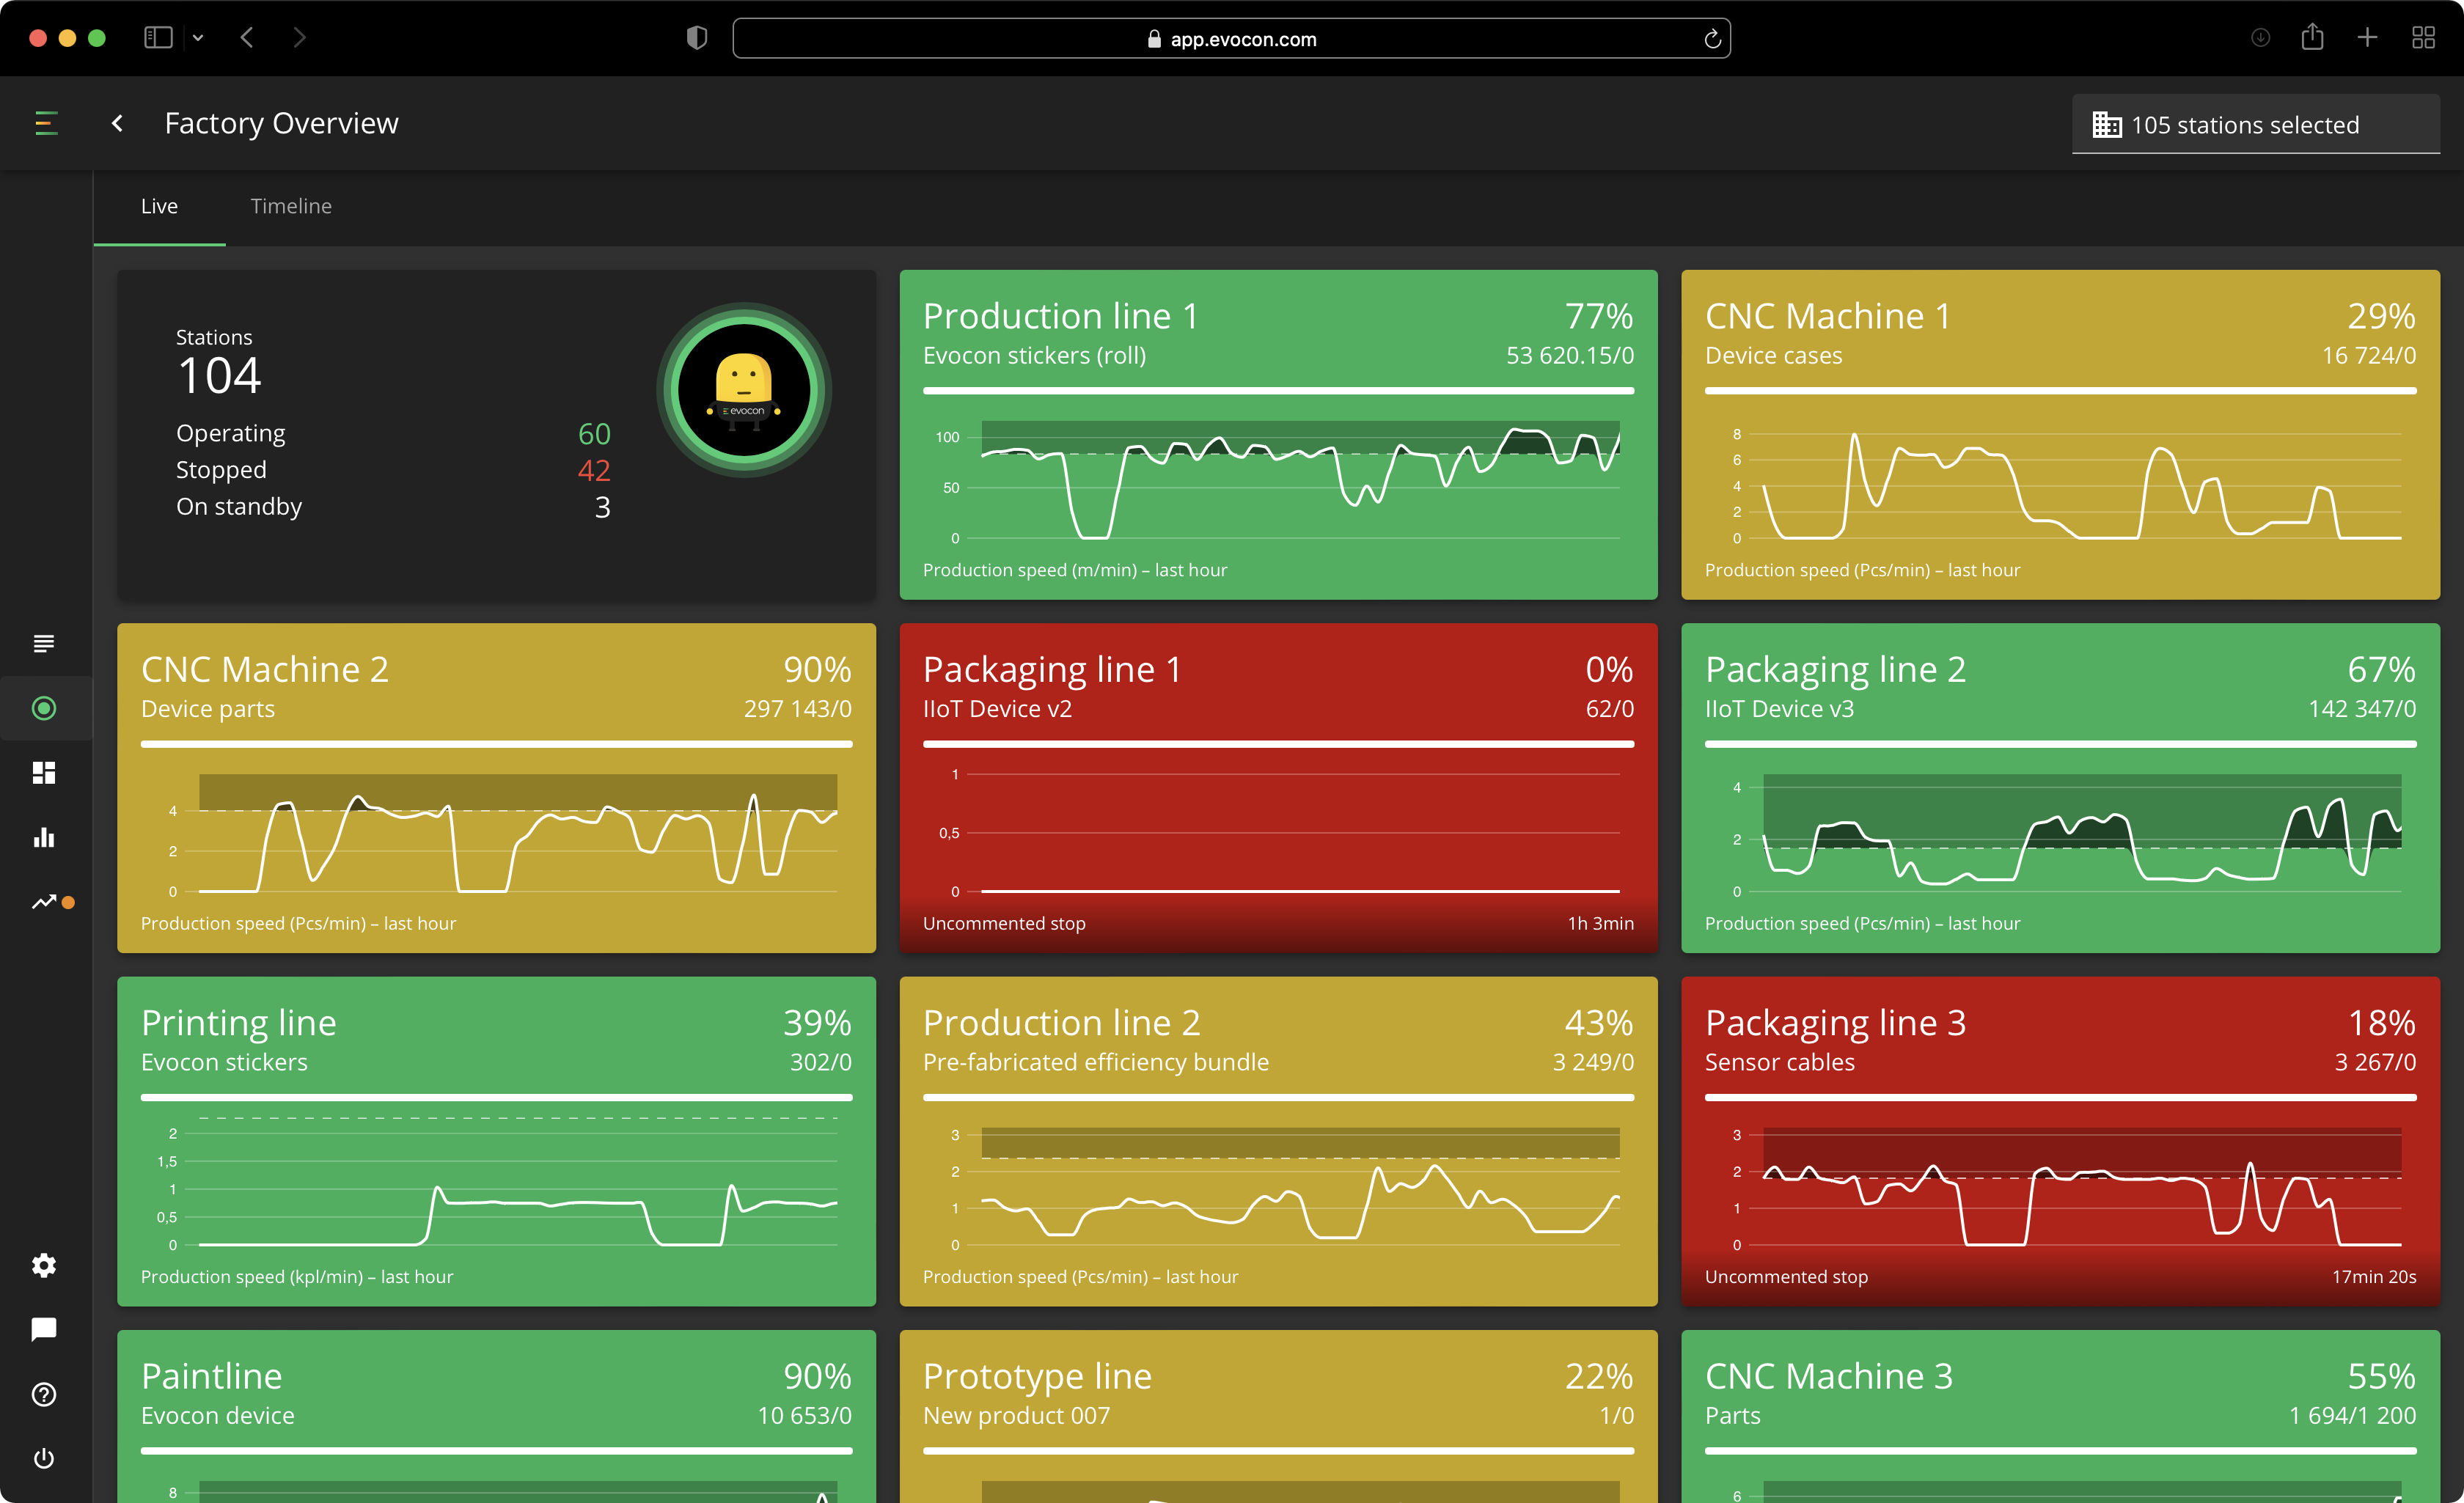
OEE display where you need it
The OEE dashboard is built so that data can be intuitively understood and analyzed.
In addition to setting up your OEE Dashboard on any device, you can create one and display it on a TV in your office or production area, allowing everyone to track the performance of your factory.
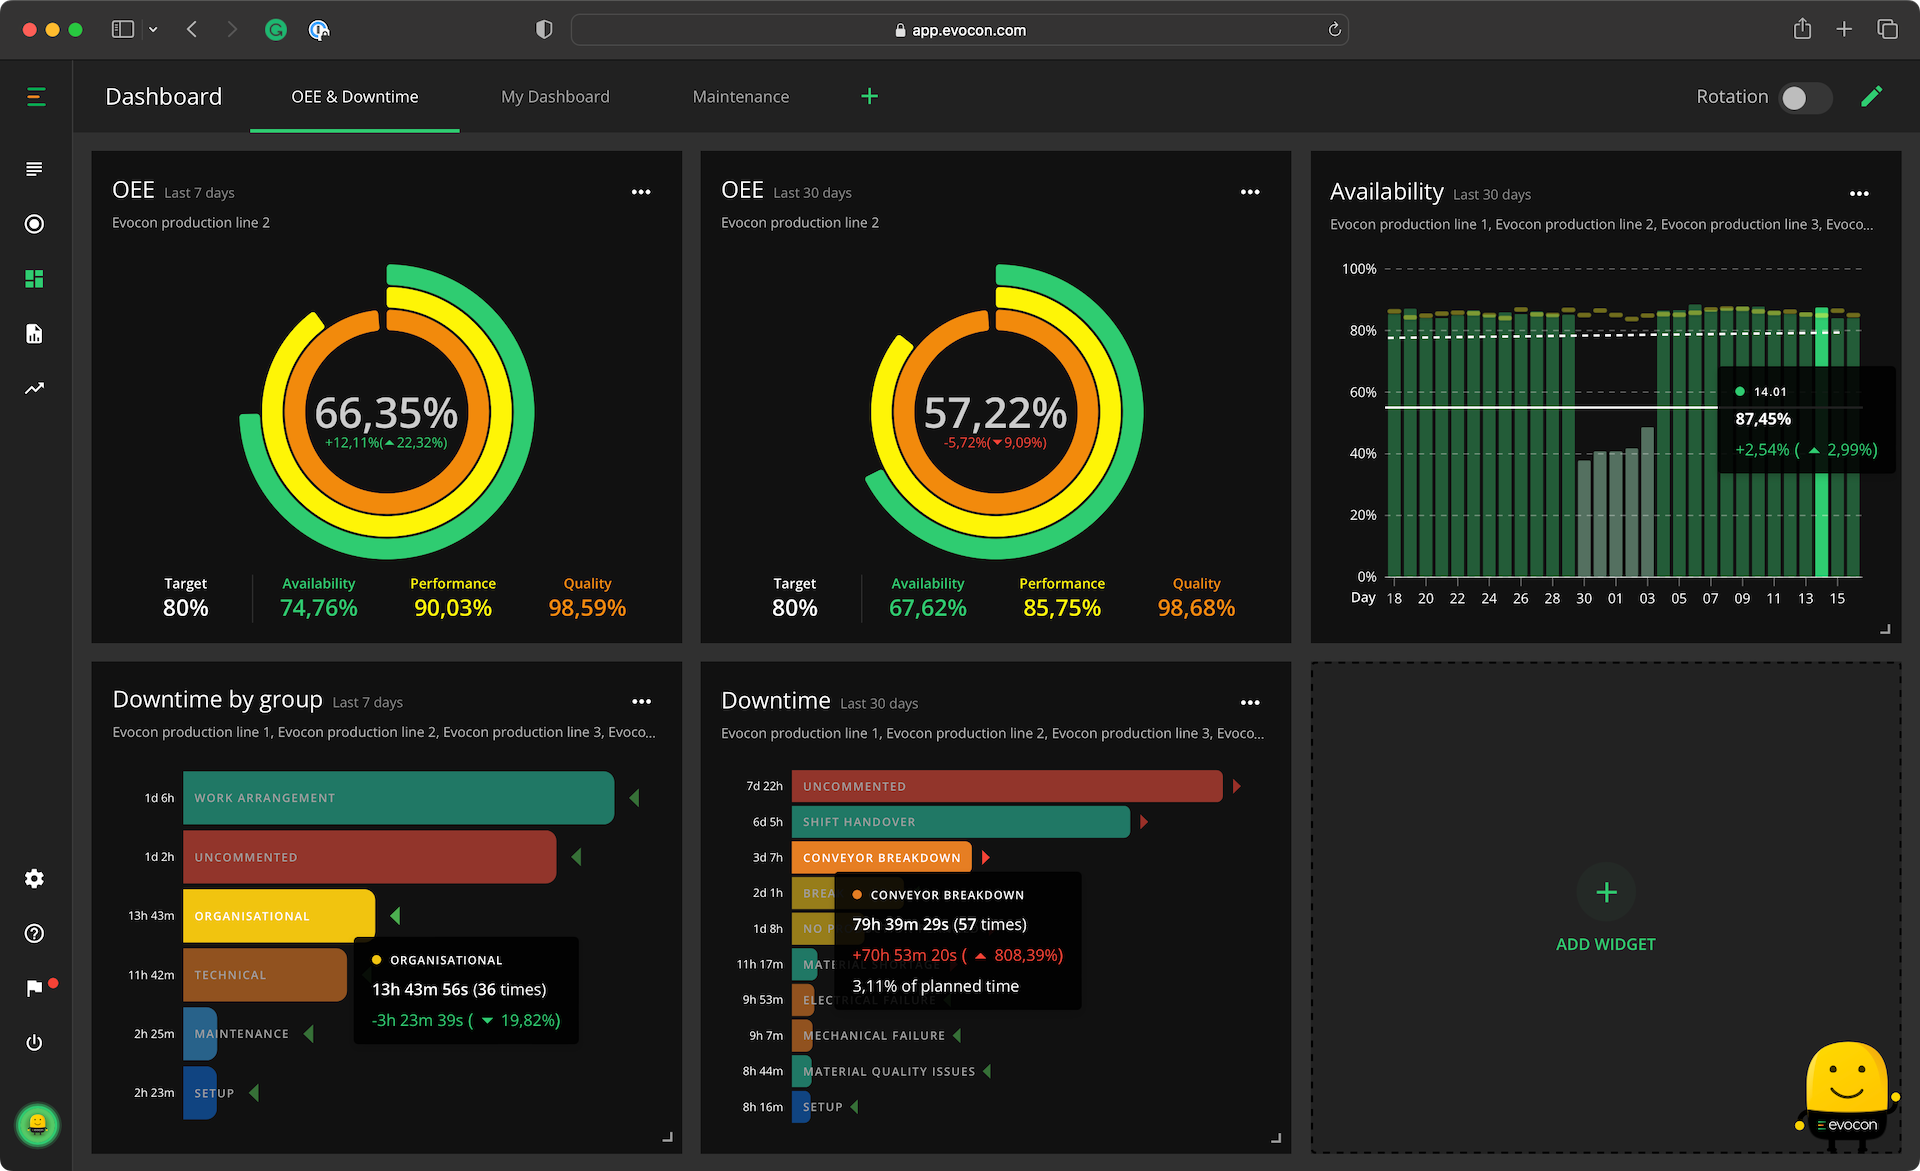
Level up your daily and weekly meetings
Access to real-time production data will help managers and teams quickly identify issues and develop solutions.
With up-to-date information available, daily and weekly meetings can be focused on analyzing and improving performance rather than trying to track down data.
"Evocon is at the heart of our daily follow-ups regarding production, and we also use it on a daily basis to cover the needs of maintenance and activity planning."

Lars Severin
World Class Manufacturing Coordinator
Saint-Gobain Weber Sweden
Features that support OEE visualization
-
 Real-time data on all production losses
 -
Comparison with previous time periods
-
Trend lines to help understand progress
-
TV mode for large OEE displays
-
Up to 20 dashboards per user
-
Different chart types for improved visualization
-
Performance analysis compared to target
-
Filtering of data based on need