Welcome to Evocons’ Lean Six Sigma DMAIC project example. Here you can learn more about the five phases of DMAIC by following an example project.
Getting Started
This article serves as a companion to our Introduction to Lean Six Sigma DMAIC Methodology. If you are new to Six Sigma, we recommended reading our Introduction to Six Sigma and Lean Six Sigma first.
Let’s get started by learning about the background of the example project used in this article.
Background of the example project
The example project found in this article is a hypothetical scenario. The Evocon team has more than 10 years in Manufacturing Operations experience. This includes participating in several real-world DMAIC projects. The team’s experience on 3 projects is the basis of our hypothetical scenario.
Selected demographic and firmographic details
- Project 1 and 2, Fortune 500 manufacturing-plants located in North America and Europe, each requiring between 700 and 1000 employees to operate
- Project 3, Family-owned manufacturing plant located in North America, a tier-2 supplier to primarily Fortune 500 clients, requiring between 50-75 employees to run and was a
Phase I: Define
How a DMAIC project can start
Often, those who are learning Lean Six Sigma (LSS) ask how do projects start, or how should they select one? It turns out; these are fundamental questions in LSS. As such, there is considerable literature devoted to the answers. Thus, the full-treatment of these questions is beyond the scope of this article.
Origins of our hypothetical example
Quality assurance is responsible for designing, implementing, and maintaining a plant quality management system (QMS). A QMS best practice is to require that product quality be monitored, measured, and continually improved. Usually, this requirement takes the form of a standard operating procedure (SOP).
One such SOP is for quality assurance professionals to analyze particular production data at defined intervals. Specifically, in our case, production data on the number and type of defects that lead to material scrap.
Data analysis
Our example begins after quality engineers have completed just such an analysis. That is, they have exported and analyzed the last 12 periods of non-conformance notifications (NCN) data.
Note: An NCN is issued when a quality defect occurs on the shop floor. Different organizations and different ERP systems may use another name for NCN’s, such as quality notification or QN.
Part of that analysis was to rank the types of NCN causes. To accomplish this, the engineers created the Pareto chart below. As you can see below, the Pareto chart clearly shows the relative importance of each kind of error.
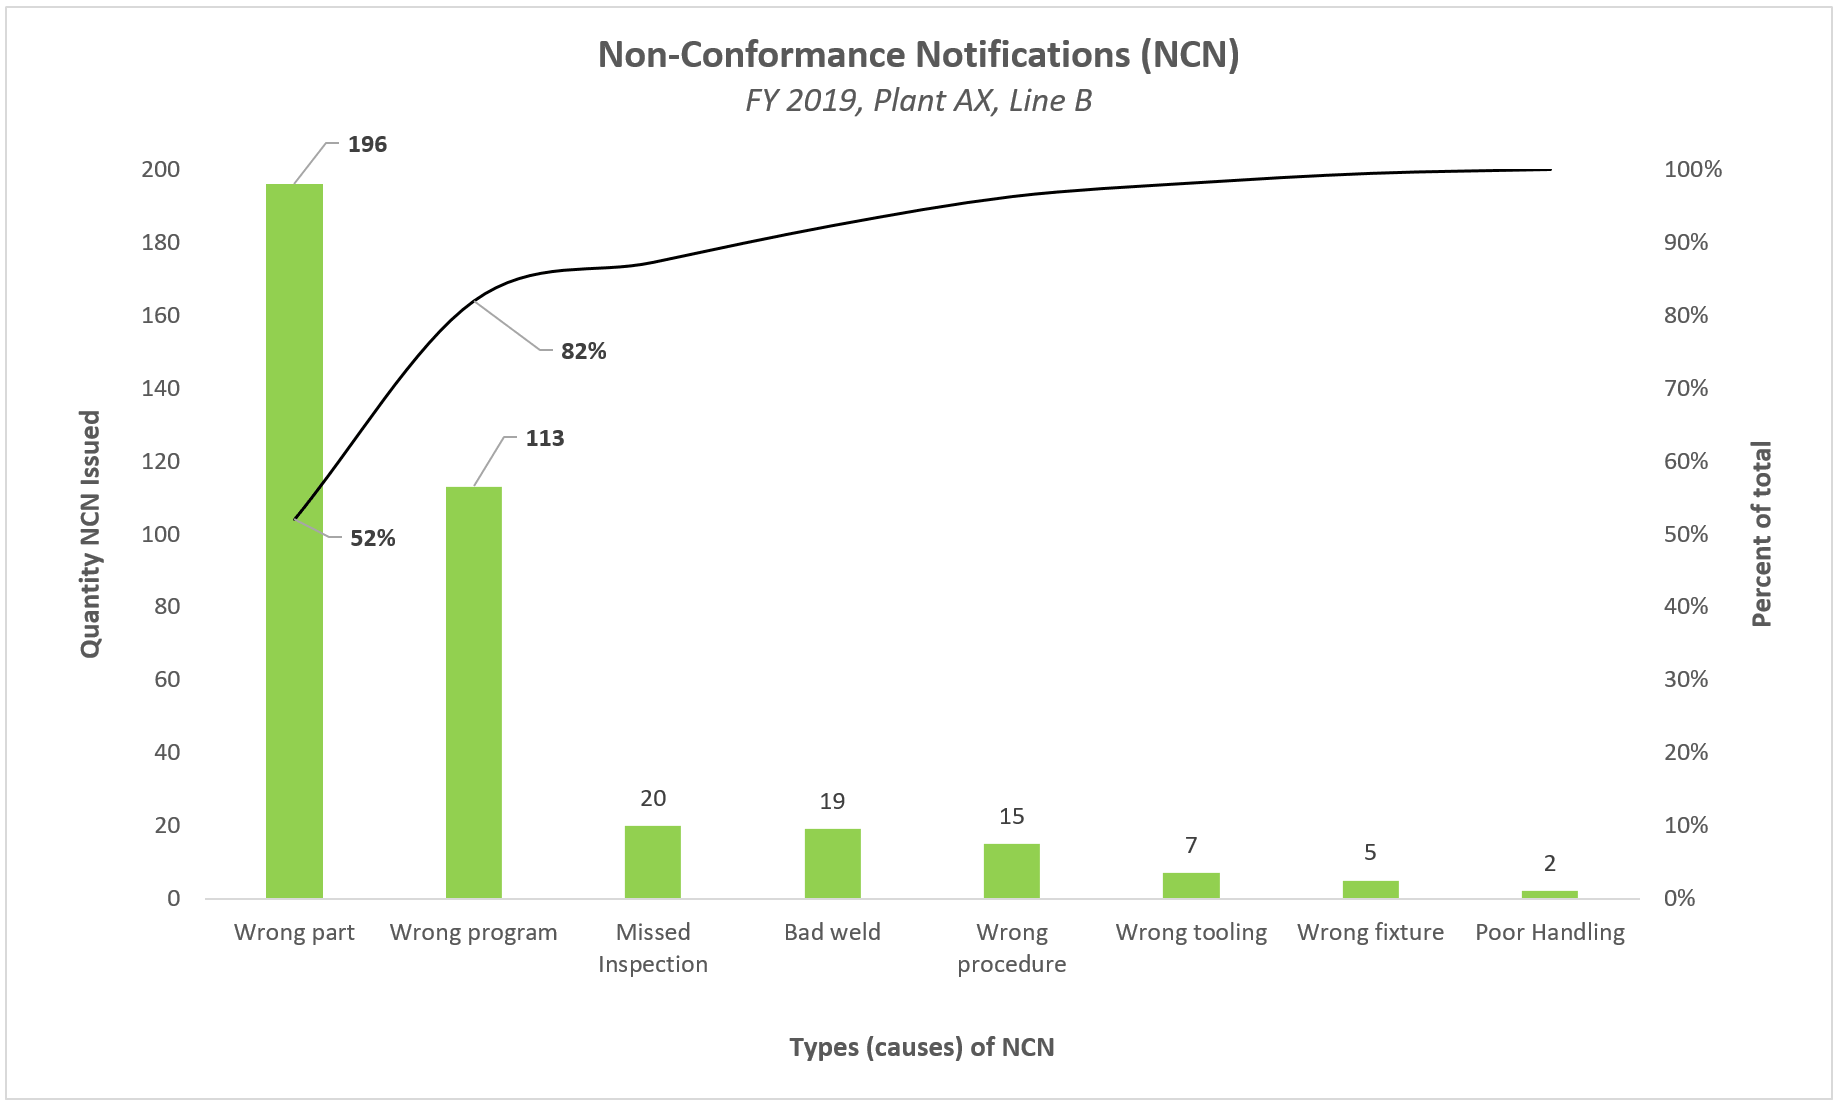
Further, the chart shows that two types of error, “wrong part” and “wrong program”, when combined, are responsible for over 80% of the quality defects on the line in the past year. It follows that these causes will also be the largest factor contributing to the cost of poor quality.
Regular management meetings
Each month the Quality Assurance team has a manufacturing corrective action board meeting to discuss plant metrics and performance. Quality engineers add the Pareto chart to the slide deck to discuss the findings with the plants’ Quality Assurance Manager and the Division Master Black Belt.

The black belt does a quick, back-of-the-envelope estimate that shows that a 25% reduction in “wrong part and wrong program” could reduce the cost-of-poor-quality by $50k. Upon hearing this, the Quality Assurance Manager asks if anyone wants to volunteer for a DMAIC project team that will focus on the problem.
A junior quality engineer recently received his “yellow belt” and thinks the project is an excellent opportunity to continue his training. So, he volunteers to validate the opportunity. And with that, our example project begins to take shape.
Phase II: Measure
If you recall from our Introduction to Lean Six Sigma DMAIC Methodology, the primary purpose of the measure phase is to define the current state by gathering the necessary data.
Gather data
In the Pareto chart above, we see the most frequent cause of NCN is “wrong part/wrong program”. Well, if the project team already has 12 months of data, do they need a data collection plan? Yes and no.
Ultimately they need to verify the accuracy of the data they already have.
The team begins by brainstorming the following list of questions:
- Who entered data?
- How did they determine that “wrong part/wrong program” was the cause?
- What about possible supporting evidence required to determine the cause?
- Is the person making the decision qualified to do so?
- Is this qualification certifiable in some way?
- Did they receive special training? If so, what did that entail? Is it adequate?
- Or, is it possible that they are wrong about the cause?
Deep dive into data
With the questions above in mind, the team can begin to look into the NCN data. As they do, they note that there are over 6,000 rows of data and that each row is equivalent to one NCN record. They divide the documents and begin to study each in detail. It is certainly not a quick process, but their efforts lead to an important discovery.
The team learns that for each record, there is supporting evidence that allows them to answer many of the questions from the brainstorming session. This evidence includes root cause analysis (RCA), corrective action request (CAR), and preventive action request (PAR).
Data accuracy and measurement system validity
At this point, the Quality Engineer explains that with the supporting evidence, they have sufficient means to validate the measurement system. The project leader discusses this point with the project sponsor. They both agree that the team does have enough to validate the accuracy of the data.
Now the team must audit a statistically valid sample of the supporting evidence for each record. This step is what validates the measurement system and ensures the accuracy of the collected data.
Next, they need to determine how many records will equal a statistically valid sample size. For this, the team uses a free tool they found online.
The result shown below tells them they must audit 361 records to have a statistically accurate measurement. By dividing the work between the five team members does help, but it still takes the team a week or so to each audit the supporting evidence for roughly 70 NCN records each.
Phase III: Analyze
Primary goal
In the analyze phase, the team needs to know how sources of variation in the process lead to lower quality output (defects). They decide to set up brainstorming workshops with groups of machine operators, production supervisors, and manufacturing engineers.
In the sessions, each group will create a fishbone diagram. They believe that this exercise will provide insights into potential critical x’s and the effect on critical y’s.
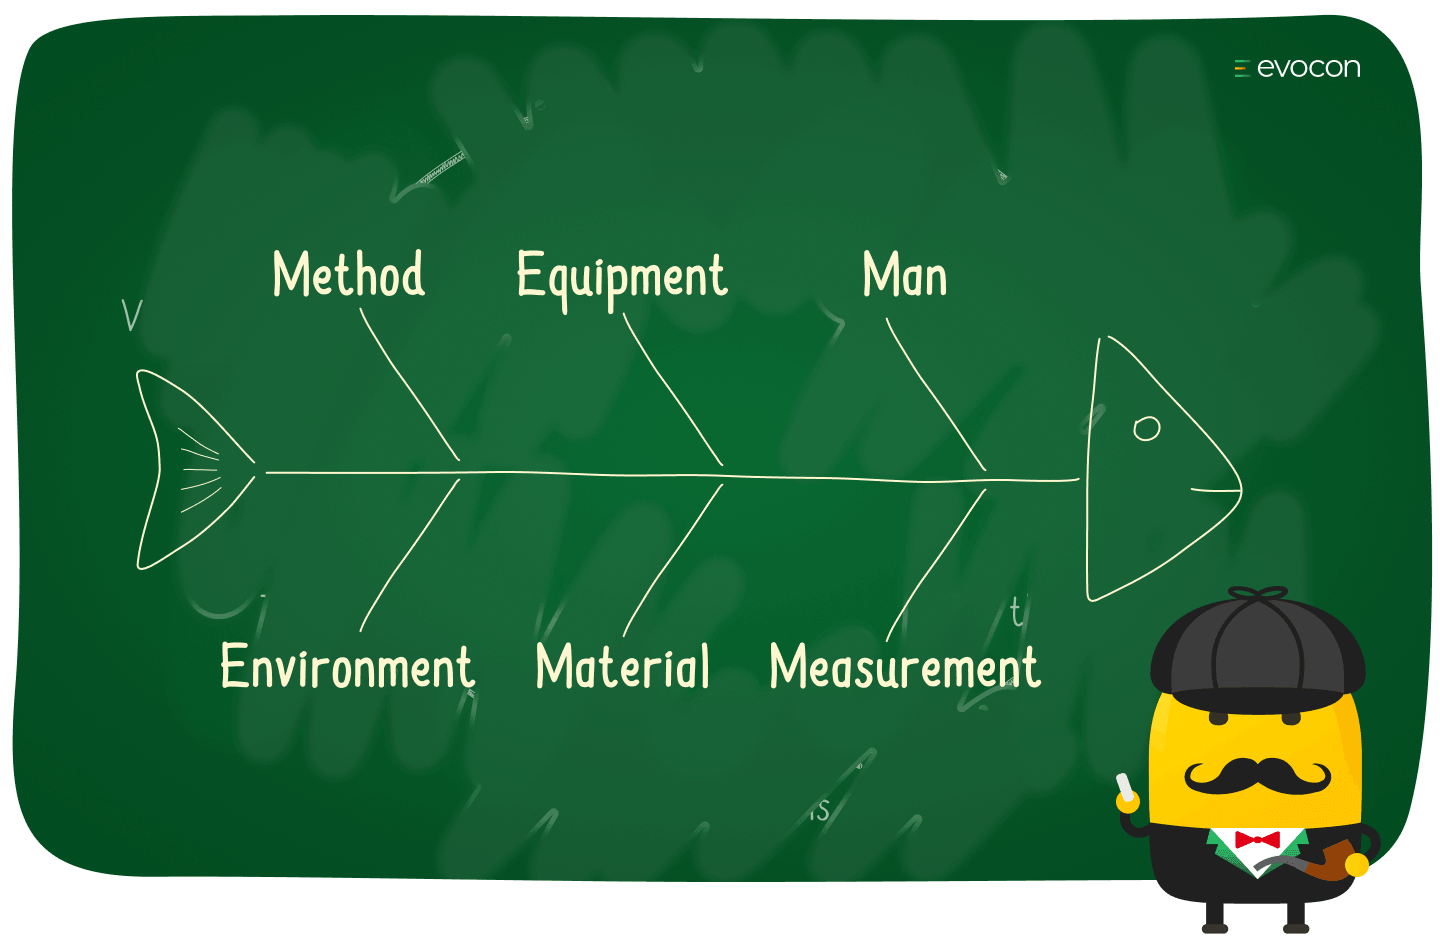
After the workshops conclude, the team combines the fishbone diagram data and categorizes all insights. The result is that an interesting trend emerges.
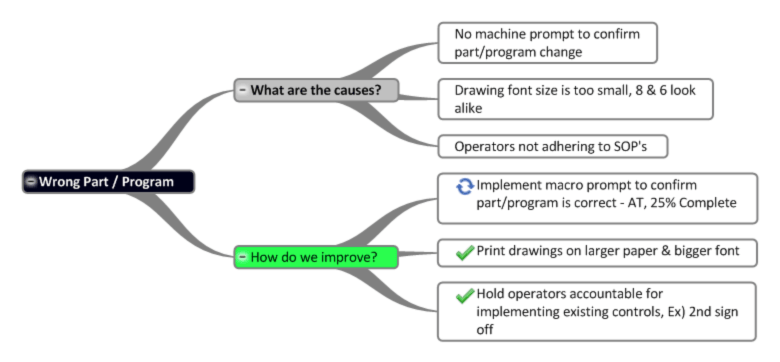
Root cause
Operators, production supervisors, and engineers agree that the majority of instances of “wrong part/wrong program” are due to operators adjusting the machine offset of a program.
The team follows up with several operators to learn why they needed to change the machine offset. They realize that this was the standard operating procedure they were given for the task. However, when they consulted the plant quality management system (QMS), they found that the standard operating procedure (SOP) had been updated last year, but the update had not been communicated to production.
The result of this error is that the operator could only guess the correct setting of the machine offset. Luckily, several operators had extensive logs of the offset values they used for each program and the outcome of using that setting.
Manufacturing engineering combines these logs and scrubs the data. For the following 24 hours, the engineers hardly leave the shop floor but have stated that they have a solution.
Phase IV: Improve
The project moves quickly after a meeting the following day, where the engineering team explains that they have implemented a solution to the problem. The project team is a little surprised at first. Then they consider that the average cost of a defect is approximately $10k. After a brief discussion, the team agrees with Engineering’s quick implementation.
When a quick and simple action can prevent the business from losing money, there is no justification for waiting until the Improve and Control phase to implement changes. You make the change and take the quick win.
So once engineering confirmed the root cause, they also identified how to mistake-proof (poka-yoke) the process. All that was needed was to simply rewrite the machine program so that it excluded the option to change the machine offset.
The logic is simple.
- Wrong part and wrong program accounts for over 80% of all NCNs.
- The largest source of process variation that leads to wrong part and wrong program NCNs is the operator’s ability to change the machine offset.
- If you eliminate the ability for operators to change the machine offset, you also eliminate 80% of the future defects due to the wrong part and wrong program.
Thus, it stands to reason that the performance of the process will improve due to the change.
Phase V: Control
At this point in our example project, there are only a few steps that remain. The main requirement for the team is to monitor the process data to ensure that the improvement does prevent future occurrence of the primary root cause.
Tip
Automating data collection using production monitoring software has the potential to reduce the amount of effort required to monitor the effectiveness of the solution in real-time.

Also, the team will need to catch up with the solution by communicating the changes to operators and updating the standard operating procedure (SOP) in the Quality Management System (QMS). To this end, they create a few slides on what changed and why. The slides are presented to operators on the shop floor later in the week. And, with that, our example project concludes.
Keep Learning
The example project did not provide the opportunity to demonstrate and describe the full range of tools and techniques that one may encounter while working through the phases of a DMAIC project. And, in our experience, no real-world project provides such an opportunity either.
Still, our example is a plausible scenario for how a DMAIC project can play out. It also reinforces our point that DMAIC in the ideal world vs. practice can look very different. And this is not just the sequence of steps, but also that the tools used and the time spent at each phase.
Thus, our recommendation for anyone who wants to gain exposure to the many techniques and endless variety of routes that a project can take to completion is to get involved at your plant and seek certification in Lean Six Sigma.