 Enterprise Package
  Integrations
  Security
  Hardware
 How Evocon Works
  OEE Monitoring
  Increasing Productivity
 OEE Calculator
  Evocon
  Join us
 Companies often underestimate the cost and amount of downtime they experience, even though it greatly impacts the capacity of an entire shop floor. The accuracy of this estimation, of course, depends on the accuracy of production monitoring, but there is more to it, as our research shows: it is very important what we focus on.
The focus is usually on downtime due to breakdowns and other unplanned stoppages. But our data shows that breakdowns only compose a small part of the whole downtime. The rest of it is overlooked.
In this article we will explain why we have reason to think that currently there is too much focus on breakdowns. Then we will dive into our data to show what types of downtime are the biggest in terms of overall duration. For this research, we will use our own data, insights of artificial intelligence (ChatGPT) and the experience of our industry experts.
The Usual Suspects: Breakdowns and Other Unplanned Machine Downtime
Today one of the most effective ways to start researching subjects, especially if a quick summary is needed, is to use ChatGPT. We asked it about the cost of downtime (note – downtime, not breakdowns) to incoporate it into our own insights.
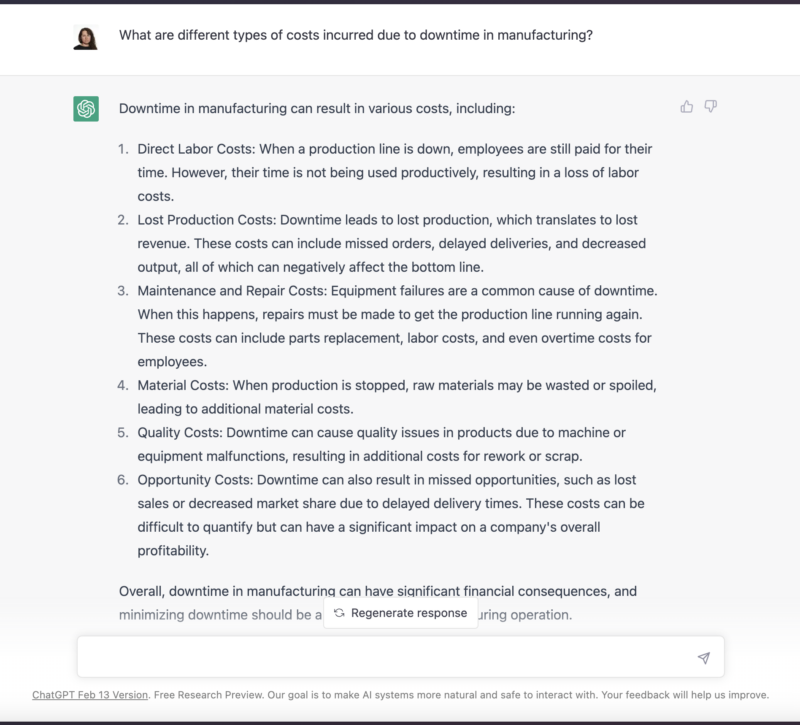
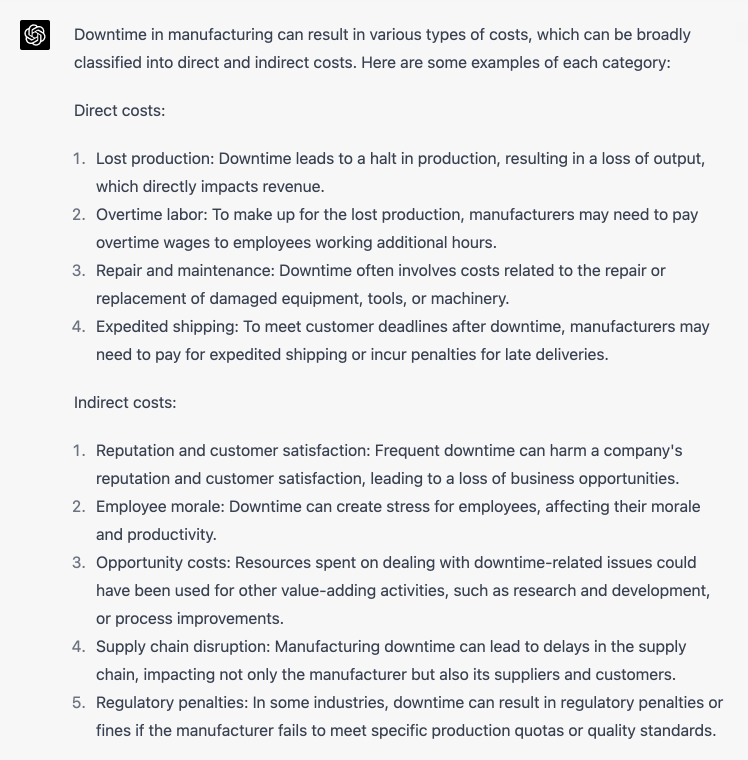
Chat GPT’s answers revolve mostly around such types of costs as having to pay for idle or overtime labor, cost of repairs and extra maintenance, material waste or scrap due to unexpected stoppages, supply chain disruption, and expedited shipping costs, also missed business opportunities, damage to reputation, various penalties, as well as safety concerns, lower employee morale, and productivity.
All of these types of costs occur due to unplanned downtime, often – due to technical reasons (breakdowns). Breakdowns typically cause such problems as wasted materials or products of lower quality, safety and morale problems, and, of course, they cost in extra maintenance cycles, repairs, or even equipment replacement.
Other types of costs may be related not just to breakdowns, but to other types of unplanned downtime. For example, unexpected shortage of workers or materials may cause delays, supply chain problems, increased shipping costs, reputational challenges and so on.
Here is what industry expert Spiros Vamvakas, who has consulted in more than 100 factories in the last 4 years on OEE and downtime monitoring, says about that:
“When consulting companies, one important thing I notice very often is that most people equate downtime to breakdowns. We see the same tendency in the answers given by ChatGPT. This is because ChatGPT is trained on the content on the internet, and most of that content is about breakdowns.
But what happens in companies when they start measuring downtime and categorizing it by downtime reasons, is that breakdowns occur only in third, fourth, or fifth place, but not first. There are other causes of downtime, for example, changeovers, material refills, etc. The cost of this type of downtime is already calculated in the cost of the product. But, nevertheless, it is a cost.
It would be interesting, however, to see what are the other top reasons of downtime among Evocon clients, besides breakdowns.”
Speaking of costing, we have an article about OEE as a Financial KPI and Its Use in Product Costing.
What Are the TOP (in Terms of Duration) Downtime Reasons?
For the overview of the biggest contributors to downtime among Evocon clients, we will do a quick research consisting of two parts:
- First, we will look at five randomly picked clients anonymously, to see some specific examples.
- Then, we will aggregate data across all of our clients, to see the big picture.
Due to a very large amount of data, we will limit our timeframe to one month: the month of March 2023.
Before you dive deeper into our analysis, we recommend reading our article about how to define downtime categories.
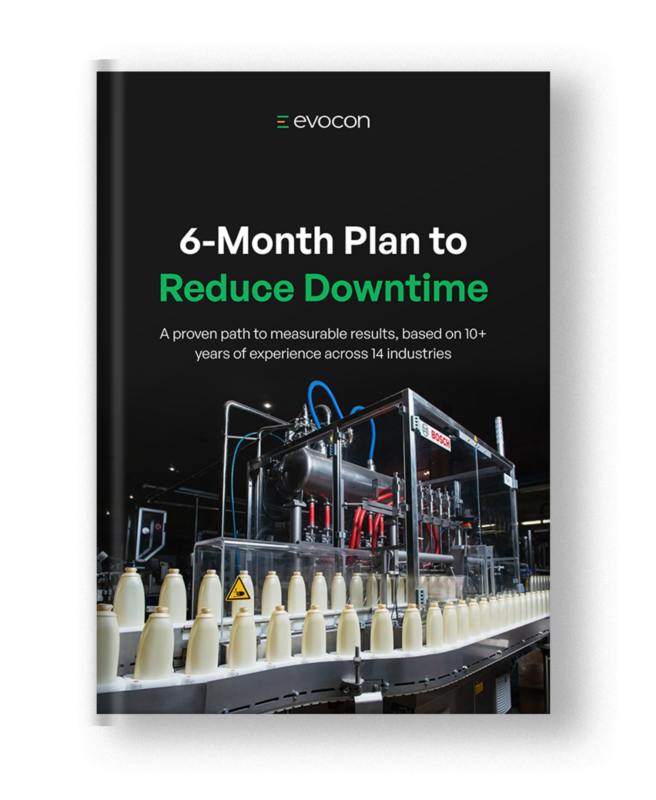
First randomly picked client and their production downtime at a glance
The chart below shows the duration of downtime, summed up for the month of March and broken down by its reason, for one Evocon client, picked randomly. Each column represents a single downtime reason, it’s height corresponds to the total duration for the whole month. Colors are the choice of the client.
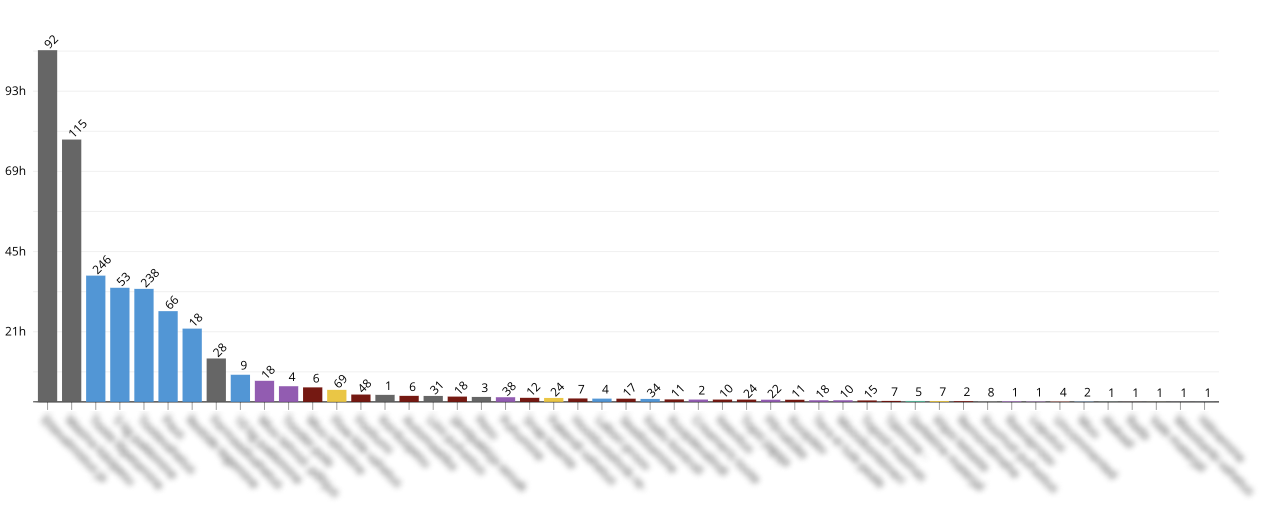
For this particular client (food and nutrition industry), the biggest contributor to downtime is “preparation and washing”, which happened 92 times in March, and took 105 hours in total, or slightly above 1 hour on average each time it happened. The client has marked this as “planned downtime”, which means that it does not decrease their OEE when it happens.
The second biggest contributor is “machine washing by hand” – 115 times and 78 hours in total. This downtime is also marked as “planned”.
The next seven downtime reasons (six blue ones and one grey) relate mostly to changeovers and breaks, they are also all planned downtime.
Only in place number 10 do we start seeing unplanned downtime, which is named as “other technological reasons” and amounts to 6 hours in March.
To conclude, the majority of this client’s downtime is planned and does not affect their OEE number, therefore the impact of it is not brought out via OEE analysis. Yet the amount of it is very big, and one could argue that even though activities such as preparations, washing and changeovers are necessary for production, but looking for ways to shorten those types of downtimes might have the most potential to increase efficiency.
Read more about how our clients analyze their downtime and what methods they apply to increase efficiency.
Downtime Tracking Software
Start measuring and optimising your downtime with Evocon’s 30 day free trial.
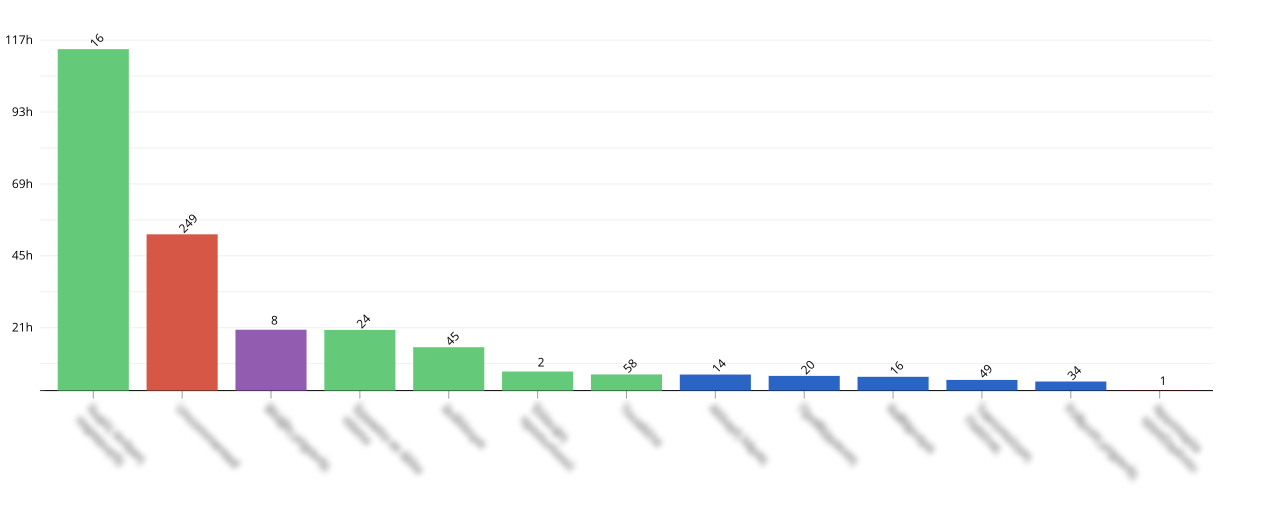
Second randomly picked client
Here is one more pick. Industry: construction materials and solutions.
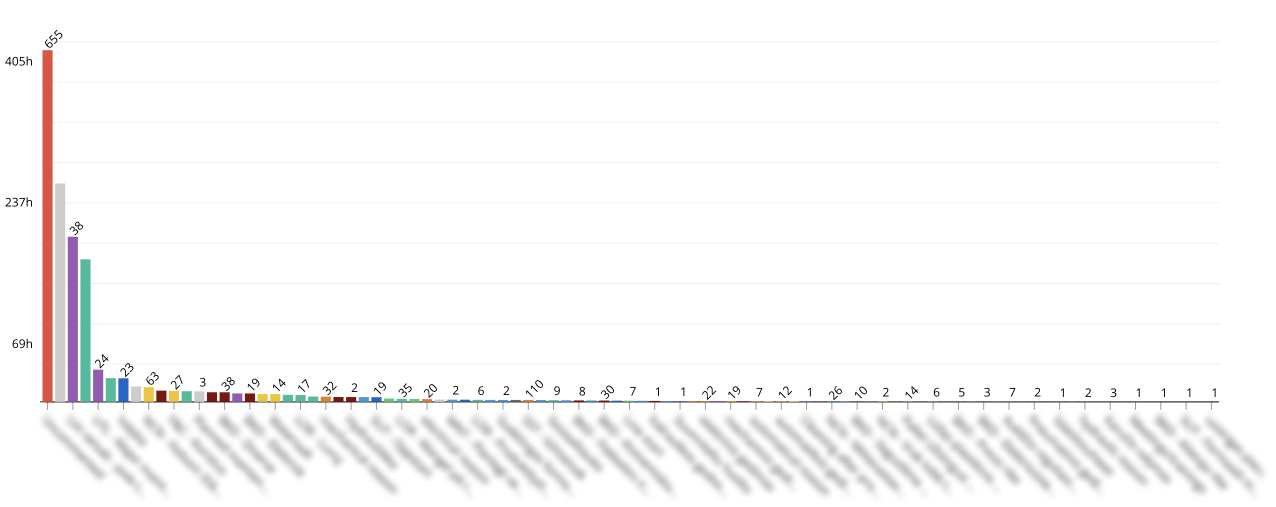
The first column on this chart shows that this particular downtime caused 655 stoppages and their total duration was 418 hours in March 2023. This bright red column is the sum of “uncommented” downtime, which means that it was recorded, but no specific downtime reason was assigned to it. Sometimes downtime reason can be assigned automatically, but most of the time it has to be done manually by people on the shop floor, and in this case, it wasn’t assigned neither automatically, nor manually.
Unfortunately, this still happens quite often. Among all recorded downtime across all clients, a big proportion of it is not commented (downtime reason not assigned). With the reasons of downtime unknown, improving production effectiveness is very difficult.
The other three biggest downtime reasons, shown in grey, purple and green, relate to having “no orders or no demand” – another very typical situation. This downtime is marked as “planned”, which means that it does not decrease OEE, but it still means that machines stand unused, so it would affect the TEEP – Total Effective Equipment Performance, which provides insight into the true capacity of production operation by taking into account planned losses as well as unplanned ones.
Step-by-step plan to cut downtime by 15%
Third, fourth, and fifth randomly picked clients
To speed up our analysis, we will only bring out some more interesting points about three more clients (industries: toys and games, consumer electronics, ventilation products and solutions).
The third client has “engine failure” as their third biggest downtime reason, and it is directly related to breakdown. It happened 8 times in March and amounted to 20 hours lost. It is uncommon for a breakdown to be so high up the list of TOP downtime reasons, and it also seems to be uncommon for this client as well because engine failure has not been an issue during previous months.

The fourth client has a breakdown as their 7th biggest downtime reason, and it is more persistent in their case, occurring regularly.
The fifth client does not seem to experience breakdowns, but some of their downtime reasons (specifically, starting from the sixth position) are marked as “unplanned”, and they are described as generic problems on the conveyor line, cleaning, setting up the line.
20 Most Popular Downtime Reason Types
Now let’s take a step back and look at a bigger picture. To do that, we will add up all data together like this:
1) adding the biggest downtime reason from each client into one number:
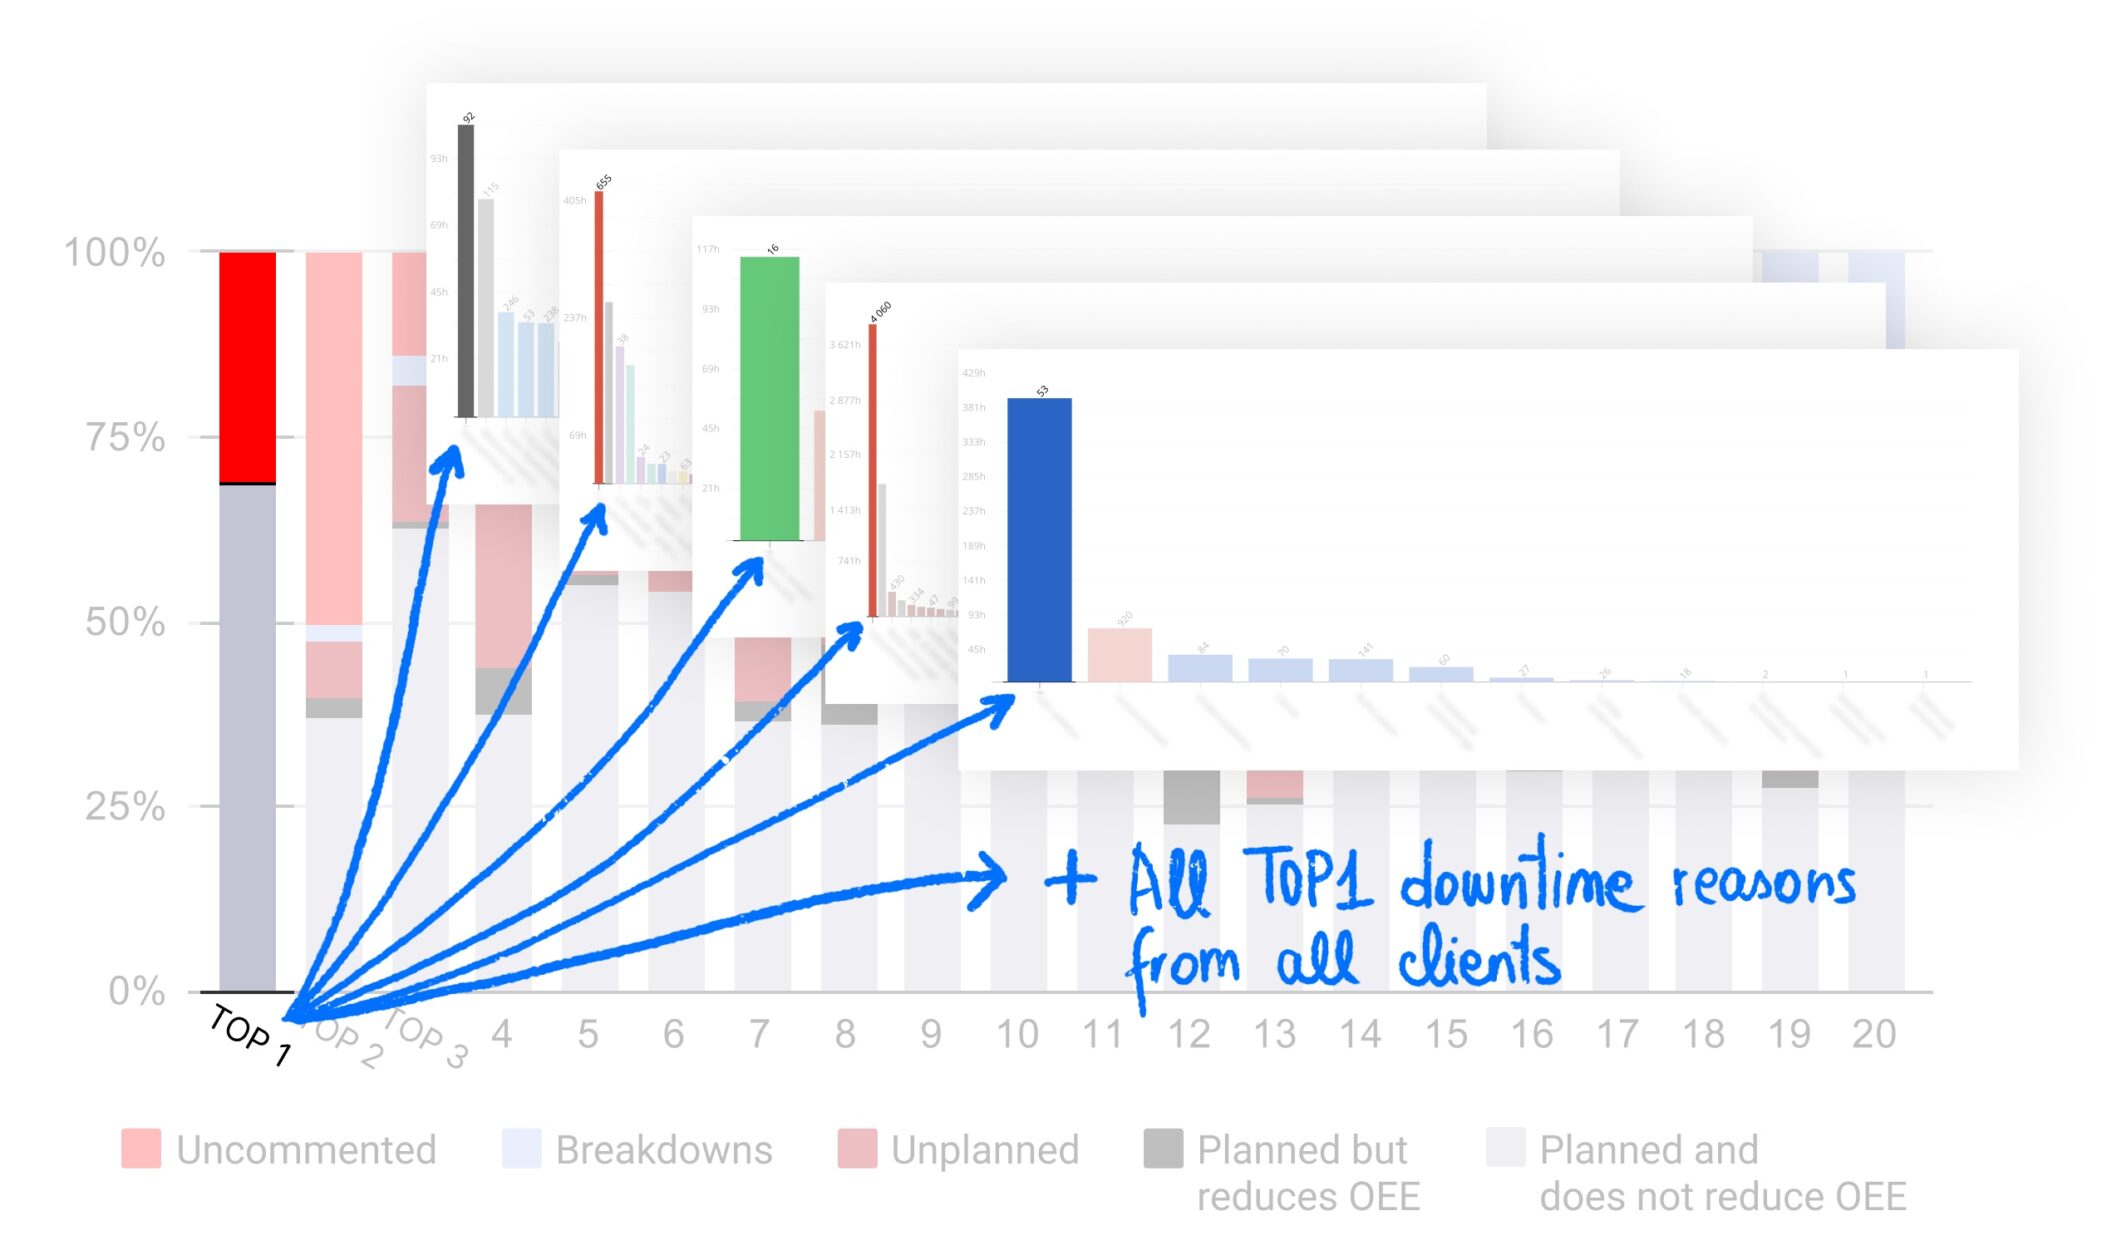
2) repeating it for the second biggest downtime reason:
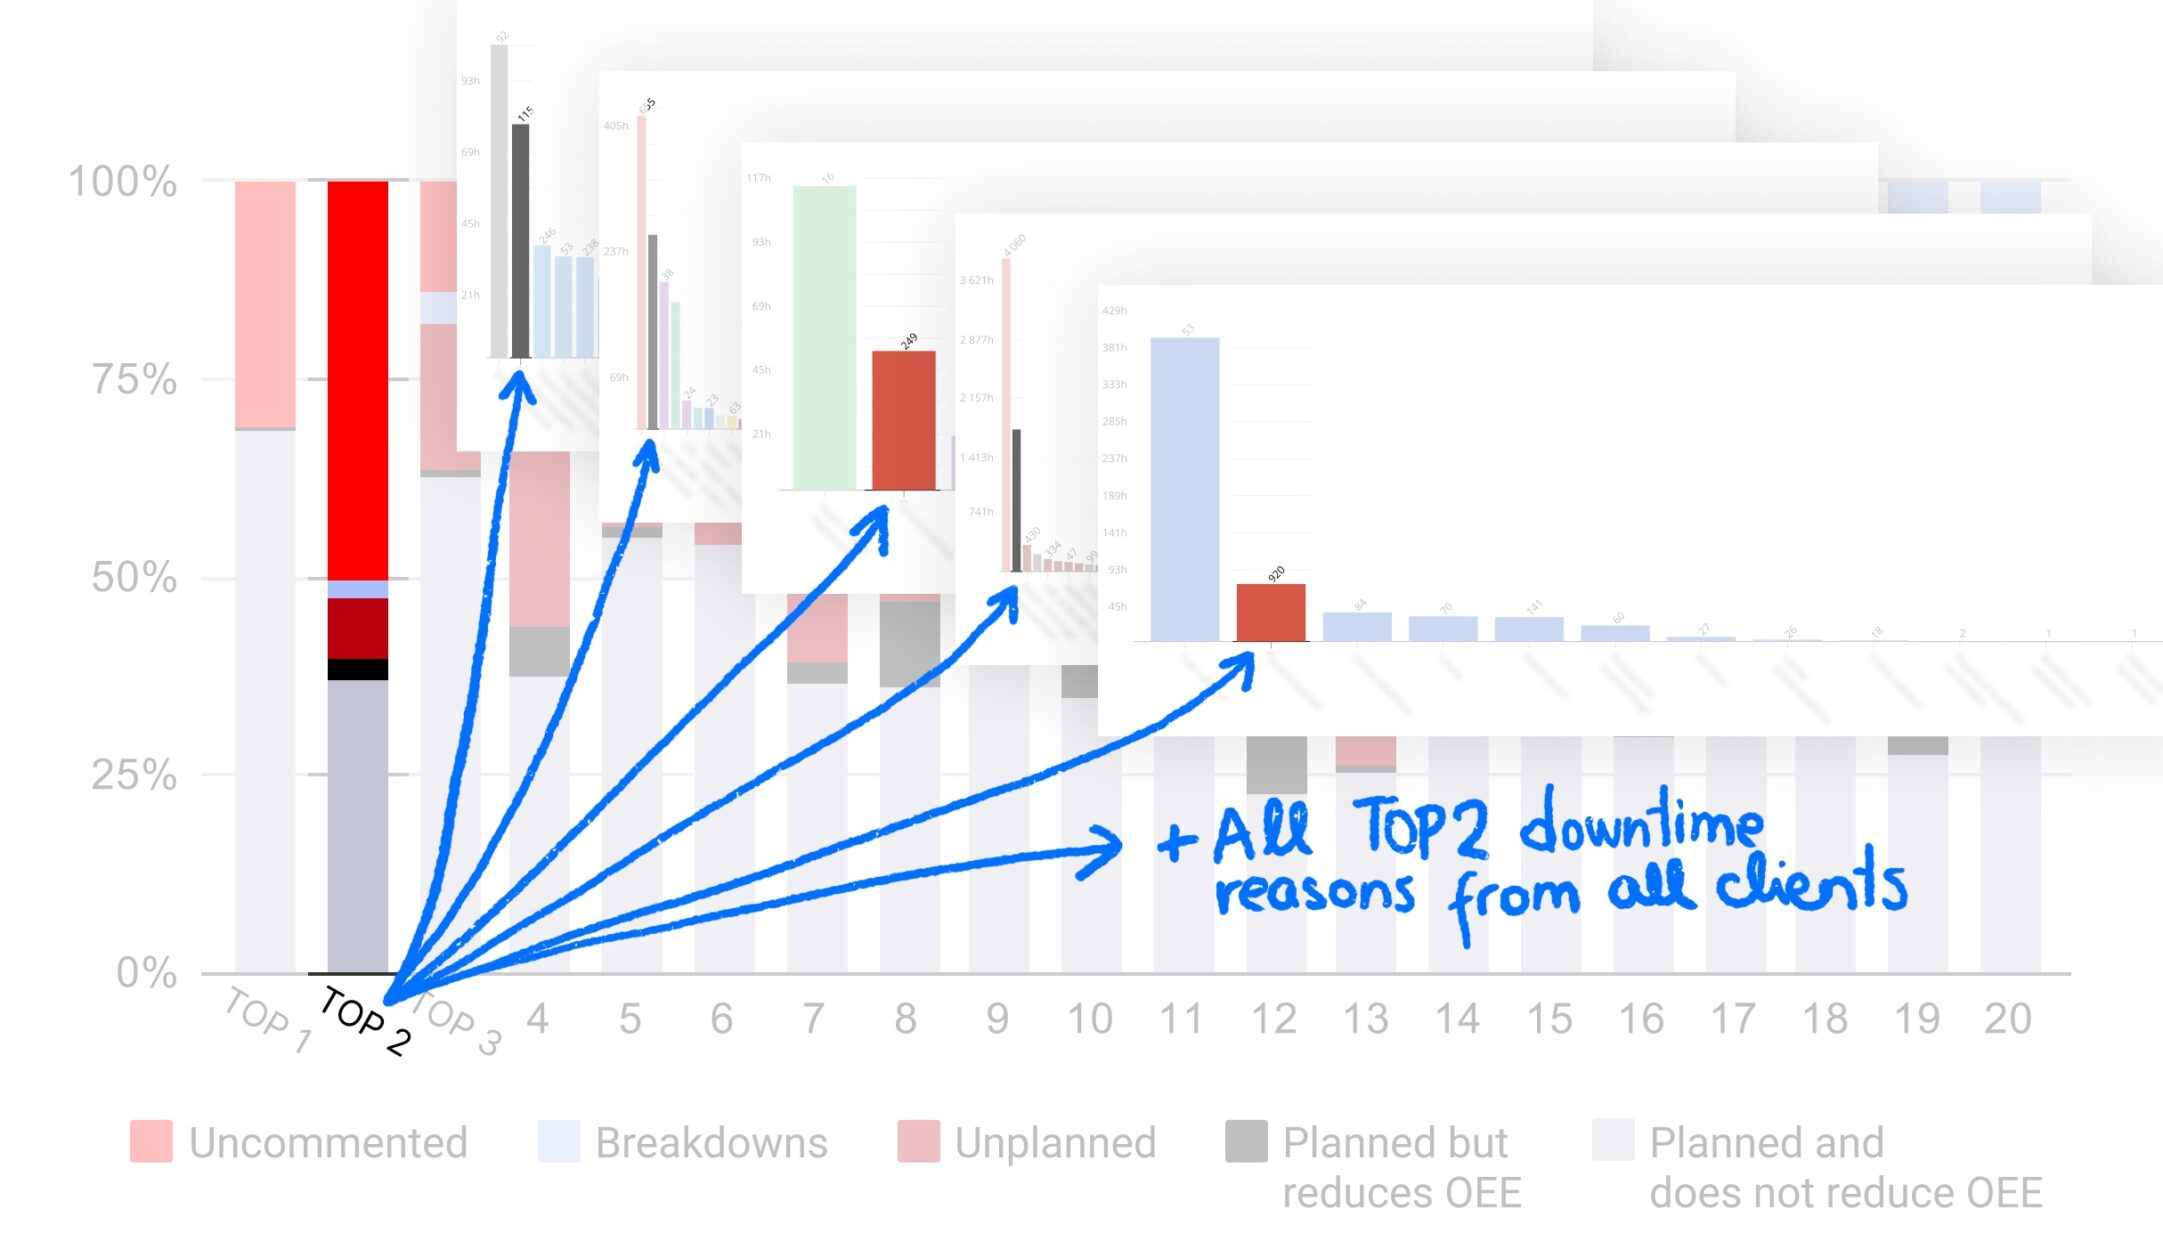
And so on. The result looks like this:
We will also get rid of all the different colors that were individual each client, and assign our own colors to downtime according to its type. Here’s what those types mean:
- Bright red is the downtime where the reason is unknown, and as you would expect by now, it dominates the list of TOP downtime reasons.
- Light grey is planned downtime that does not affect the OEE number when it happens. As we have seen above, this is often related to having no demand, empty shifts, various other idle time, but also related to activities such as cleaning, preparation, changeovers (although some clients caregorize changeovers as unplanned downtime).
- Dark red represents unexpected downtime, and the reasons for it are very different.
- Blue is also unexpected downtime, but it has a special additional type “technical”, used to indicate mechanical or electrical breakdown.
- Black color is an “in-between category”: this is downtime that is marked as “planned”, but it is still meant to reduce the OEE number when it happens. The purpose of that is to address this type of downtime during the process of OEE improvement.
From this chart we can see that industry expert Spiros Vamvakas was right about breakdowns appearing lower down the list of TOP downtime reasons. This statistics shows us that a lot of potential is “hiding” in unknown or planned downtime.
Conclusion
So, downtime is indeed a much bigger topic than just breakdowns or other unexpected problems. There is more to it than ChatGPT can tell us, and there is also more to it than many companies realize.
Which means that there is more potential for improvement as well – and to achieve it, you can use all of the same tools and resources that we used to write this article:
- real-time downtime tracking software,
- visual downtime analysis,
- artificial intelligence (not just for advice, but for analysis as well),
- and it would be great to have a human expert at hand.