 Enterprise Package
  Integrations
  Security
  Hardware
 How Evocon Works
  OEE Monitoring
  Increasing Productivity
 OEE Calculator
  Evocon
  Join us
 The power of OEE as a manufacturing KPI stems from its inherent structure that captures the effectiveness of a manufacturing operation from multiple different perspectives. In our articles about OEE, we’ve covered many aspects of this metric, but this time, we look at how OEE can be used as a financial KPI and how to apply it to product costing.
A Quick Primer on OEE
If you’re looking for a more in-depth dive into OEE before continuing with this article, we suggest reading what OEE is and how to calculate OEE. However, if you are familiar with the term, it’s enough to remind yourself that OEE shows us how efficiently we use our factory, our production equipment, and where our efficiency losses are.

Expressed as a percentage, OEE is a total measure of performance that helps focus improvement on the most critical areas of productivity loss. The three categories that form OEE are:
- Availability
- Performance
- Quality
A high OEE marks a highly efficient factory with high productivity. A low OEE, on the other hand, means there is a “hidden factory” with unused resources that are producing losses where there should be value.
The Monetary Value of OEE
Many management executives consider the calculation of OEE to be an effectiveness indicator of maintenance or production. They may not have the experience to realize that measuring OEE is about the entire company, and only when the information reaches all the departments the effort becomes collective. With everyone involved, the actual potential of the whole company can be pursued and unlocked.
In other words, if OEE is not only expressed as a percentage but in € or $ or any other currency, it could be better understood by everyone in the company, including financial managers, owners, and production operators.
For example, let’s say that at the end of a month, the quality index of OEE was 98% (i.e., waste due to scrapped products was 2%). Most would conclude that this is an outstanding performance as it’s only slightly shy of 100%.
However, say that the cost of producing one product is 2€ and the factory produces 2,000,000 units a month. For every 100 pieces produced, as we said above, 2 are thrown away as scrap. Thus, due to losses in quality, the factory loses 80,000€ each month.
Having this in mind, we might be rethinking how good our quality actually is.
The Economic Impact of OEE
Now that we understand that even a few percentage points can play a huge role let’s look at a more specific scenario to understand the financial impact of OEE in more detail.
Suppose your factory could produce 30,000,000 units/year (OEE at 100%), and that currently, the OEE of the factory averages at 64%. In this scenario, actual annual production is 19,200,000 units (30,000,000 units x 0.64).
Based on the DuPont analysis (used to evaluate the components of a company’s return on equity), if you sell these units for 0.75€ each, your annual turnover would be 14,400,000€.
Assuming that your variable cost per unit is 0.50€ and your total fixed cost – independent of production quantities – is 2,000,000€, you would have a total profit of 2,800,000€.
![[Turnover – Variable Cost*Sale Quantities – Fixed Cost = 14,400,000 - (0.50 * 19,200,000) - 2,000,000]](https://evocon.com/wp-content/uploads/2022/11/oee-as-financial-kpi-formula-01-800x301.png)
If you divide this amount by the plant’s OEE (remember, it’s 64% in our scenario), you’ll see that each percentage point, either down or up of the OEE, is worth approximately 43,750€.
| Data point | Value |
| Theoretical production | 30,000,000 units |
| OEE | 64% |
| Actual production (theoretical*OEE) | 19,200,000 units |
| Selling price per unit | 0.75€ |
| Turnover (actual production*selling price per unit) | 14,400,000€ |
| Production cost per unit (variable cost) | 0.50€ |
| Cost of goods sold (actual production*cost per unit) | 9,600,000€ |
| Operating expenses (fixed cost) | 2,000,000€ |
| Gross profit (turnover – cost of goods sold) | 4,800,000€ |
| Net profit (gross profit – operating expenses) | 2,800,000€ |
| Profit per OEE % (Total profit / OEE) | 43,750€ |
These calculations at the top management level are easy to understand. And based on the quantification of the above example, everyone in the company should understand the financial value of OEE and how significant the economic impact is when OEE changes.
How big of an increase can one expect in OEE for a plant in one year? Papoutsanis, Evocon’s client, improved the OEE of their factory by 30% (in 12 months).
What It Means to Improve OEE – CFO Point of View
Once you know how valuable OEE is, the next step is to optimize your operation and turn the hypothetical earnings into reality, as Papoutsanis did in the case study mentioned above. Let’s continue with our example and look at what happens when we improve our OEE and why it matters, especially through the lens of a CFO.

If you increase your OEE from 64% to 74%, you will increase your profit from 2,800,000€ to 3,550,000€. So it’s clear that the improvement in OEE will directly impact the company’s profitability, but the effects don’t stop there.
By monitoring OEE and understanding the underlying financial impact it has on the company, many activities become more predictable, including the planning of the production process. For example, the company can more accurately predict when it will need materials and manpower in production, how to plan transport, and regular maintenance.
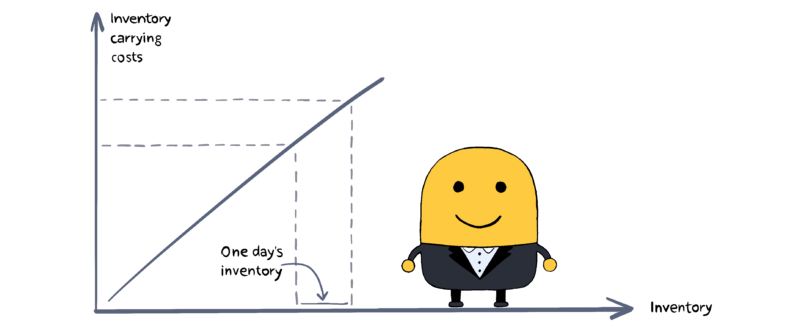
What is more, improving OEE will reduce the time needed to produce every single batch, which impacts inventory related costs, and this, in turn, has a direct effect on the bottom line.
The definition of inventory carrying costs is the expenses a company incurs by holding inventory (not only finished goods but raw materials and work-in-process inventory) over a period of time before they are used to fill orders. These costs include warehousing, equipment, salaries, damages, etc.
Since inventory represents a non-liquid asset that must be converted into cash through sales, then how efficiently a business manages this process will determine its profitability. The faster and more efficiently you turn materials into goods, the lower your costs related to inventory. The more you sell the products that are easier to produce (with higher OEE), the less time everything takes.
Understanding how OEE impacts inventory, we can ask the CFO of a company what it would mean to reduce the total production time of a product by one day. The answer to this question will give us yet another answer about the financial value of OEE.
Improvements in OEE can be achieved in a surprisingly short time. In fact, experience shows that many facilities show a measurable difference in OEE in just a few weeks by leveraging the right tools.
Start improving your OEE
Get all the tools you need to improve productivity and profitability. Free for 30 days.
The Use of OEE for Product Costing
Many companies do their best to accurately answer questions about production. For example, is the selling price right for Product A, which is intended for export, and does it have any other specifications at the same price in the domestic market, or how much less does product B cost, which is produced in large batches, versus C that requires frequent changes?
One of the tools that can be used to answer these questions through the cost-sharing of General Industrial Expenses (GIE) and accurately reflect the above mentioned difficulty in production is OEE.
GIE includes all and any expenses related to the production process, such as labor, energy, consumable manufacturing supplies, and general overhead.
Let’s consider the two following examples that illustrate this.
Example 1: Excluding OEE from product costing
Continuing with our hypothetical factory that produces 19,200,000 units annually, let us now assume that the GIE in this factory is 1,200,000€.
If this factory, not considering OEE, were to cost-share GIE based on production quantities only, it would look as follows.
| Domestic | Export | Total | |||
| Product code | SKU1 | SKU2 | SKU3 | SKU4 | |
| 12-month production (units) | 1,200,000 | 6,000,000 | 7,500,000 | 4,500,000 | 19,200,000 |
| GIE dividend rate (production /12-month total production) | 6% | 31% | 39% | 23% | 100% |
| 12-month GIE cost-sharing, per product (code) | 75,000€ | 375,000€ | 468,750€ | 281,250€ | 1,200,000€ |
| GIE cost participation, per unit | 0.06€ | 0.06€ | 0.06€ | 0.06€ |
We could say that with this simplified method, we “equalize” the cost to all products, based on the quantities produced, without considering the “difficulty” of producing each product.
Example 2: Including OEE in product costing
Let’s imagine now that the factory acknowledges the questions posed above. Furthermore, the factory takes into account the following set of questions that express the difficulty of production:
- Does a product in small batches, with frequent changes and delays in production, cost the company the same as a product produced in large batches, without long changeover times and continuously stopping?
- Does one product, due to some particularity, have twice the percentage of scraps than another?
- Is the shop floor forced to run production on some products more slowly because their “behavior” on the production line is unstable?
What if the factory used the OEE index to reflect the answers to the above question? What steps would have to be taken?
- The factory could divide each product’s OEE with the highest OEE of the company and create a “difficulty” factor.
- Then, by multiplying that difficulty factor by quantities produced per SKU, they would get the equivalent units (EU). Equivalent units represent the total hypothetical units to be produced if that difficult factor would be the same for each product.
- Finally, they would evenly distribute GIE to the new levelized quantities and calculate the new GIE cost participation per unit.
If all the above steps were done, the calculations would be as follows.
| Domestic | Export | Total | |||
| Product code | SKU1 | SKU2 | SKU3 | SKU4 | |
| 12-month production (units) | 1,200,000 | 6,000,000 | 7,500,000 | 4,500,000 | 19,200,000 |
| GIE dividend rate (production /12-month total production) | 6% | 31% | 39% | 23% | 100% |
| OEE | 50% | 80% | 65% | 45% | |
| Difficulty factor (highest OEE/OEE of product) | 1.60 | 1 | 1.23 | 1.78 | |
| Equivalent units (produced units*difficulty factor) | 1,920,000 | 6,000,000 | 9,212,391 | 8,026,756 | 25,159,147 |
| GIE distribution factor (equivalent units/total levelized quantities) | 8% | 24% | 37% | 32% | 100% |
| 12-month GIE cost-sharing, per product (code) | 91,577€ | 286,178€ | 439,398€ | 382,847€ | 1,200,000€ |
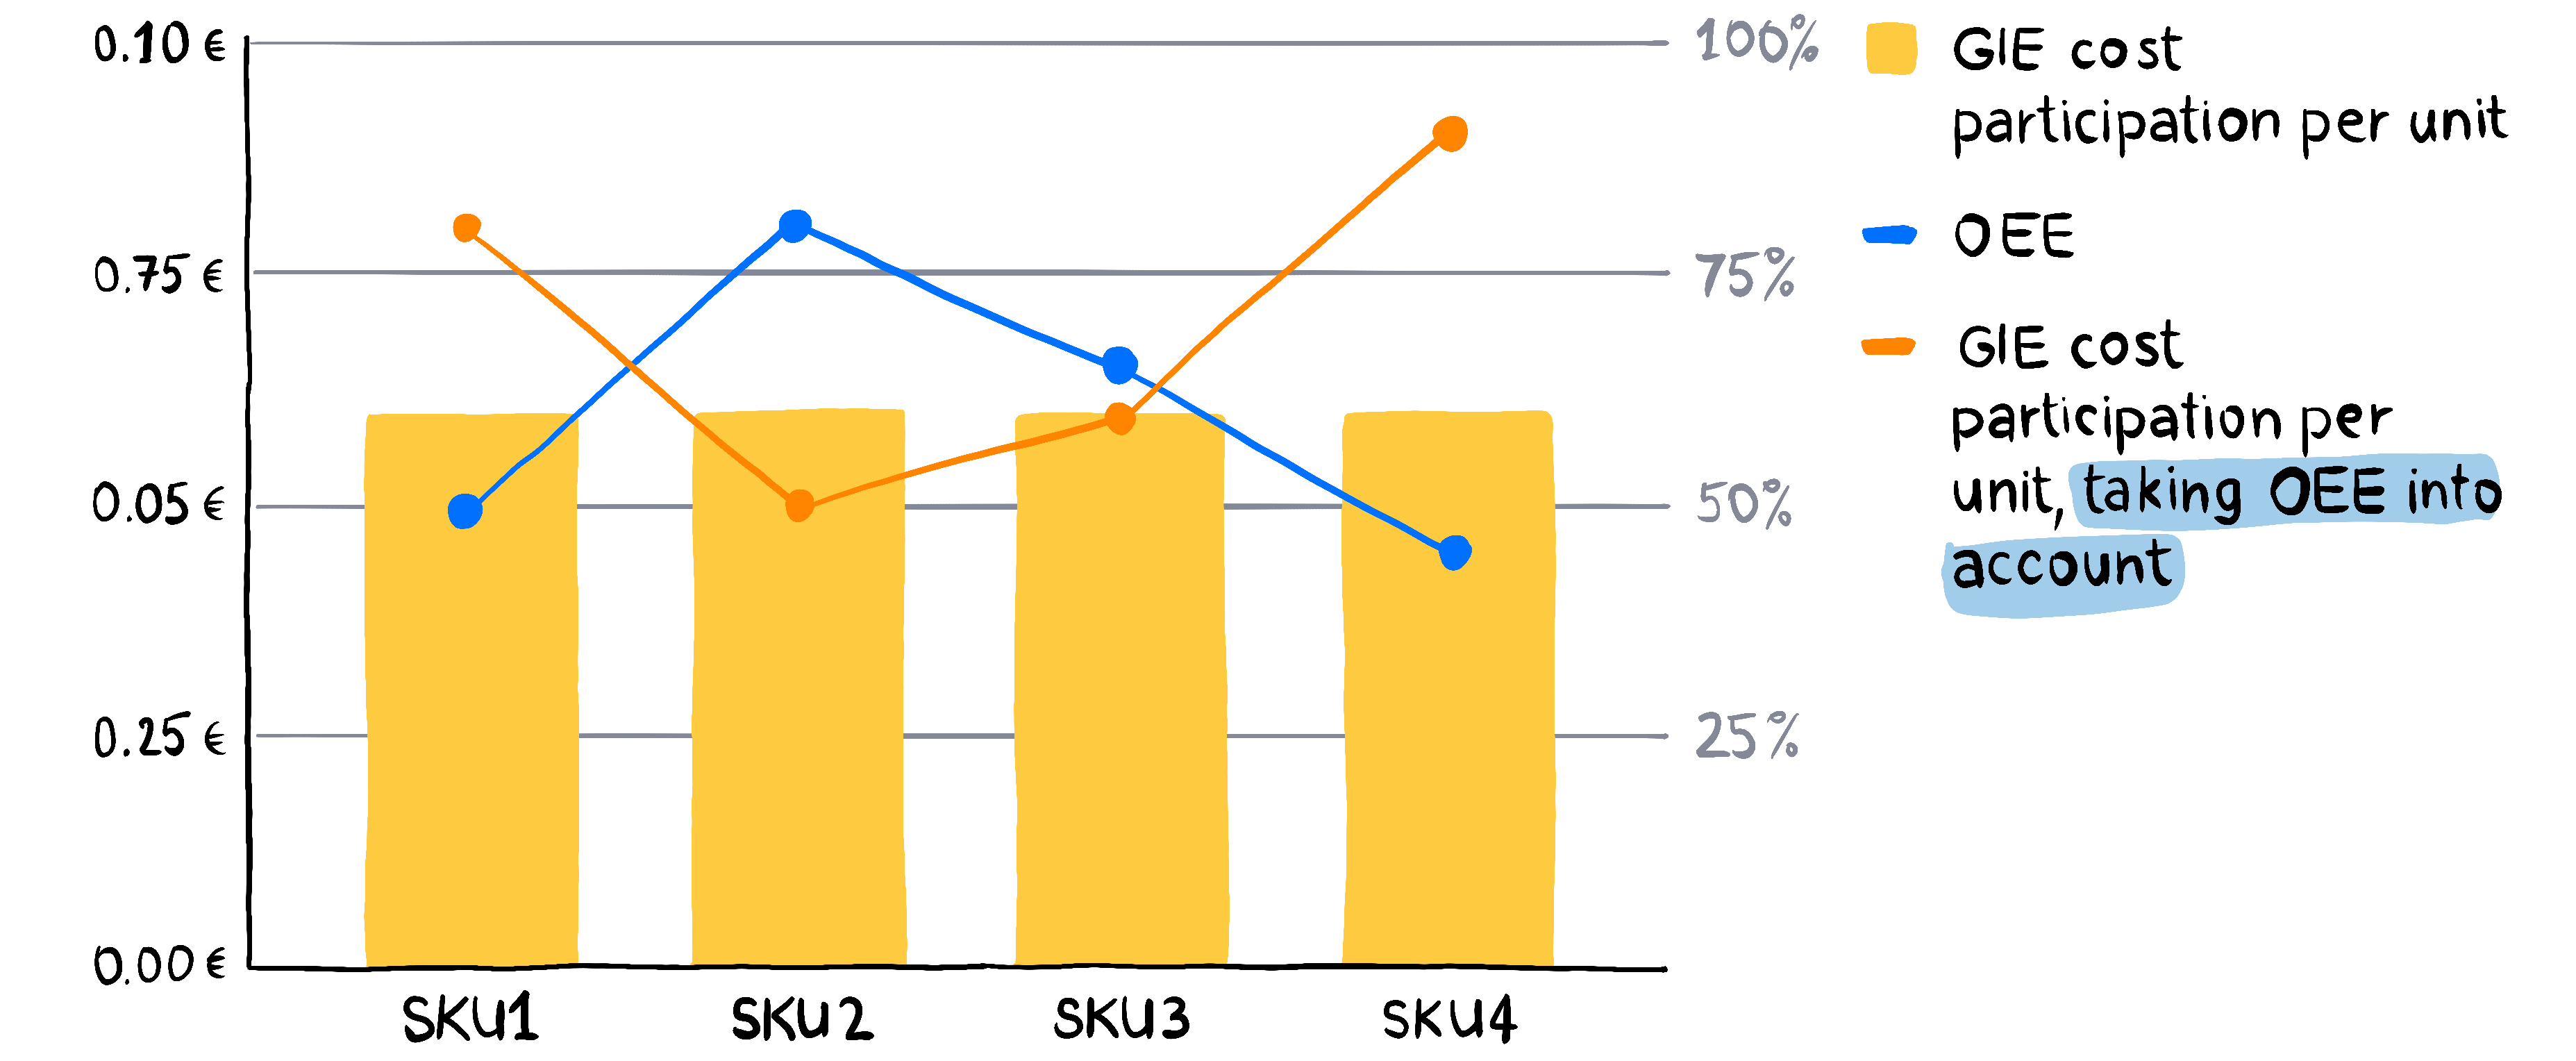
| GIE cost participation, per unit (12-month GIE cost-sharing per code/12-month production) | 0.08€ | 0.05€ | 0.06€ | 0.09€ |
With the example above, it becomes obvious how valuable it is to know the OEE of each product and to take that into account to get the correct costing of products.
According to our example, SKU1 GIE costing is 0.08€ and SKU2 is 0.05€, respectively, compared to the previously flat cost of 0.06€/unit where the factory did not consider the difficulty factor in calculations.
Let’s review how this information would help the factory better understand gross margins.
Suppose that both SKUs (1 and 2) have a selling price of €0.10 each. If the factory followed the simplified first approach, they would always consider having a gross margin of 40% on SKU1. But if they consider difficulty (OEE), they would see that the actual gross margin is 20% since it costs more than they estimated. Having this information, the factory should consider selling that product more expensively or include the correct margin in their financial plans.
In the case of SKU2, the actual gross margin would be 50% instead of 40%. The factory could use this information to sell this product with some discount if the market demands it.
Losing Out On Profitability?
The examples in this article hopefully prove to the reader the usefulness of OEE as a financial indicator. What remains is to ask how much manufacturers are losing out on potential profitability who still don’t know their availability, performance, quality, and total OEE.
How costly could one year end up being without this information?
Bibliography
- Lean Team USA, 2022 https://www.leanteamsusa.com/oee-integrated-with-financial-performance/
- Gygi, C., Covey, S., DeCarlo, N. and Williams, B., 2012. Six Sigma For Dummies (2Nd Edition). Wiley.