Evocon's Overall Equipment Effectiveness calculator helps you estimate your OEE and calculate OEE components.
We know that OEE is a performance measuring metric that shows how effectively a factory is utilizing its equipment. But we can also look at it in terms of possible opportunities and hidden potential of your factory.
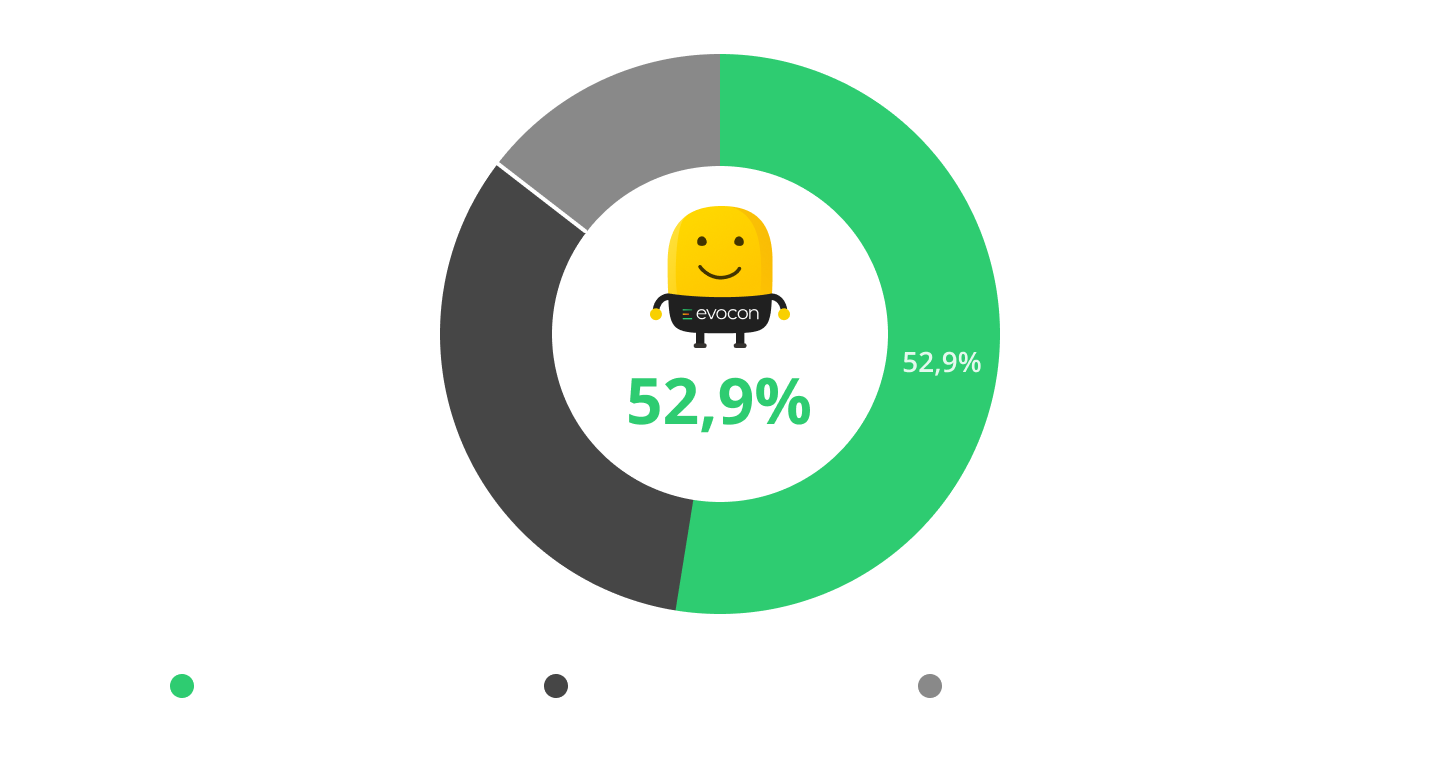
The chart below shows what is possible based on inputs in the calculator above.

Have a look at our ROI calculator to find out exactly how much additional value (or savings) you create if you achieve a certain OEE growth.
If you want to start harnessing your potential, you can register for the free trial of Evocon and find out exactly what your OEE is and how much room there is for improvement.
The first part, “Calculate OEE”, in the OEE calculator delivers the value using minimum information:
To calculate your OEE in a simple way, this is all you need.
The second part, “Calculate OEE components”, gives you the values of Availability, Performance, and Quality components of OEE. This part needs additional information:
You may notice that if you change the second part in the calculator, the OEE value does not change, only the OEE components change.
Below, we have an introduction to how OEE is calculated, common mistakes made, and how to troubleshoot the OEE calculator.
Overall Equipment Effectiveness (OEE) shows how many products you actually produce, as a percentage of how many you could produce if the equipment was running at theoretical maximum speed with zero scrap and rework.
If we replace the words in this sentence with numbers:
Number of good products you produce
Number of products you could produce theoretically
The “number of products you could produce theoretically” refers to your theoretical maximum for the given time period:
You get the theoretical maximum () if you multiply the scheduled working time () of your machines with your maximum production speed ()
Number of good products you produce
Number of products you could produce theoretically
Number of products you produce
Scheduled working time x Maximum production speed
Number of good products you produce
Number of products you could produce theoretically
Number of products you produce
x
Sometimes the manufacturer of the machine specifies it (alternative terms – “nameplate”, or “ideal cycle time”). If not, you can identify the fastest recorded time by looking at historical performance and then calculate how many products you would make if your machines were constantly running at that speed.
Being able to calculate OEE with minimum information means that you can find it out as early as possible, without knowing your downtime and quantities of scrapped products. This helps you set a baseline that you can use in the future to evaluate your trends and the impact of process improvements. It also allows you to benchmark within the company and against industry averages.
From our experience, most of Evocon’s clients initially overestimate their OEE values compared to the actual numbers measured with an automated system. This will often come as a surprise but also highlight great opportunities for improvement.
Here’s a quick snapshot of OEE and its components’ formulas:
OEE = Availability x Performance x Quality
Availability = Run Time / Planned Production Time
Performance = (Ideal Cycle Time x Total Count) / Run Time
Quality = Good Count / Total Count
For a more detailed look at the calculation, read our guide: How to Calculate OEE – Formulas & Examples
Now that you know how to calculate OEE in a simple way and set your baseline using our OEE calculator, you can set your target OEE and focus on improving your OEE. This is where the OEE components come into play:
The reason to calculate the components and not just OEE alone is that they show you how to improve OEE and eliminate the Six Big Losses in Manufacturing. For each of these components, there are different strategies and methods of improvement.
Watch the video below to learn more about OEE and how to calculate it:
Availability is essentially the time that your machines are actually working, as a percentage of scheduled working time.
This OEE component is especially useful in the beginning when you just start improving your OEE. Availability improvements are the “low-hanging fruit”. Downtime is fairly straightforward to estimate, and solutions often become obvious as soon as you start recording reasons for machine stoppages.
Performance (or production speed) shows how fast your machines or production lines are running.
100% Performance means that they are running at their maximum speed. 50% means that they are running at half the speed and producing only half the number of products.
So, to calculate Performance, you need to find out how many products you produce, and how it compares to the number of products that you could produce at maximum speed during your actual (not all scheduled, but actual) working time.
Turning your attention to Performance opens up new possibilities for improvement because Performance issues are often overlooked and underestimated by management. They are also difficult to detect if you collect production data manually. Therefore, implementing an OEE system gives you significant advantages.
Quality shows the proportion of good products among all products.
Defects are expensive since you waste the materials and lose all the production time spent making products that are scrapped in the end. In the case of rework, the extra time spent is wasted, and in most cases, rework creates extra losses due to the interruption of the standard workflow.
OEE components are often visualized as each of them being a percentage of the other one. Below is a visualization of this concept:
As you can see above, if you multiply all OEE components with each other, you will get the OEE value. Accordingly, if you know your OEE value and only two OEE components, you can find out the missing OEE component.
Using our OEE calculator online, you can estimate your current level, but we still recommend an automated solution and creating your own OEE Dashboard. Below, we discuss manual production monitoring and the benefits of an automated production monitoring system.
Manual production monitoring means that you use a stopwatch to track how long your machines work or sit idle. You could write down the times and notes with a pen on paper, or you could enter it in an Excel spreadsheet. Either way, it means that a human measures the work of a machine.
Manual production monitoring has a long history in manufacturing and provides significant benefits. It is quick and easy to implement and allows you to capture the most significant machine stops.
If the person who monitors production notes down the reasons for those machine stops, a simple analysis of data, later on, reveals the most popular downtime reasons. By eliminating these downtime reasons, you can improve your Availability.
However, manual production monitoring has a few problems. By installing an automated production monitoring system, you can achieve much more:
In short, automating production monitoring allows you to have more accurate production data, do more with it, and do it faster.
In other words, this is how you can achieve your full potential, which we talked about at the beginning of this article. Read more about how Evocon helps your company.
We hope that our OEE calculator and explanations show how simple it is to calculate OEE. But we would like to point out that there is also room for mistakes.
As we mentioned above, manufacturers tend to overestimate their efficiency levels. The most common mistakes highlight some of the reasons for that:

Besides these OEE calculation mistakes, you may find it useful to look into more typical mistakes of monitoring OEE.
Now that we have talked about measuring and calculating OEE, let’s take a look at how to improve it.
We have made a list of the 7 Best Practices to Improve OEE and Productivity from our clients:
Whether you used our calculator for a Simple OEE Calculation for a quick baseline or the Component Breakdown to find specific losses, knowing your numbers is only the first step.
Manual calculations are a great “snapshot,” but they can’t drive daily improvement. To truly get to your factory’s potential, you need to see these numbers live on the shop floor.
With an automated production monitoring system, you will be able to visualize the performance of your machines or production lines in real time and act based on accurate, reliable production data (as our clients did).
Now that you have a stronger understanding of OEE, check out our other resources on how to increase your OEE in practice:
Try Evocon free for 30 days, to start tracking and improving your OEE.
The reason is that the sum of values in your “Quantity produced” and “Sum of scrap and rework” fields is too high.
If you are sure that your “Quantity produced” and “Sum of scrap and rework” are correct, try adjusting other settings:
It is common among manufacturers to underestimate their theoretical maximum production speed which means that calculated Performance is more than 100%. But in the OEE framework, your Performance should never be above 100%.
How to find out your maximum production speed?
Sometimes the manufacturer of the machine specifies it (alternative terms – “nameplate”, or “ideal cycle time”. If not, you can identify the fastest recorded time by looking at historical performance and then calculate how many products you would make if your machines were constantly running at that speed.
If you are sure that your maximum speed is correct, try adjusting other settings:
* The values in this formula and the in following calculations are based on default settings of the OEE calculator.
* The values in this formula and the in following calculations are based on your OEE calculator settings.