 Enterprise Package
  Integrations
  Security
  Hardware
 How Evocon Works
  OEE Monitoring
  Increasing Productivity
 OEE Calculator
  Evocon
  Join us
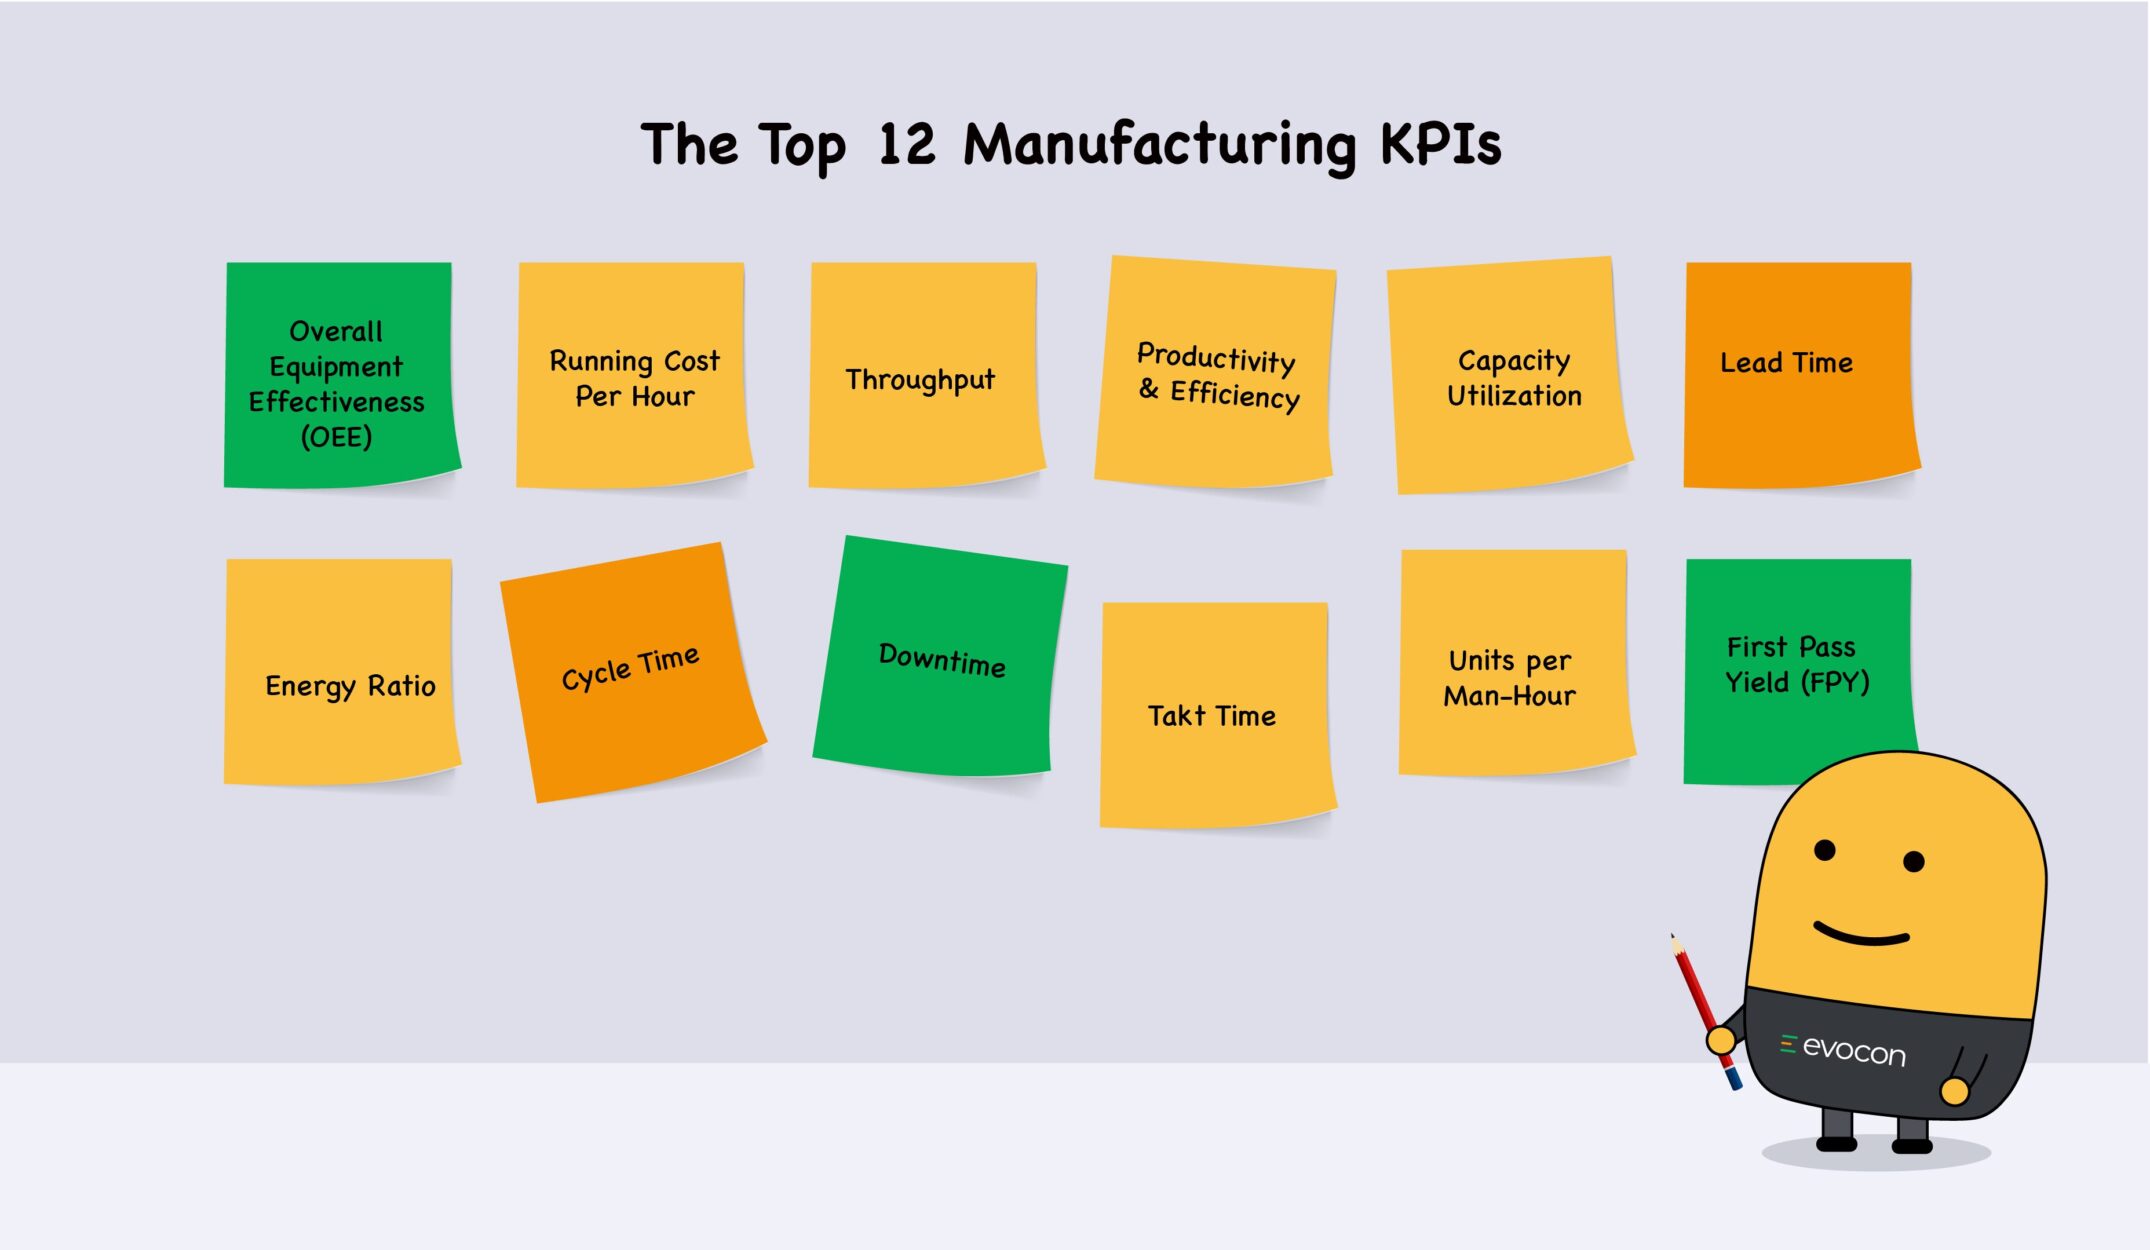
 As a manufacturer, you must continuously monitor and improve your operations, and that starts with tracking the right metrics. In this article, we explain how to choose the manufacturing KPIs for your operation and highlight the top 12 we recommend. Whether you manage a single production line or an entire plant, these KPIs will help you understand your performance and drive continuous improvement.
What Are Manufacturing KPIs?
KPIs, or Key Performance Indicators, are measurable values that indicate how well a business is performing against its goals. While many industries use universal KPIs like profit margin, sales growth, or customer satisfaction, manufacturing requires a more specialized set of metrics focused on production efficiency, resource utilization, and output quality.
Manufacturing KPIs provide a data-driven view of production performance. They help managers by providing insights into where improvements can be made. Choosing the right KPIs ensures that your decisions are based on facts, not assumptions. This data-driven approach is the essence of manufacturing analytics, which turns operational data into a strategic asset for improvement.
The Top 12 Manufacturing KPIs
1. Overall Equipment Effectiveness (OEE)
OEE (Overall Equipment Effectiveness) is a lean manufacturing tool and universal best practice to monitor, evaluate, and improve the effectiveness of a production process. This could be an assembly line, machine cell, packaging line, filling machine, etc.
Monitoring production and OEE allows us to identify and reduce the Six Big Losses in manufacturing. Each of the big losses costs manufacturers money. So, it follows that improvements to OEE will have a positive impact on all cost-related KPIs. As OEE impacts the entire company, it can effectively be used as a financial KPI.
OEE is a central KPI because it directly influences productivity, downtime, cycle time, running costs, and more. Improvements in OEE cascade through many other metrics.
Calculation
OEE = Availability x Performance x Quality
When calculating OEE, each component is measured as a percentage:
Availability % = 100% – Downtime % or Availability % = Run Time / Planned Productive Time x 100%
Performance % = Units Produced / Maximum Possible Units × 100%
Quality % = Right First Time / Total Production x 100%
You can use our OEE calculator to quickly and easily estimate your OEE, or check through our summary and examples of OEE formulas.
OEE Monitoring Solution
Monitor production in real time and obtain a true picture of what's happening on your shop floor. Free for 30 days.
2. Running Cost Per Hour
This KPI tracks the total cost to run a machine or work cell for one hour. It includes wages, utilities, maintenance, and other operational costs.
Running cost per hour helps you understand whether your pricing and production decisions are financially sustainable. Lowering this cost increases profit margins or lets you price more competitively.
Improving OEE often reduces running costs. One example of this is your maintenance cost. Machines that are well-maintained will last longer and perform better. Monitoring OEE gives you visibility into unplanned stops, such as when a machine malfunctions or needs an unscheduled repair. Naturally, one way manufacturers look to improve OEE performance is by eliminating unplanned downtime due to unscheduled maintenance. This, in turn, reduces your running cost per hour.
Learn more: How to Track and Improve Technical Availability?
Calculation
Running Cost = (Labor + Utitilities + Maintanence + Overheads) / Machine Hours Run
Example
If the hourly cost to operate a CNC machine is $100, and you reduce maintenance and energy waste, that cost might drop to $85, saving $15 per production hour.
3. Throughput
The next KPI on our list for you to measure is throughput. It is the number of units that can be produced in a given amount of time, such as 100 units in a day or 5000 liters per minute.
It can be used to describe the performance of an entire plant, a work cell, a production line, or a specific piece of equipment. In the case of a particular piece of equipment, its throughput should be the maximum run rate as specified on the manufacturer’s nameplate.
Throughput is useful in several ways beyond the most straightforward: to run your plant, you need to know how much it is capable of producing at any given time.
Calculation
Throughput = Total Units Produced / Time Period
Example
Assume your plants’ throughput is 100 units per day, and you are operating at 55% OEE. If you improve OEE by 10%, throughput will increase by ten units per day.
The best part is that you increased output without investing in new machines, hiring new people, etc. Instead, you used OEE to understand where to focus to improve productivity and efficiency.
4. Productivity & Efficiency
You have likely heard that it is essential to improve productivity and efficiency. This is true; it is important. But choose one or the other as your preferred manufacturing KPI, because they monitor the same outcome.
Note: Efficiency and productivity are calculated in the same way. All you need to do is divide the output by the input.
Productivity
First, productivity is simply the ratio of output to input. Let’s look at an example.
Let’s say that it takes us 10 hours to manufacture a part today that we can sell for $500 each. What happens to productivity if we improve the process tomorrow, and it saves us 2 hours of production? Since it now takes 8 hours instead of 10, productivity has increased.
Productivity calculation
Productivity yesterday = $500/10h = 50$ per hour of work
Productivity today = $500/8 x 100% = 62.5$ per hour of work
Change in productivity = (62.5-50)/50*100% = +25%
Efficiency
The standard definition of efficiency is the ability to do something without wasting materials, time, or energy. Which is helpful because it allows us to discuss waste. But is it any different from productivity?
Let’s look at another example.
Assume you manufacture bottled water, and each run yields 10,000 cases that sell for $2 each. That means your revenue is $20k. Your labor and material cost is $15,000 per 10,000 case run. This month, you switched to a new supplier of plastic bottles because the quality is better for the same price. The new material doesn’t jam in the machine, so you no longer waste $500 in plastic bottles each run.
Efficiency calculation
Efficiency (old supplier) = $20 000 / $15,000 x 100% = 133%
Efficiency (new supplier) = $20 000 / $14,500 x 100% = 143%
Change in efficiency = (143-133)/133*100% = +7.5%
So, what happens to productivity and efficiency when we improve OEE? They both improve. This is because OEE is a reflection of how well you are managing the Six Big Losses. To improve OEE, you need to have less of one of the losses. In our previous example, there would be less material scrap. Thus, if you reduce scrap, you are more efficient, more productive, and you have improved your OEE.
5. Capacity Utilization
Capacity utilization measures how much of your available production time is currently being used. Looking at it another way, it tells you if you can take on more work. Fixed assets, such as your facility and machines, are expensive resources. This is why manufacturers desire higher rates of utilization. They are seeking to maximize the benefit of these resources, which is why it is a common manufacturing KPI.
In the context of OEE improvement, let’s assume that we work to reduce unplanned downtime. Our OEE score will go up accordingly, but now, the plant has more time available to produce, which is another way of saying that you have more capacity available to utilize. Thus, when we improve OEE by reducing unplanned downtime, we also improve capacity utilization.
Calculation
Capacity Utilization = (Actual Output / Maximum Actual Output) x 100
Example
If your line can produce 1,000 units per day, but you’re only producing 700. That means your capacity utilization is 70%. By improving machine uptime and reducing changeover delays, you increase daily output to 850 units. Now your utilization is 85% — without adding a single new asset.
6. Lead Time
Lead time is the amount of time from receipt of a customer order to delivery. Reducing lead time has two primary benefits.
First, you can respond faster to changes in customer demand. This is because you are able to start the production of different items sooner. Which means you can be more responsive to new orders.
Second, when you can produce an item faster, you are converting inventory into cash faster as well. The less time money is tied up in raw material or work-in-process inventory, the more cost-effective you become.
We have seen that improving OEE will often reduce the number of hours required for production. It is in this context that improvements to OEE lead to improvements in lead time.
Calculation
Lead Time = Order Delivery Date – Order Received Date
Example
Say your current lead time is 14 days from order to delivery. After improving production planning and reducing machine downtime, you’re able to ship consistently in 10 days. That’s a 28% improvement.
7. Energy Ratio
The energy ratio measures how much energy is used to produce a specific quantity of goods — typically kilowatt-hours per unit of output.
Energy costs are a major overhead in manufacturing. This KPI helps you identify inefficiencies and reduce wasteful energy use. Better performance (a component of OEE) shortens cycle time, which lowers energy consumption per unit.
Calculation
Energy Ratio = Energy Consumed (kW/h) / Units Produced
Example
If your plant uses 1,000 kWh to produce 500 units, your energy ratio is 2 kWh/unit. Reducing that to 1.8 kWh/unit saves money and energy.
8. Cycle Time
Cycle time is the total time it takes to produce one unit from start to finish once the production process begins.
Shorter cycle times mean faster output, higher throughput, and better responsiveness. It also makes scheduling and forecasting more reliable.
OEE improvements, especially in performance and reduced downtime, lead to shorter and more consistent cycle times.
Calculation
Cycle Time = Total Production Time / Number of Units Produced
Example
Suppose it takes 3 hours and 20 minutes to produce 100 parts. Your cycle time is 2 minutes per part. By improving tooling and reducing operator delays, you bring that down to 1.8 minutes. That’s a 10% reduction in cycle time.
9. Downtime
Downtime refers to any period when production is stopped. It is divided into two categories: planned or unplanned downtime. It includes maintenance, changeovers, breakdowns, and idle time.
It is a primary source of lost productivity. Tracking it helps you reduce interruptions and improve asset reliability. Unplanned downtime directly lowers the availability component of OEE. Tracking and reducing downtime improve your OEE score.
Calculation
Downtime Rate = Downtime (minutes or hours) / Scheduled Production Time
Example
If a machine is idle for 2 hours in an 8-hour shift, your downtime rate is 25%. After implementing better maintenance planning and reducing wait times, you cut downtime to 1 hour, reducing the rate to 12.5%.
Step-by-step plan to cut downtime by 15%
10. First Pass Yield (FPY)
First Pass Yield measures the percentage of units that are manufactured correctly the first time without any rework or repairs.
High FPY indicates a reliable process and high quality. Low FPY leads to extra labor, wasted material, and delayed deliveries. First Pass Yield is directly tied to the quality component of OEE, as improving FPY improves OEE and reduces waste.
Calculation
FPY = (Good Units Produced / Total Units Produced) x 100
Example
If you produce 1,000 parts, and 950 pass inspection on the first try. That gives you a 95% FPY. After improving operator training and fine-tuning machine calibration, FPY rises to 980 — or 98%.
11. Units per Man-Hour
This KPI measures how many units are produced per labor hour worked. It reflects workforce productivity.
A higher number means your team is producing more with the same labor investment. It’s useful for benchmarking and improving workforce efficiency.
Improved OEE typically results in smoother workflows and fewer delays, which enables workers to produce more in the same amount of time.
Calculation
Units Per Man-Hour = Total Units Produced / Total Labor Hours
Example
If a team produces 600 units in 200 labor hours, that’s three units per man-hour. Improving tools or reducing bottlenecks could raise this to four.
12. Takt Time
Takt time is the amount of time between beginning to produce one unit until you begin to build a new unit. In an ideal system, the takt time of your production process should be equal to and synchronized with customer demand. If it is, then you are only producing precisely what you can sell at exactly the moment your customer will buy it.
When your process runs efficiently (high OEE), you’re more likely to maintain a takt time that matches demand, reducing waste and maximizing flow.
Note: Takt time should not be confused with Cycle time. Cycle time is actual production time, whereas takt time is based on customer demand.
Calculation
Takt Time = Available Production Time / Customer Demand
Example
If you have 480 minutes of production time and customer demand is 120 units, your takt time is 4 minutes per unit.
How to Choose the Right KPIs
Now that you know what KPIs you can track, it’s time to choose the correct metrics for you to measure in your operation.

Most manufacturing KPIs are ultimately tied to cost — whether it’s reducing waste, downtime, or resource use. When in doubt, ask: “How does this metric help us operate more efficiently?”
- Align with Strategic Goals
Start by defining what success looks like for your business. Are you trying to reduce costs, increase capacity, improve quality, or all of the above? - Focus on Critical Areas
Identify bottlenecks, quality issues, or resource inefficiencies that are limiting performance. - Ensure Accurate Data
Only track metrics that you can measure consistently and accurately. Unreliable or incomplete data leads to misleading conclusions. - Prioritize Actionable Metrics
Choose KPIs that lead to decisions. A good KPI should highlight a problem and suggest a clear next step.
Implementing OEE Improves All Manufacturing KPIs
In this article, we’ve reviewed the key manufacturing KPIs, what they measure, and how to choose the right metrics for your operation. We also explored how improving OEE can positively impact each KPI with several examples.
As a KPI in its own right, implementing OEE and tracking it accurately will improve overall efficiency, helping you achieve other key KPIs. OEE improvement reduces machine downtime and scrap, and influences investment decisions by highlighting areas of downtime.
The most effective way to track OEE is with real-time OEE software, providing you with accurate data from across your facility.
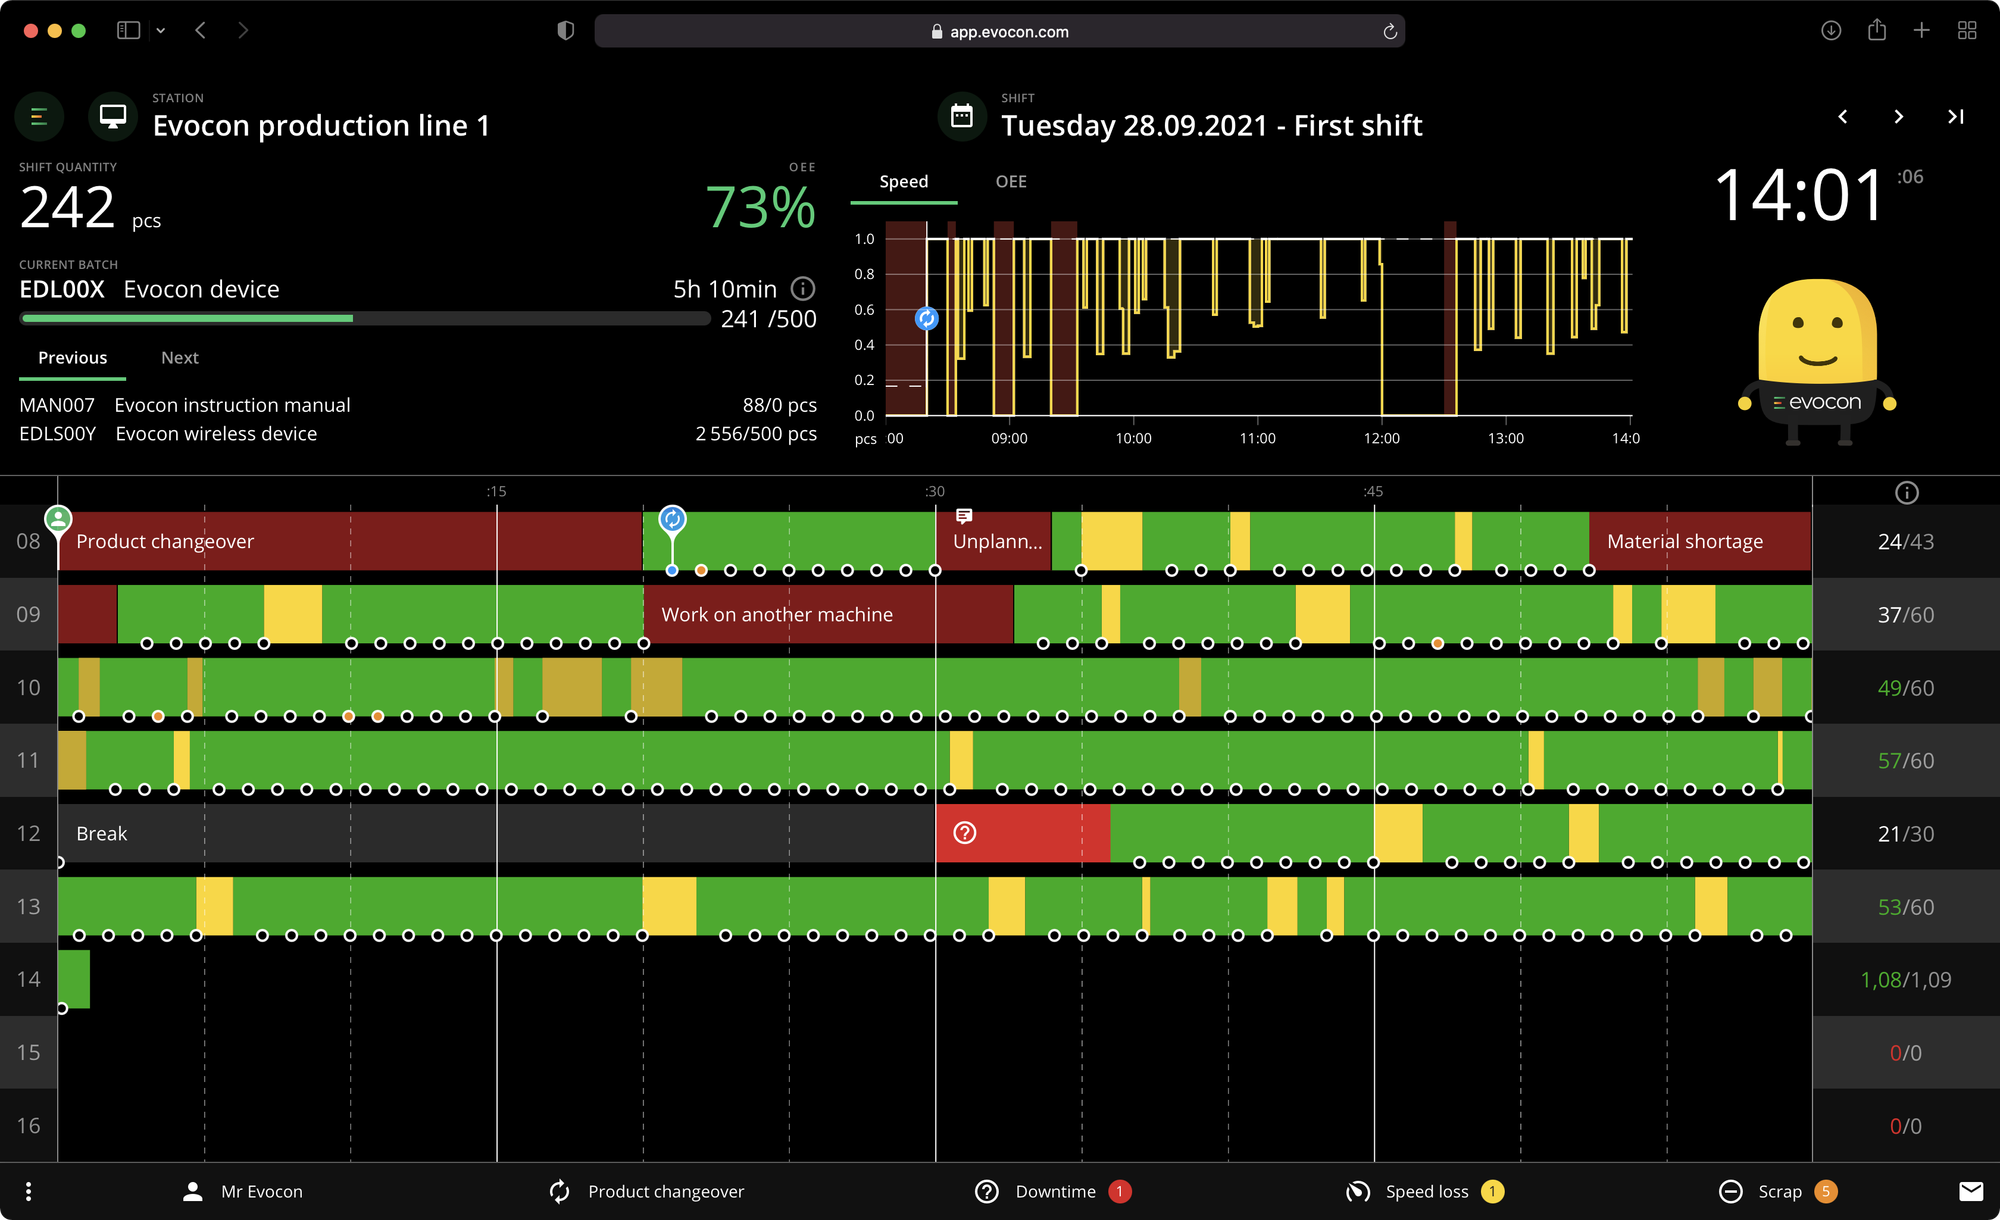
With the Evocon Shift View, you can track production in real time, seeing downtime, speed loss, scrap, and OEE throughout each shift.
The Evocon Dashboard lets you view OEE alongside other KPIs on your desktop, shop floor, or mobile device. Having all your metrics in one place and accessible anywhere helps you stay on top of your performance.
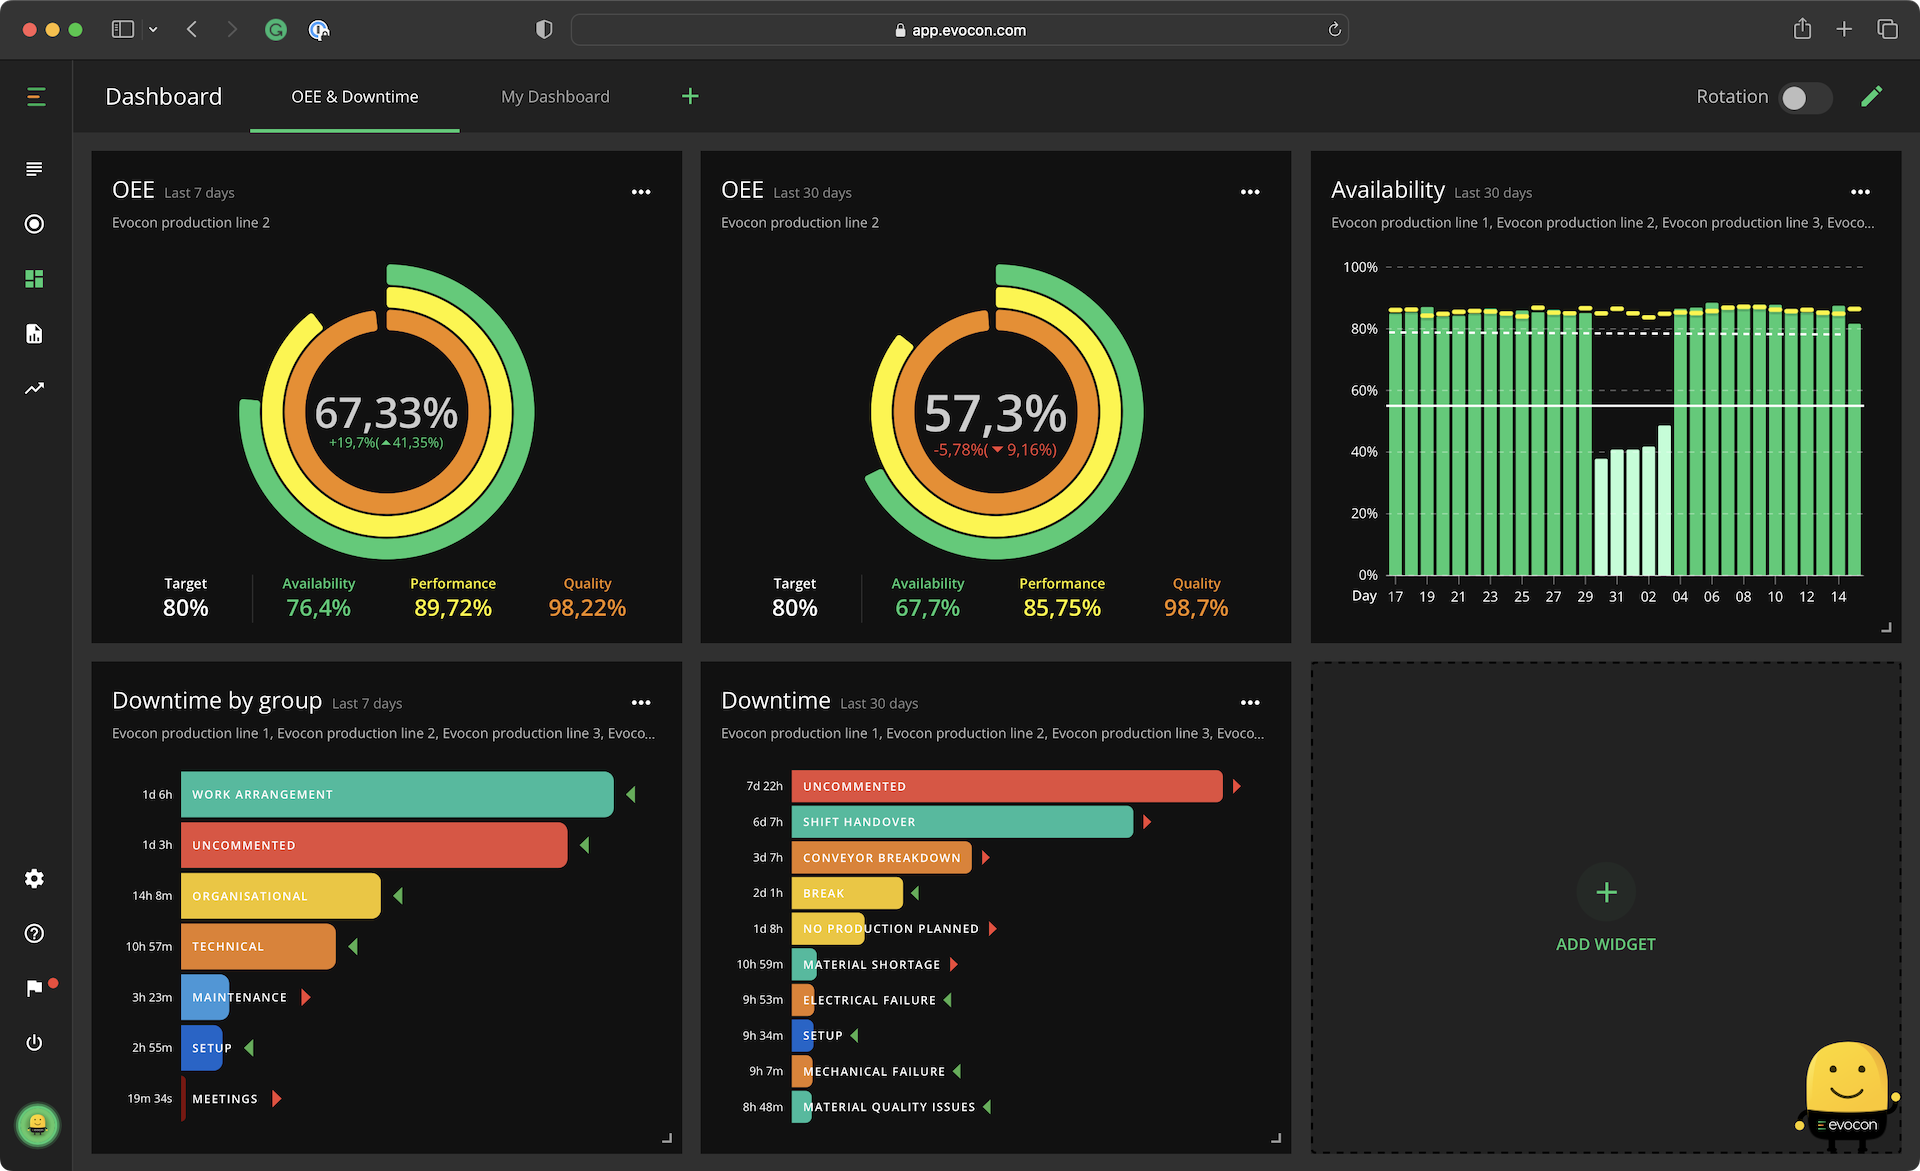
This unified view allows you to easily track performance metrics in real time, ensuring you can make informed decisions quickly and stay on top of your production goals.
Beyond real-time dashboards, Evocon Reports also provide a comprehensive view of how your production is running. This gives you the clarity you need to take action, reach goals, and improve efficiency.
Key Takeaways
Manufacturing KPIs are critical for improving operational performance, reducing costs, and making informed decisions.
While every operation is unique, tracking metrics like Overall Equipment Effectiveness (OEE), throughput, lead time, and FPY gives manufacturers a competitive edge.
Nearly every KPI relates to some aspect of cost control or efficiency improvement, and most are closely connected to OEE.
The goal isn’t to track every KPI, but to focus on the few that have the biggest impact on your strategic objectives.
Using these KPIs as a guide, you can uncover opportunities to boost productivity, improve quality, and optimize your resources.