Enterprise Package
  Integrations
  Security
  Hardware
 How Evocon Works
  OEE Monitoring
  Increasing Productivity
 OEE Calculator
  Evocon
  Join us
 The Six Big Losses framework is a practical way to categorize equipment-related losses in manufacturing. It is a part of Total Productive Maintenance (TPM) methodology and is aligned with OEE. In this article, we explain each category and provide examples of common issues.
If you are looking for a summary/reference, go to the Overview chapter at the end of the article.
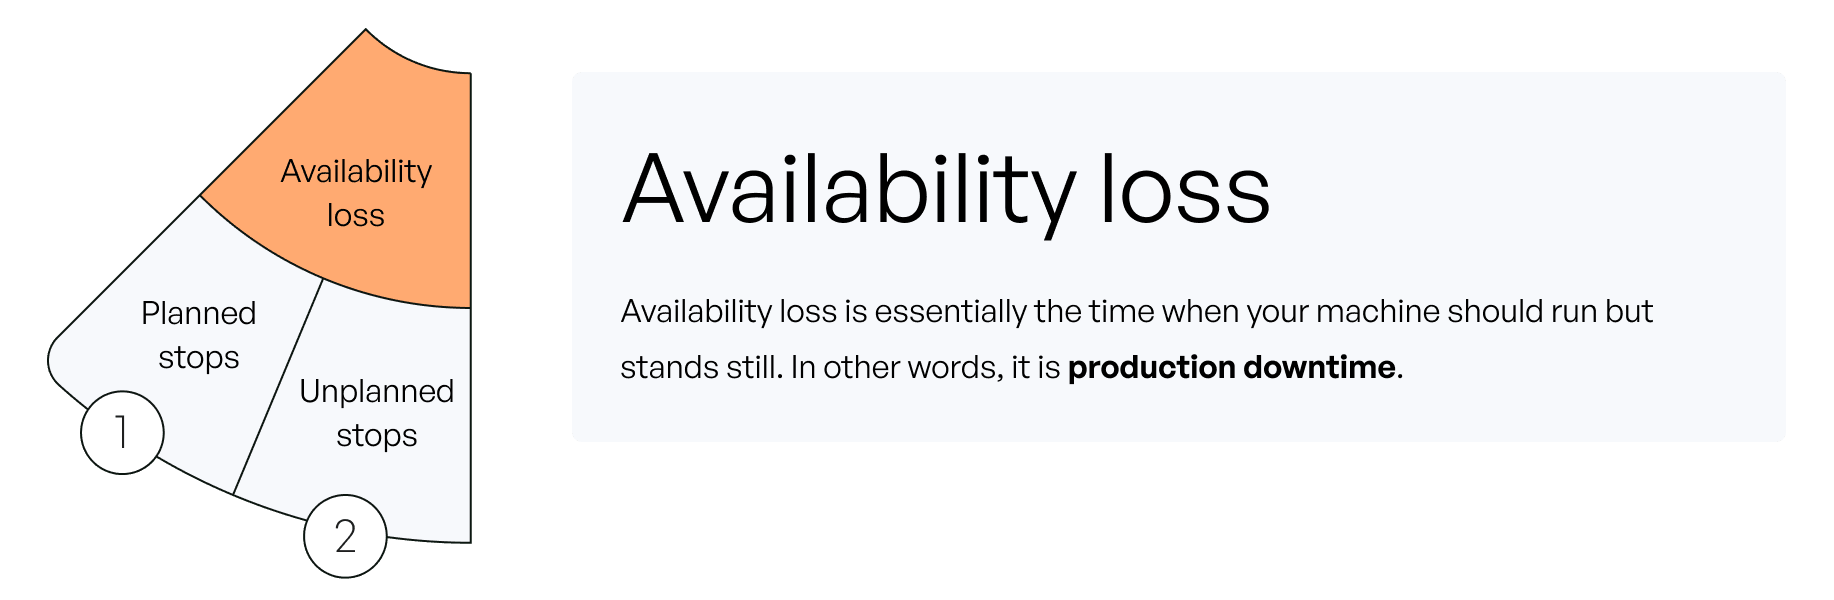
Availability Loss in Manufacturing
What is availability? It is the proportion of planned running time which is available for production.
Read more about availability and how to calculate it.
What is availability loss? It is the time when your machine should run but stands still. In other words, it is production downtime.
Downtime is critical, obvious, and usually the first loss that manufacturers address. It also has the largest number of possible reasons and therefore deserves the longest chapter.
Downtime can be “planned” or “unplanned”. We’ll now take a closer look at each of these.
1. Availability loss due to planned stops
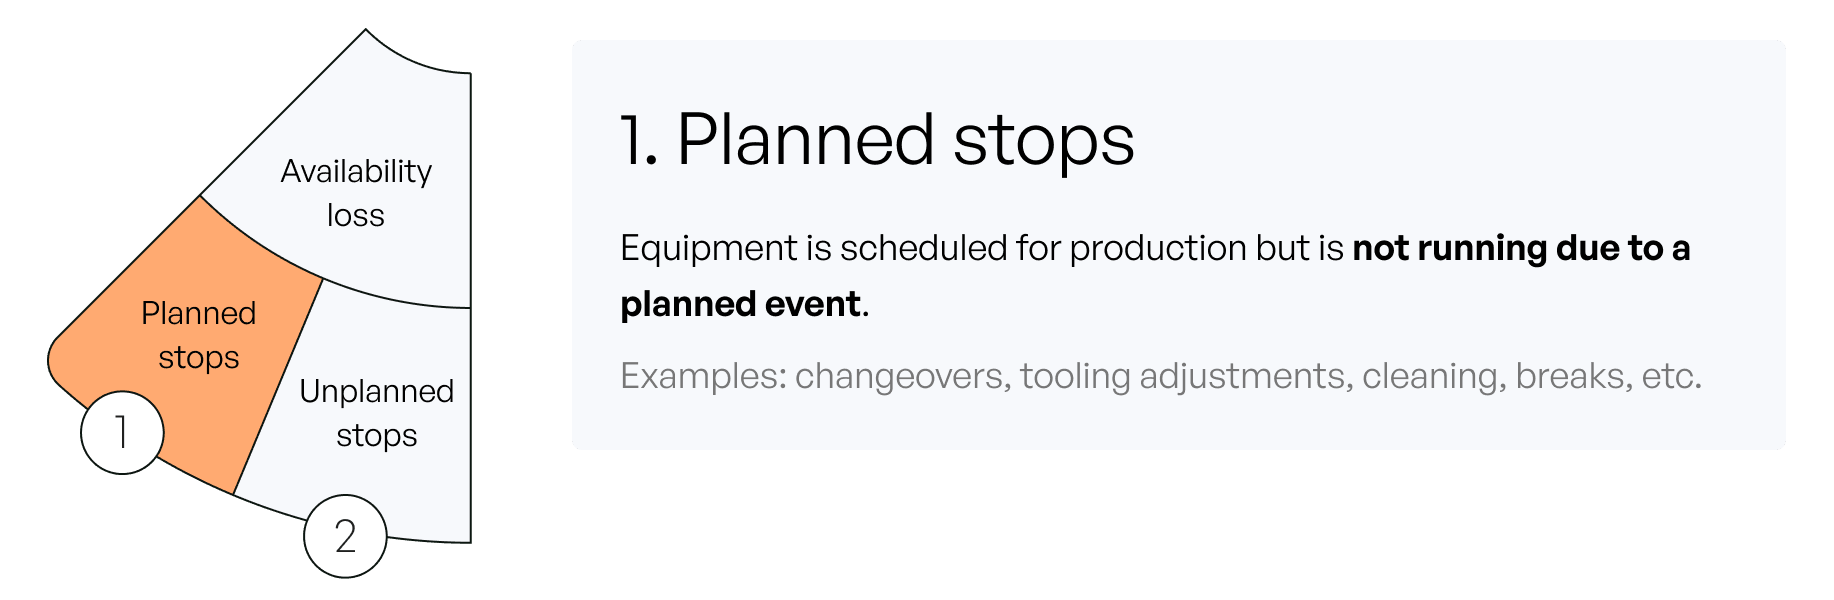
Even though this type of downtime is “planned”, it still counts as a production loss because it is something that you can work on. Very often in our practice, we see manufacturers omit planned stops from the calculation of OEE. This should not be the case because you can still reduce the duration of planned stops.
The 4 categories of planned downtime are:
- Losses during start-up, changeover, and shut-down
- Systemic losses
- Losses due to planning and optimization
- Downtime due to quality losses
1. Losses during start-up, changeover, and shut-down
- Start-up is the period at the start of a working shift, where the plant is being made ready to run. This might include pre-start safety checks and restocking consumables.
- Changeover is the time spent switching your plant between different products and packaging.
- Shut-down is the time spent at the end of working shift making your plant safe to stop and leaving it in an acceptable condition.
2. Systemic losses
Systemic downtime is the period of “no output” which we create as a business. These are:
- Toolbox talks, meetings, training
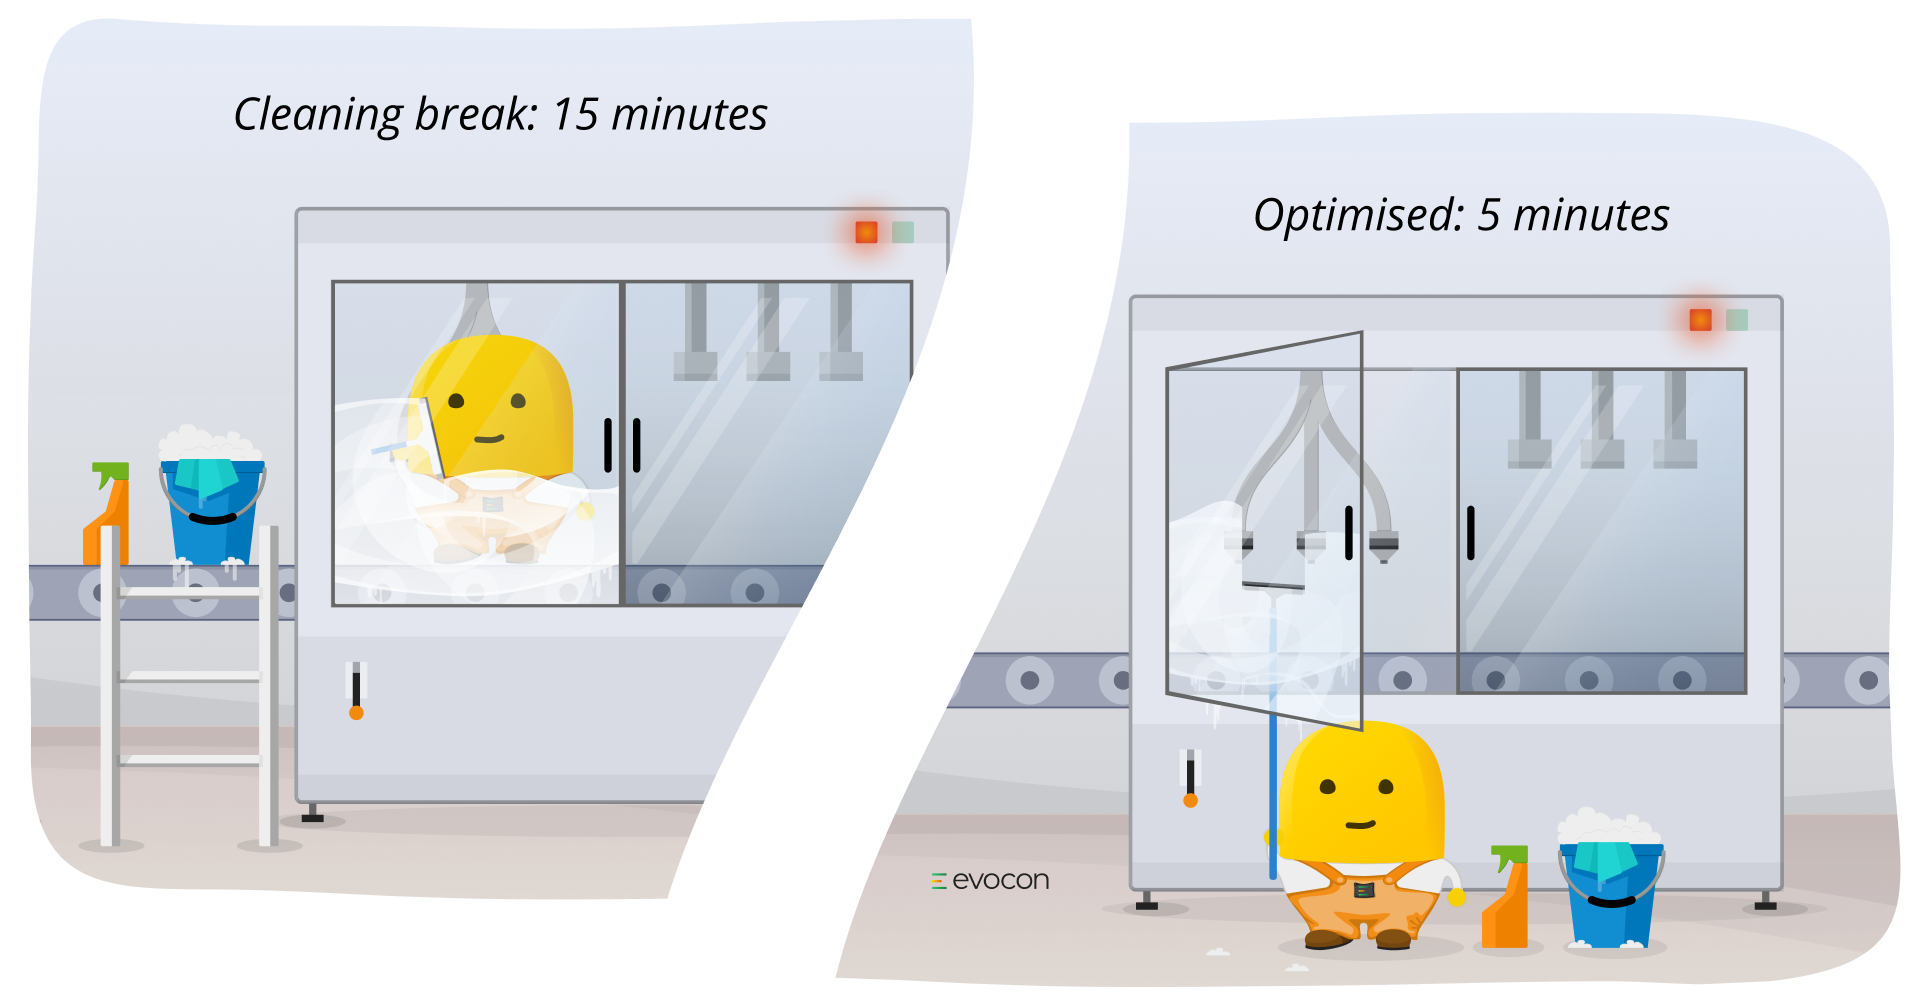
- Scheduled cleaning
- Planned maintenance
- Paid rest breaks
These periods of downtime are not necessarily negative, however, we must collect the data to fully understand our performance and identify ways to ensure these periods are effectively time-managed.
3. Losses due to planning and optimization
Downtime related to sub-optimal logistics, production planning, or workforce planning.
Examples of these include:
- Waiting for raw material or bulk feed-stock supply
- Waiting for packaging
- Staff shortage: absenteeism/lateness, incorrect crew size, temporary labor supply
- Finished product accumulation/backlog
- Canceled orders
- Late vehicles (either delivering or loading)
4. Downtime due to quality losses
When products have to be discarded due to defects or reworked, the loss is not only that of quality and material, but also wasted production time.
Quality related losses can affect productivity and downtime in 3 ways:
- Periods of downtime as a result of plant stoppages to investigate or fix quality issues.
- Slow running to compensate for variation – i.e. where the materials in use deviate from their standard specification and/or tolerances.
- Time spent reworking (or disposing of) production that is not “Right First Time”.
Quality losses that result in downtime may be caused by packaging quality, raw material or bulk feed-stock quality, finished product quality, or no demand (without due notice of at least 24 hours).
How to reduce downtime occurring due to planned stops?
First of all, you need to track and prioritize your planned stops. While not all of them are avoidable or even negative, often it is possible to reduce the duration of these stops. Many of them are very common, and various methods are available to help battle them.
For product changeovers, the most popular approach is the Single Minute Exchange of Dies program (SMED), which borrows its name from Toyota’s attempts to optimize the change of dies on large transfer-stamping machines that produce vehicle body parts.
For planned maintenance, the goal is to organize maintenance activities to happen at the right time and at the right frequency. Predictive maintenance uses production monitoring data to determine these times and frequencies.
Furthermore, you could consider allocating one time window for different planned stops (for example, cleaning and maintenance).
Learn more: Step-by-step guide to reduce downtime by 15% in 6 months or watch a video on How to Track and Analyze Machine Downtime
2. Availability loss due to unplanned stops
Unplanned production downtime results from machine breakdown so often that many sources name this category simply “Breakdowns” or “Equipment failure”.
Equipment failure
Downtime as a result of equipment failure or breakdown is an unplanned stop, however, an unplanned equipment failure could lead to the subsequent need to schedule a planned maintenance event at a later date.
You should define equipment-related losses in such a way that provides sufficient information on what exactly failed. For example, rather than logging downtime as “production line”, we should be able to record which part of the production line experienced failure. Or, in the case of a single production machine or CNC machine, it is useful to know which part of the machine caused the failure.
Example: Bagging line
Let’s look at an example of categorizing equipment failure related losses on a bagging line. Your own production process might be different, but you can use the same logic. There could be three areas of equipment loss on a bagging line:
- Bagging/filling
- Upstream equipment
- Downstream equipment
Bagging/Filling
Examples may include: Weighing system/load cell, bag feed system, filler, stitching/sewing machine, bag sealing, labeling, bag printing.
Upstream equipment
This is the equipment that is supplying the bagging line with products. Examples: blender, weighing system/load cell, feed hopper, conveyor section, screen, elevator, payloader, bulk intake system.
Downstream equipment
This is the equipment that is post bagging line. Examples: outfeed conveyor, palletizer, pallet wrapper/stretch holder, conveyor section, pallet labeler, fork-lift.
Inoperability
Inoperability is downtime as a result of factors beyond operational or commercial control, such as adverse weather, natural disaster, power outage, load shedding, industrial action (external), civil action.
How to reduce downtime occurring due to unplanned stops?
Eliminating unplanned downtime is critical to improving OEE. You cannot address other OEE components if your machines are not running.
For unplanned downtime, it is crucial to record the specific reasons for each stop that occurs. Usually, operators do this. More on this topic in our article How to define machine breakdown causes.
With downtime categorized, the next step is to prioritize the list of downtime reasons and solve them one by one starting from the top. The most common approach for this is Root Cause Analysis (RCA).
Do you know if your machines are running at full potential?
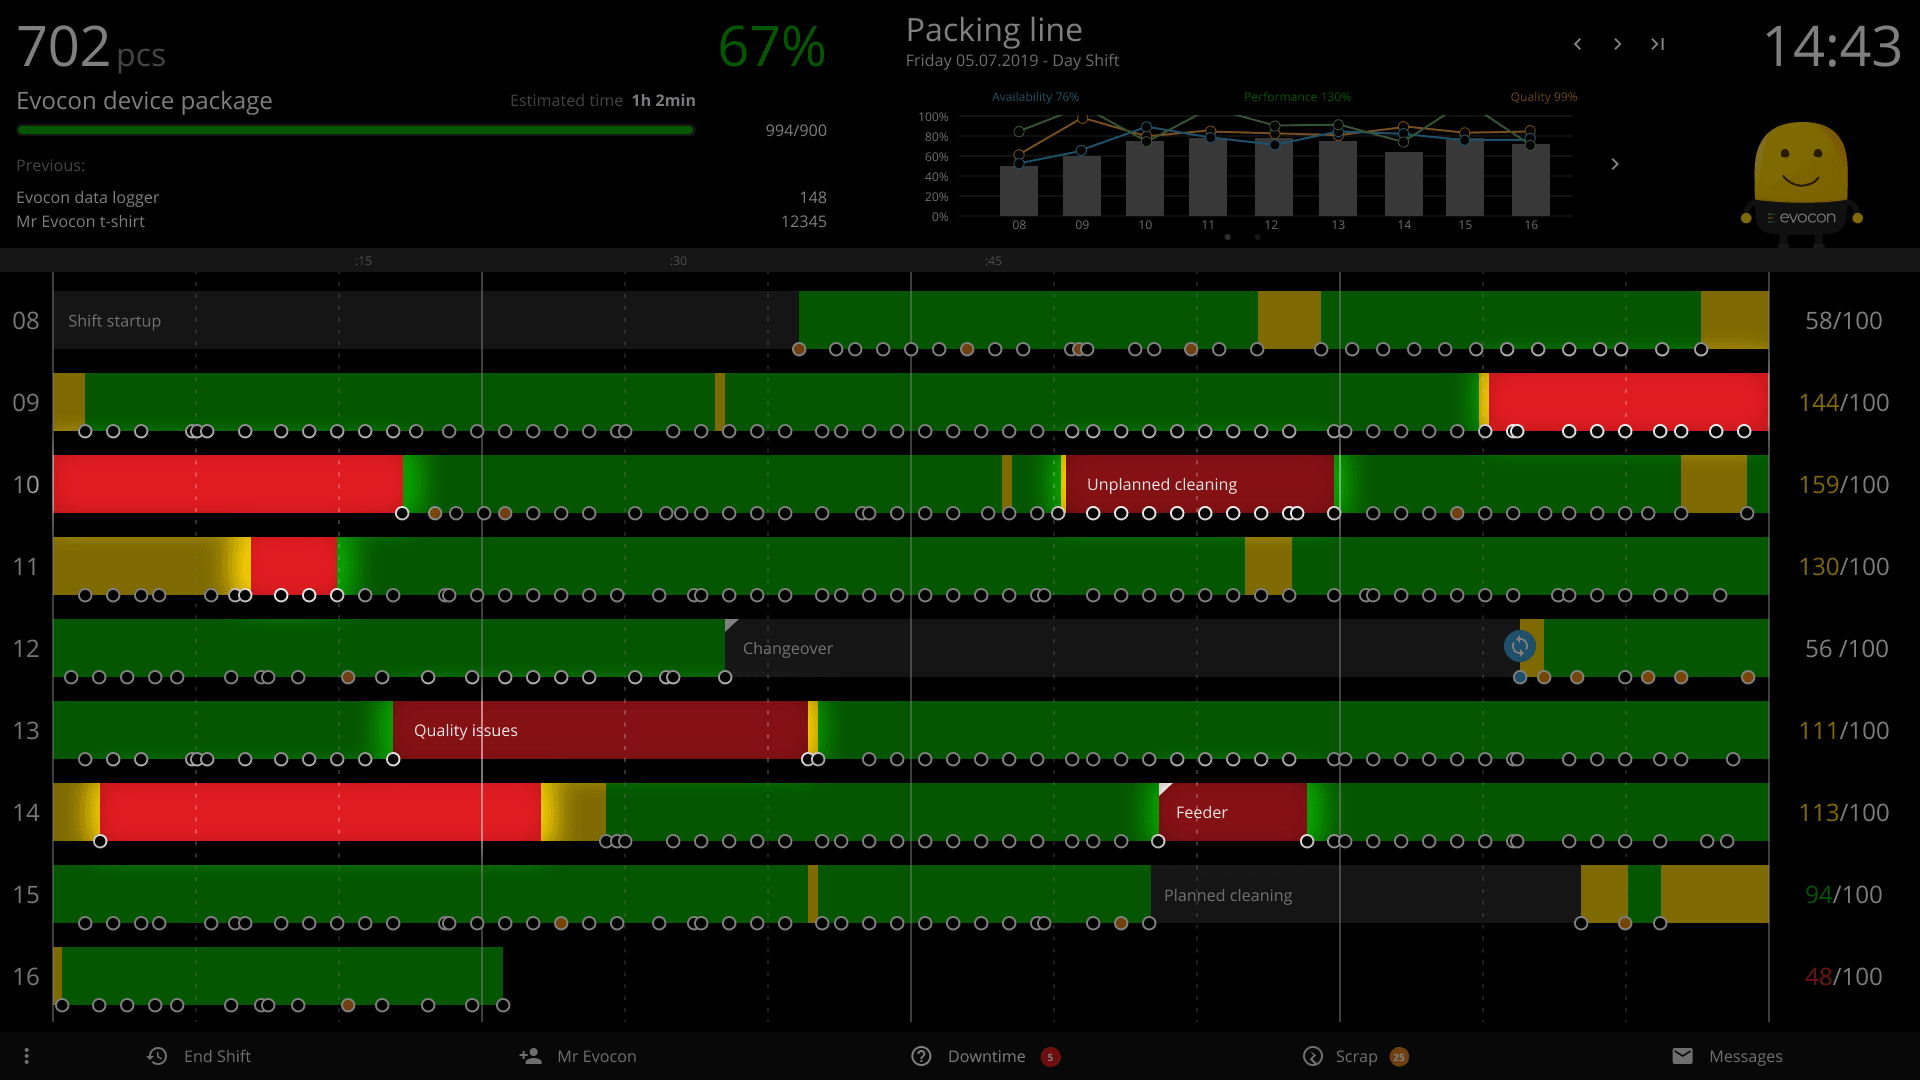
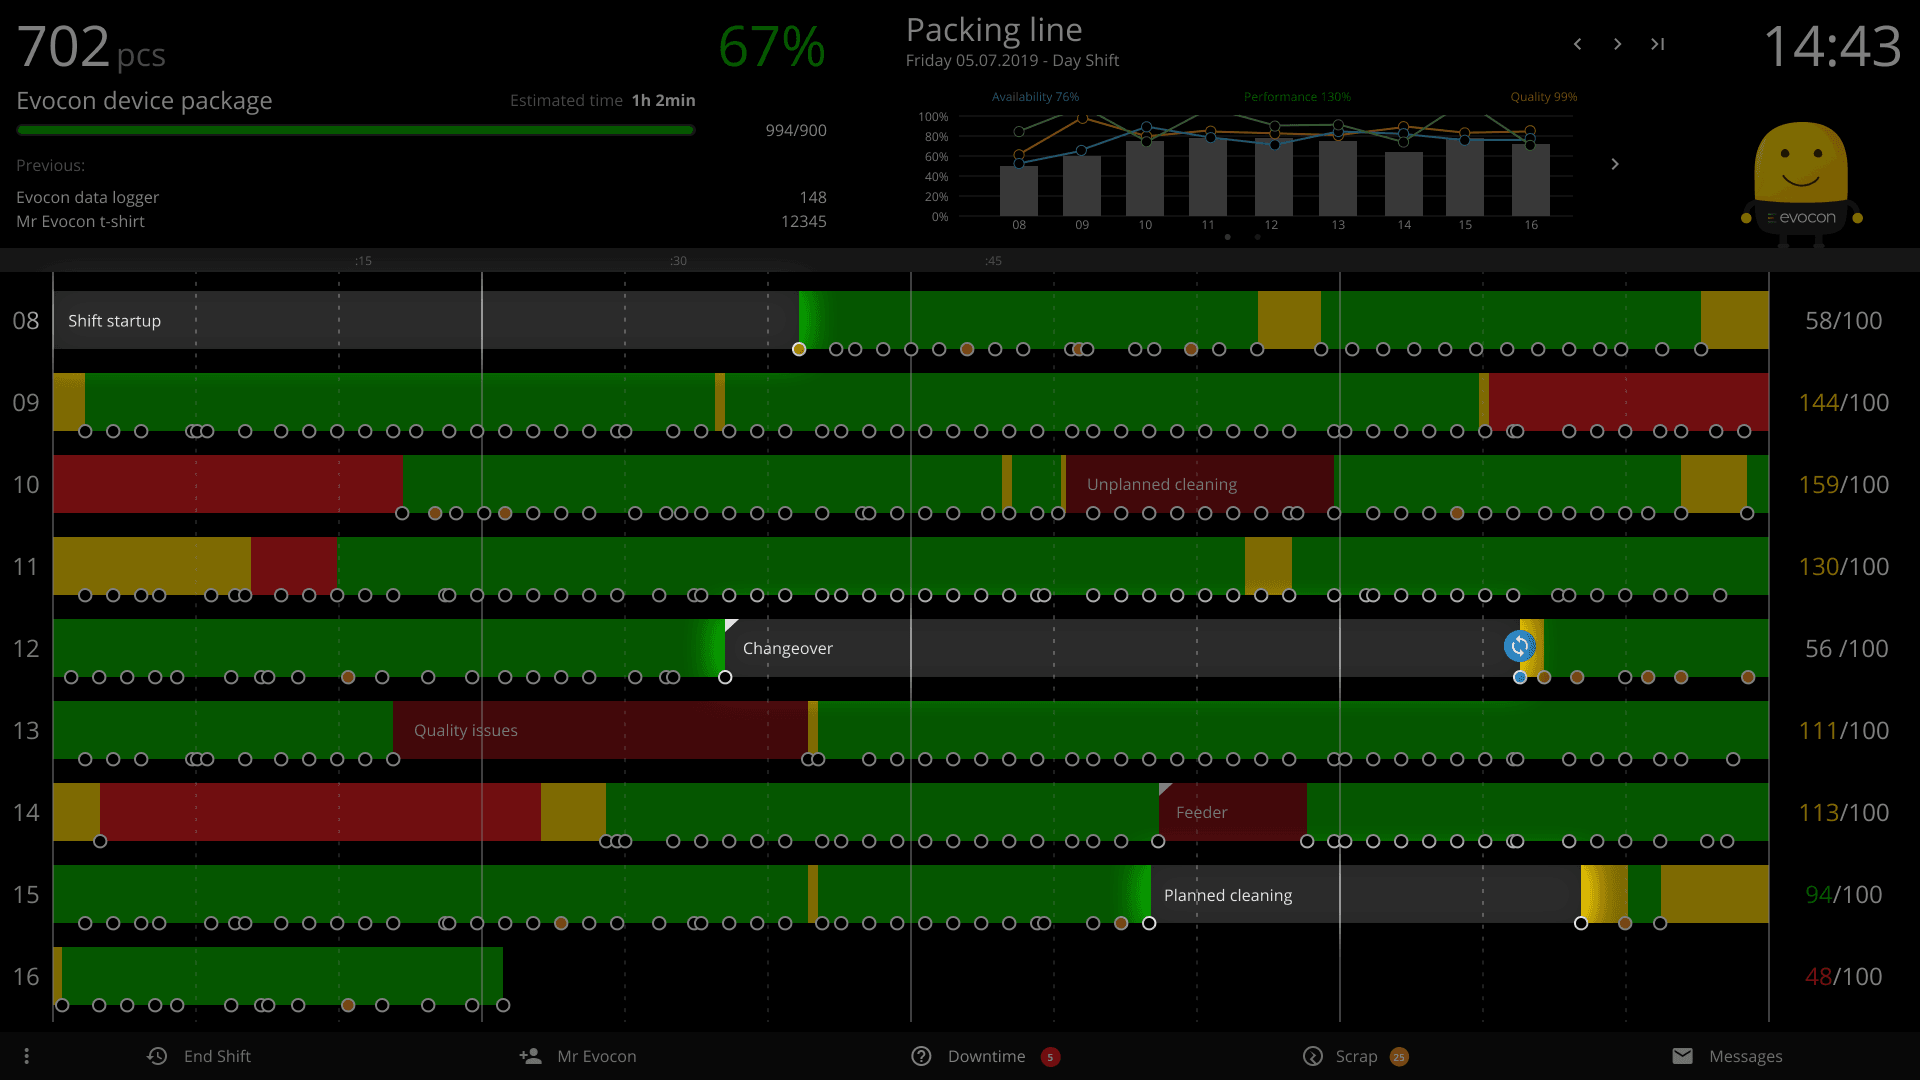
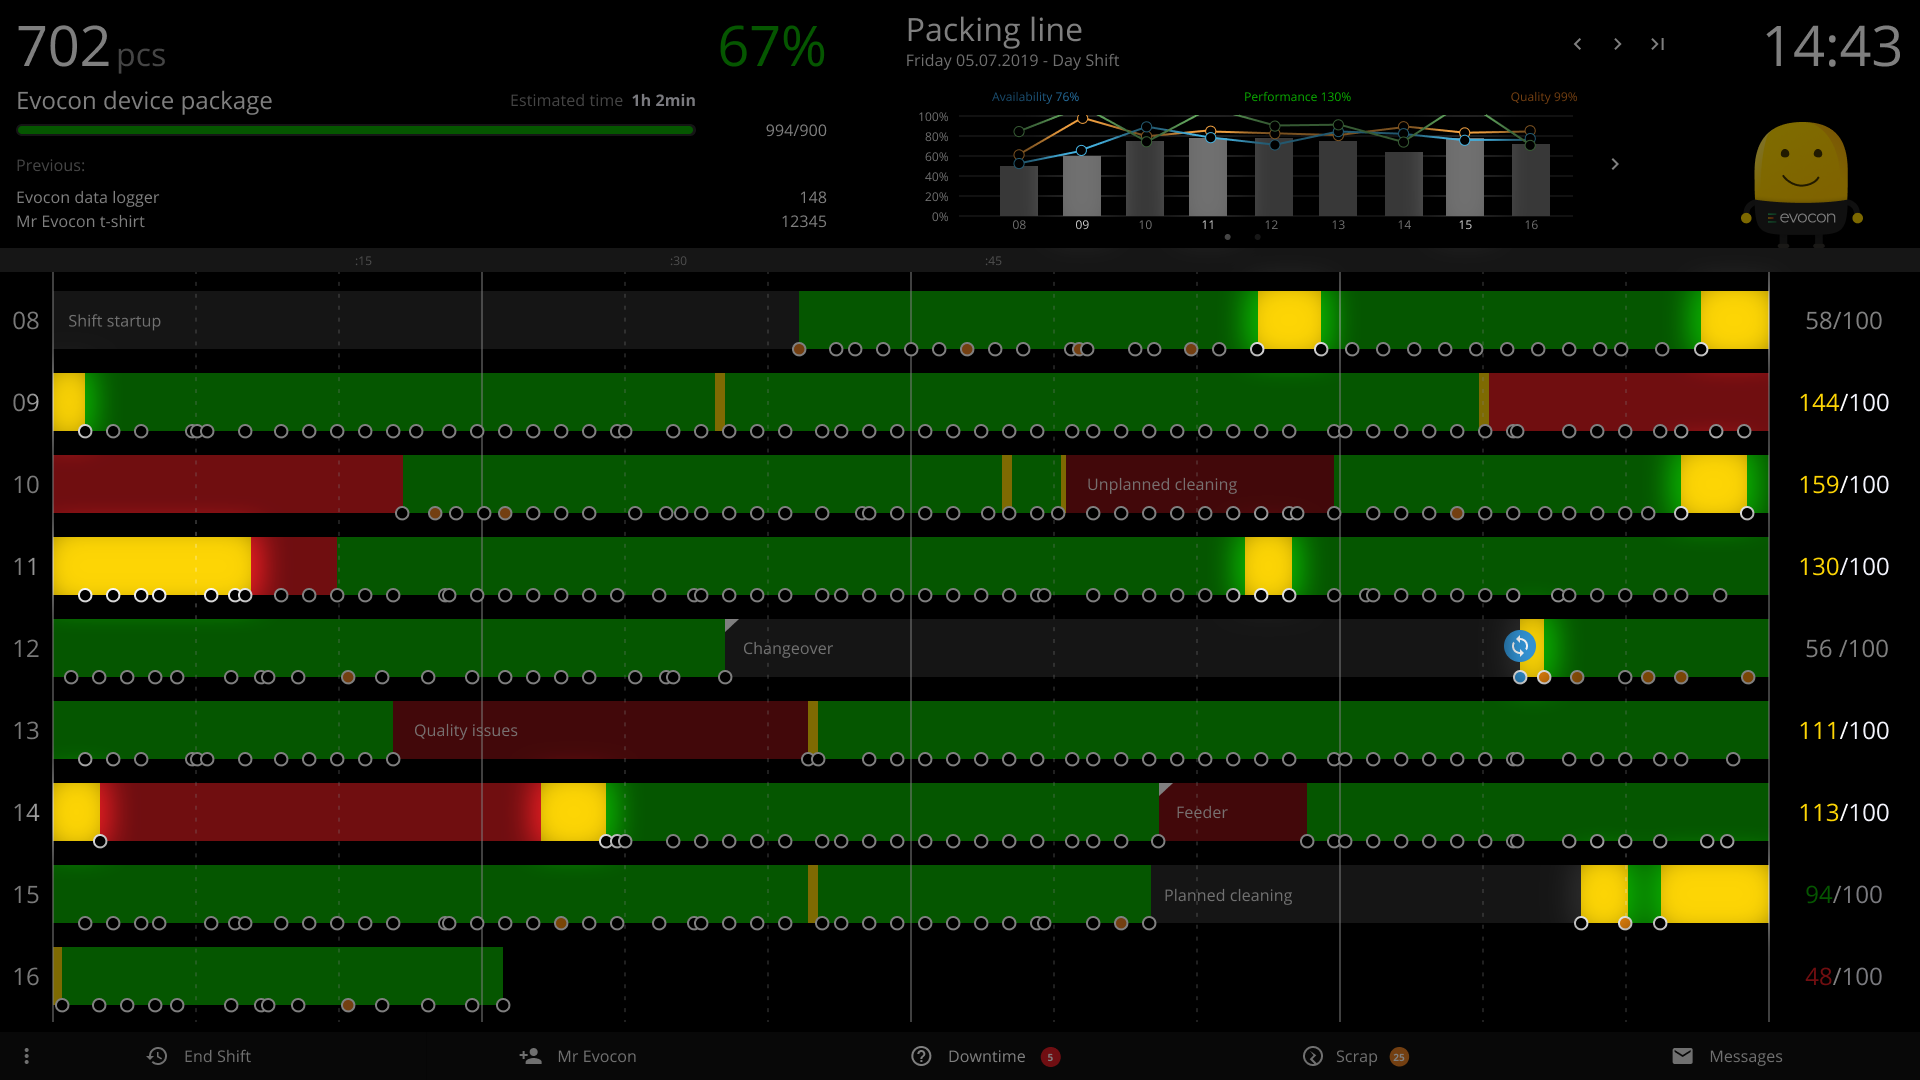
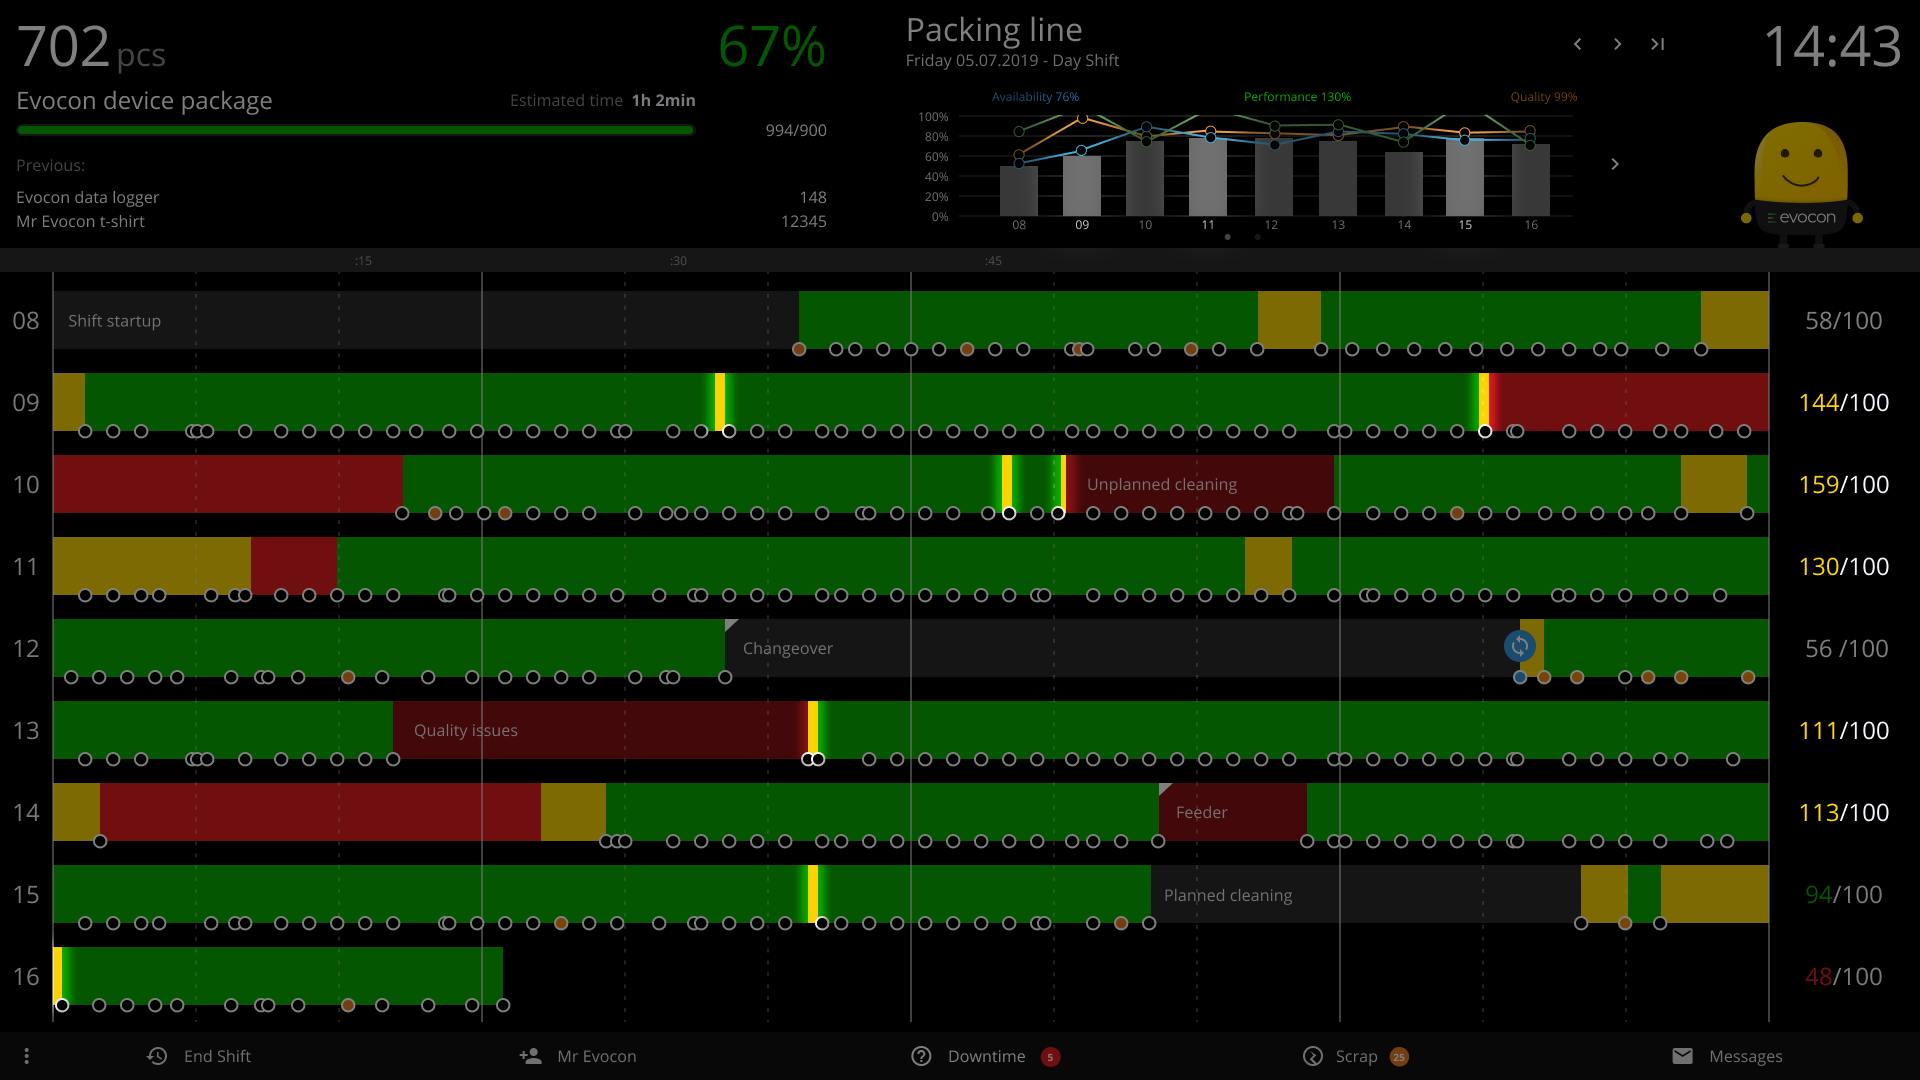
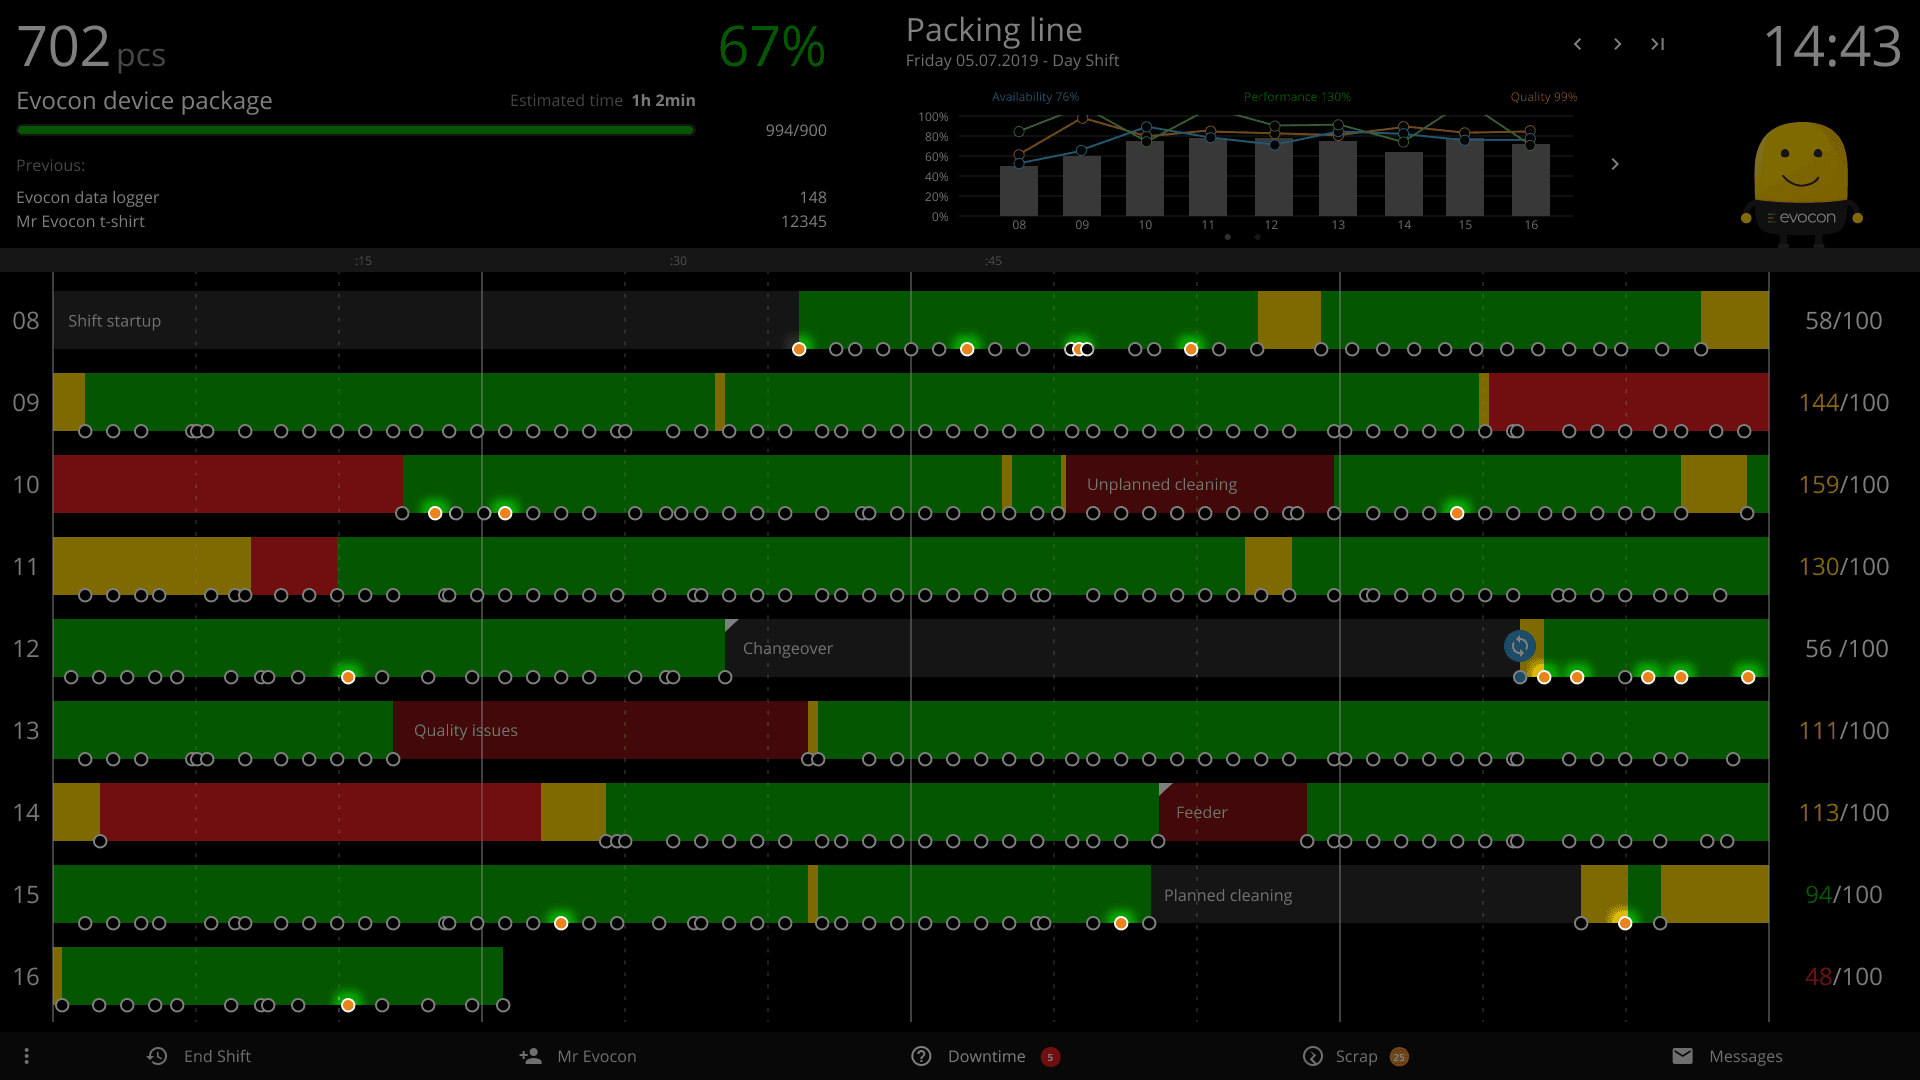
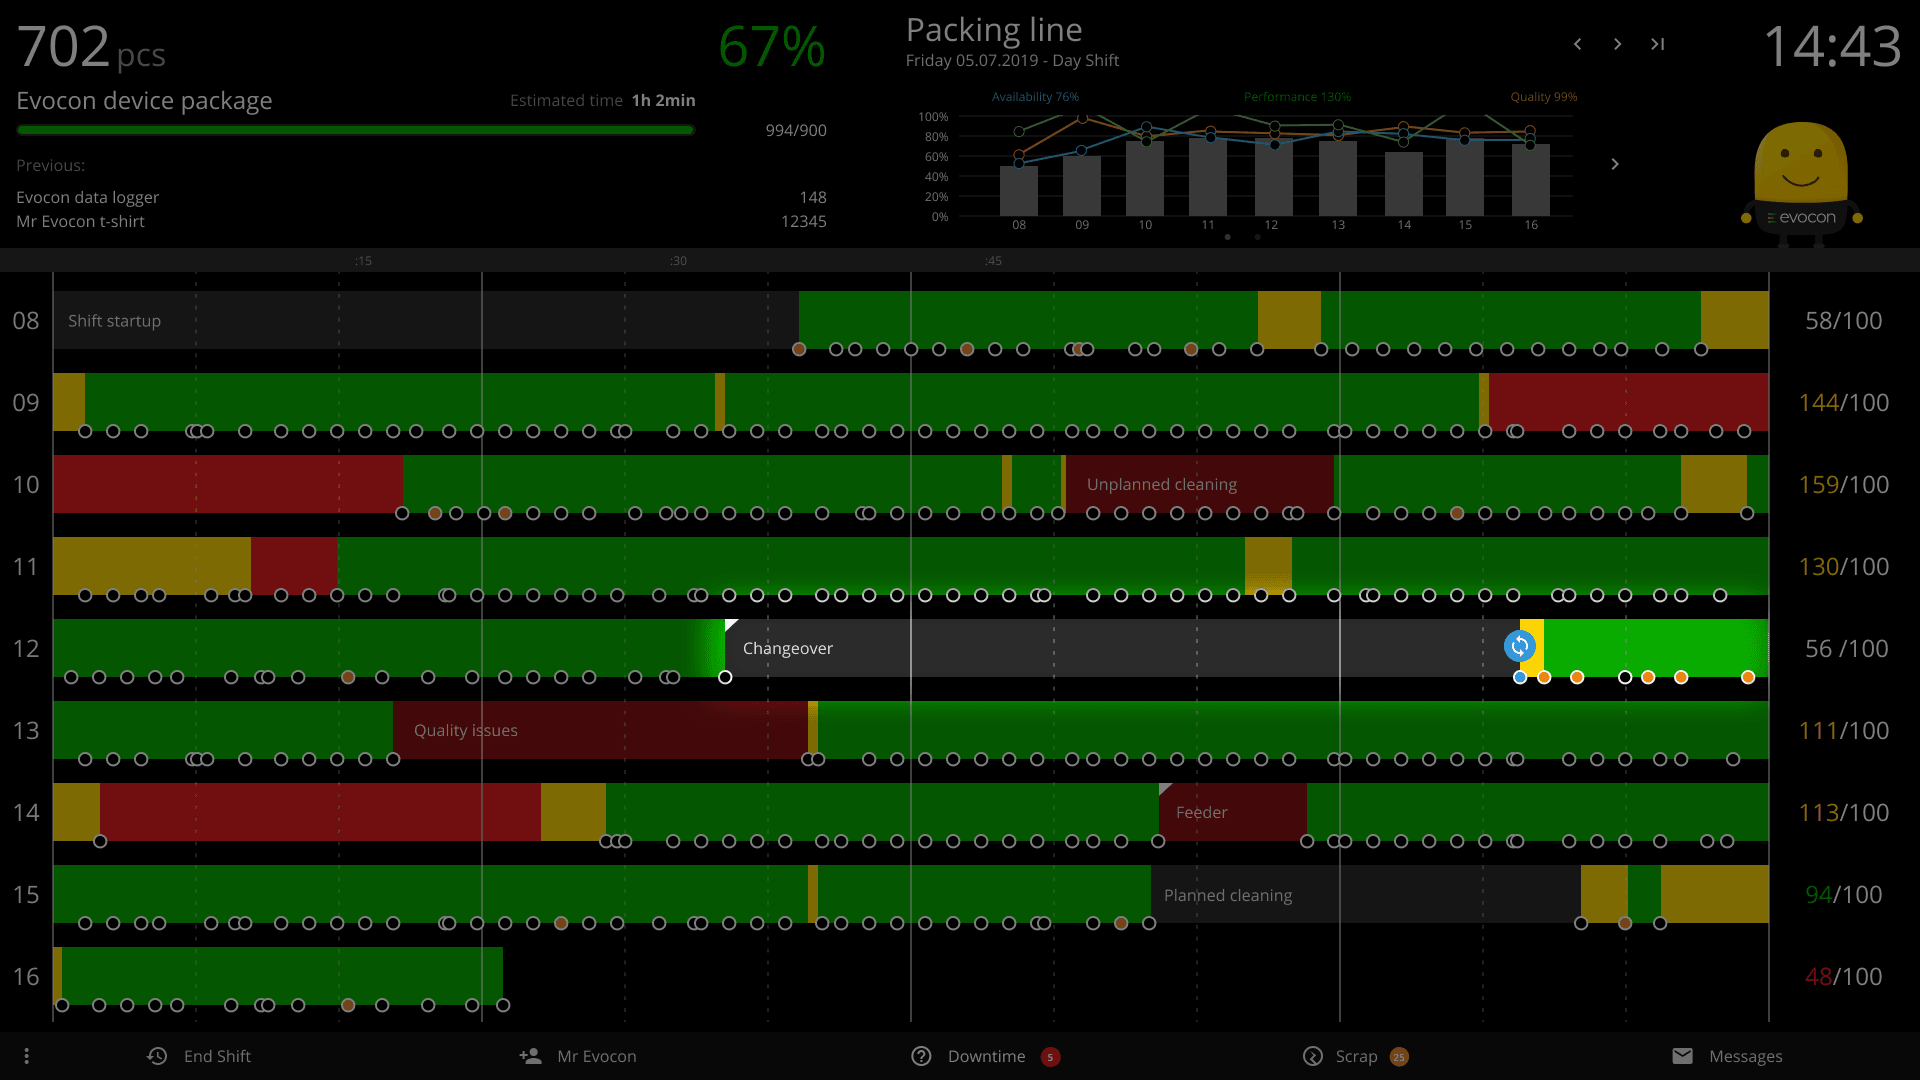
How Evocon visualizes availability losses?
For any of our readers that use our downtime tracking system, it is important to note that Evocon handles availability losses differently from the Six Big Losses framework that we present in this article:
- Both planned and unplanned availability losses fall into the category of “unplanned stops” in the Evocon system. The system takes “unplanned stops” into account when calculating OEE.
- Time not scheduled for production (which is not one of Six Big Losses) is categorized as “planned stops” in the Evocon system. “Planned stops” do not influence OEE in the Evocon system.
The Evocon system gives freedom to choose which stops are “unplanned” (and included in OEE calculation) and which ones are “planned” (and thus excluded from the calculation).
There are three main reasons for this:
- The main reason is to make it easier for manufacturers to get started with the OEE monitoring process. Because the Six Big Losses framework can be difficult to get used to when you start to monitor production machines.
- The second reason is to make sure that Evocon can be integrated into the local shop-floor culture and support a gradual change towards correct OEE monitoring.
- And thirdly, in different cultures, users may categorize the same stop differently. For example, they could mark rest breaks or toolbox meetings either as “planned” or “unplanned stops”.
Performance Loss in Manufacturing
What is performance? It is the actual throughput during the time of running, compared to the maximum possible throughput. Read more about performance and how to calculate it.
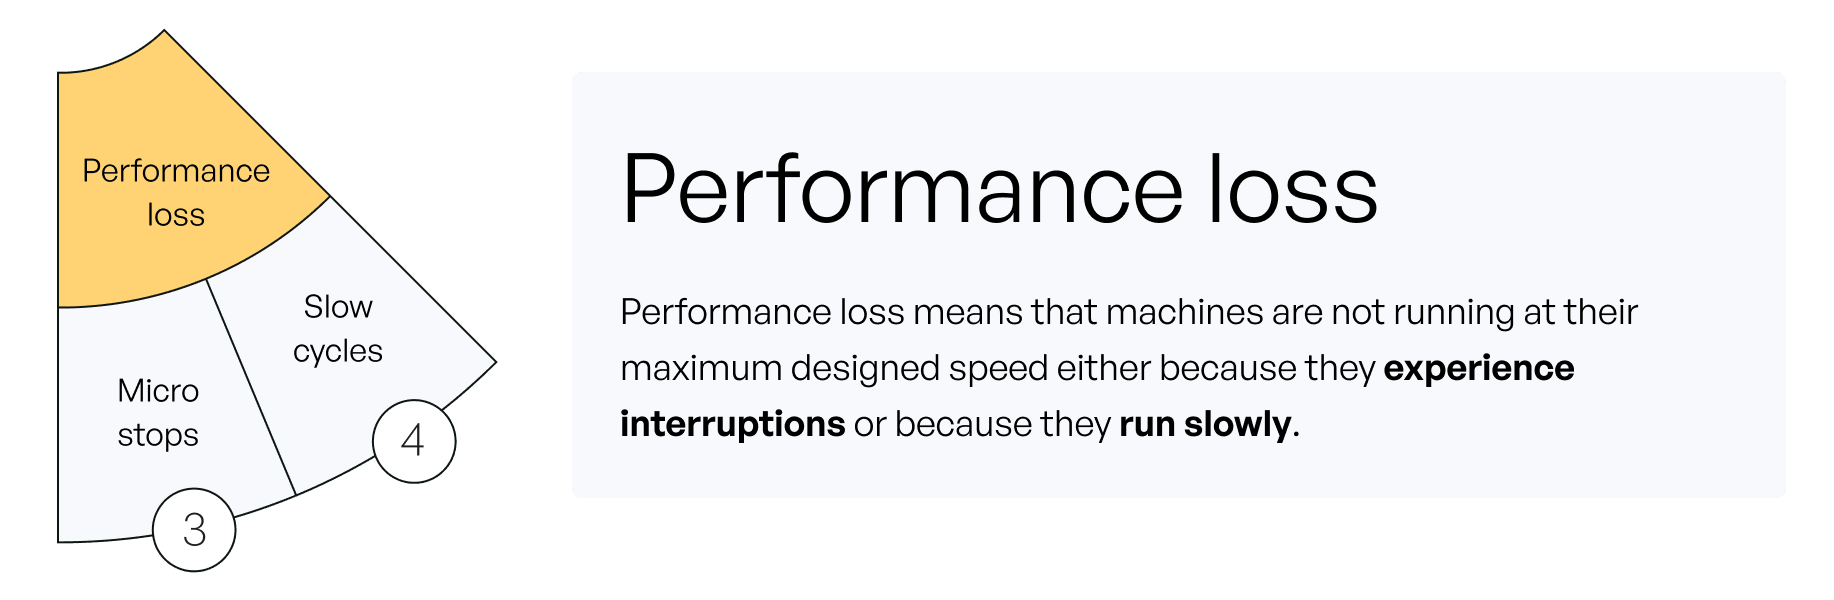
What is performance loss? It is time lost because machines are not running at their maximum designed speed. Performance losses occur either because of short and frequent interruptions (micro stops) or because machines run slowly.
Even though in the case of interruptions machines are actually stopping, those stoppages are not classified as downtime, because their causes are usually different.
Performance losses are often overlooked by management, silently and continuously eroding efficiencies while being accepted as a norm.
3. Performance loss due to micro stops
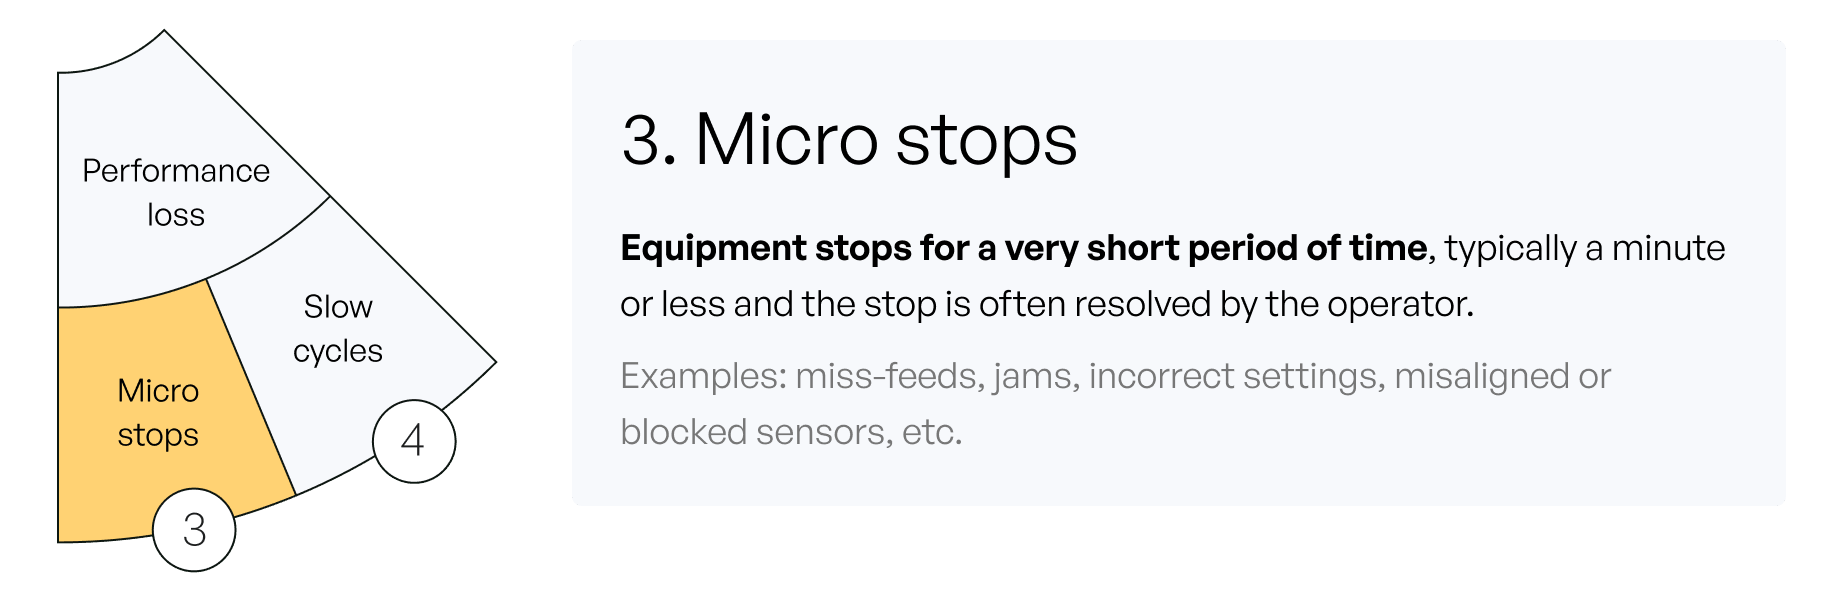
Just like in the case of production downtime (availability loss), micro stops mean that the machine has stopped, but micro stops are short and frequent (maximum of a few minutes), therefore they are part of a cycle, and not a downtime event. To solve micro stops, one needs to examine cycles.
Production losses caused by micro stops (also called minor stoppages, micro-downtime, idling) are often underestimated because they are short and difficult to measure.
Also, due to their repetitiveness, operators often become blind to their impact. Our experience shows micro stops to be one of those “surprise” findings after collecting and analyzing production data.
On the upside, micro stops are usually caused by process shortcomings rather than by equipment breakdown. It means that they are a worthwhile target if you want to improve OEE.
Typical causes of micro stops
- Equipment misalignment, poor positioning
- Incorrect settings
- Blocked sensors
- Material miss-feeds and jams
- Equipment design issues
- Periodic quick cleaning
How to reduce performance losses occurring due to micro stops?
The good news is that micro stops are predictable, which means that they can be either prevented entirely or at least prepared for.
The difficulty is measuring these stops. Unlike production downtime, micro stops cannot be recorded manually, so an automated production monitoring system is a must. A useful production monitoring tool not only measures these stops but also differentiates micro stops from downtime and visualizes the data in a way that allows you to see the pattern of stoppages.
As we mentioned before, micro stops are part of a production cycle. Therefore you need to analyze cycles to get to the root cause of the problem. A great method to apply here is Root Cause Analysis (RCA).
In many cases, the root cause is related to the process and needs a change in working practice, so make sure to involve operators early on.
Automated Production Monitoring Software
Automatically track and visualize micro-stops to minimize performance losses. Free for 30 days.
How Evocon visualizes micro stops?
4. Performance loss due to slow cycles
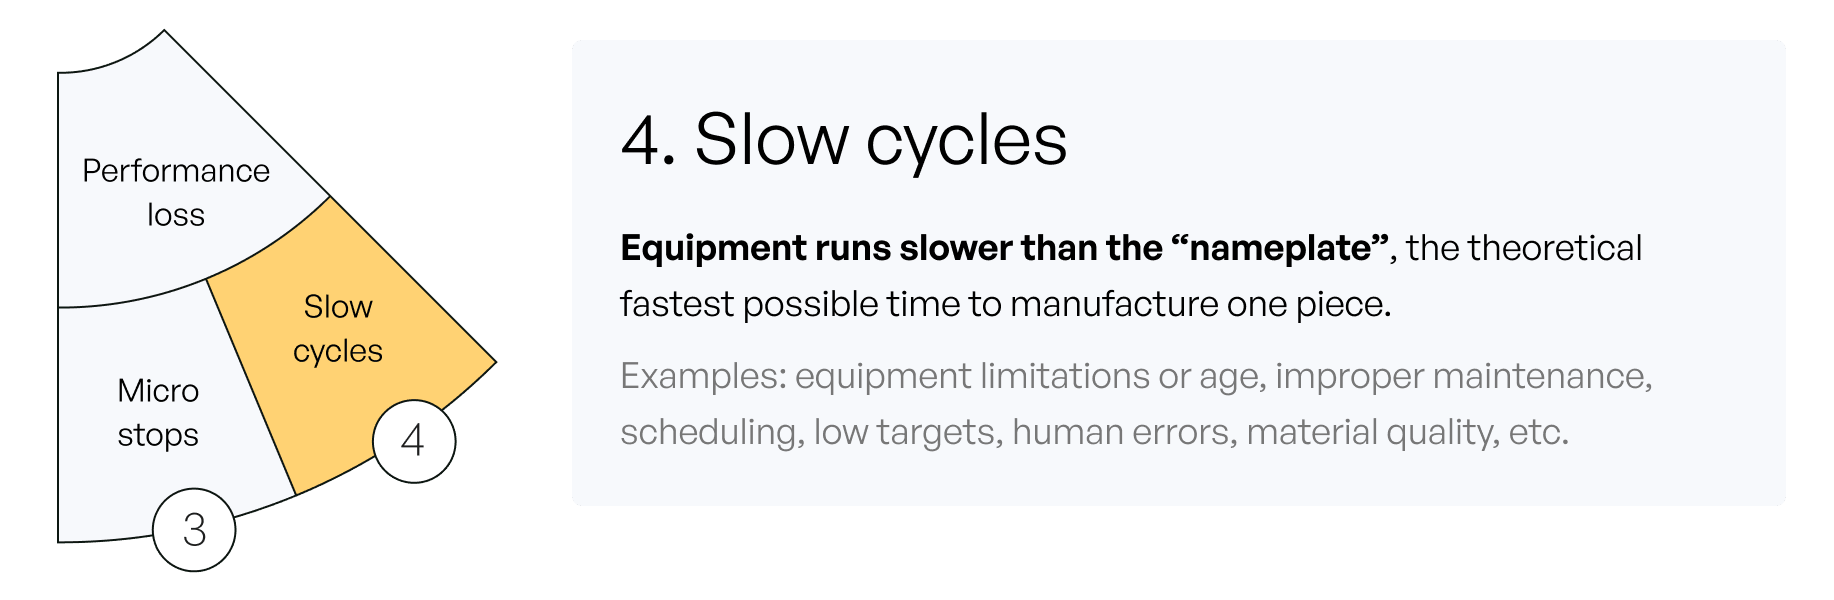
Both micro stops and slow cycles lead to performance losses, but the difference between the two is that in the case of micro stops the equipment is actually stopping, whereas in the case of slow cycles it is still running, albeit slowly.
Slow cycles, just like micro stops, have an impact that is often underestimated. The reason is that the equipment that is running does not attract attention. Also, slowly running machines often become the norm, and staff may simply be unaware of the optimal capacity of the equipment.
The optimal capacity comes from the “nameplate”, or the ideal cycle time, specified by the manufacturer of the machine. Sometimes the ideal cycle time isn’t specified by the manufacturer of the machines. In those cases, it is up to the management of the factory to set the maximum possible speed, for example, based on historical performance. Keep in mind that if performance goes over 100%, it means that the ideal cycle time is set too low.
How to categorize speed loss factors?
The framework of speed loss factors, suggested by Trattner, A., Hvam, L. & Haug, A. in a 16 Dec 2019 article can be divided into three categories.
1. Technology factors
- Reliability of technology (machine reliability, equipment wear, improper maintenance, production stops)
- Technology limitations (incapable equipment, equipment wear, queue capacity for work in process)
- Environmental limitations
2. Human factors
- Operator inefficiency (i.e. due to lack of training)
- Measurement error
- Planning issues (ideal cycle time set too low or target too unambitious, production scheduling, capacity utilization issues)
3. Product factors
- Material availability
- Material quality (could also be due to natural process variation or raw material mix)
- Product variety
- Product quality (quality of finished goods)
Examples of slow cycles
- The equipment may run slower due to inadequate lubrication (maintenance issues).
- PLC may have wrong settings or adjustments (operator training issues).
- Operators may be slowing down the machine deliberately to avoid jams or rejected parts (material quality or product quality). Or, they may run the machine too slow unintentionally because of unambitious targets.
How to reduce performance losses occurring due to slow cycles?
The key moment in the battle with slow cycles is determining the ideal cycle time and setting the target for operators.
The next step is to record the actual cycle time, along with the reasons for reduced speed. Slow cycles, just like micro stops, cannot be recorded manually, therefore an automated production monitoring system, such as Evocon’s OEE software, is needed.
Once there is enough data, it is possible to assess the impact of each speed loss factor and to apply Root Cause Analysis (RCA) to solve the issues and improve cycle times in manufacturing.
How Evocon visualizes slow cycles?
How Evocon visualizes cycles times set too low?
Quality Loss in Manufacturing
What is quality? It is the proportion of actual production throughput, which meets the customer specification exactly and is right the first time. Read more about quality and how to calculate it.
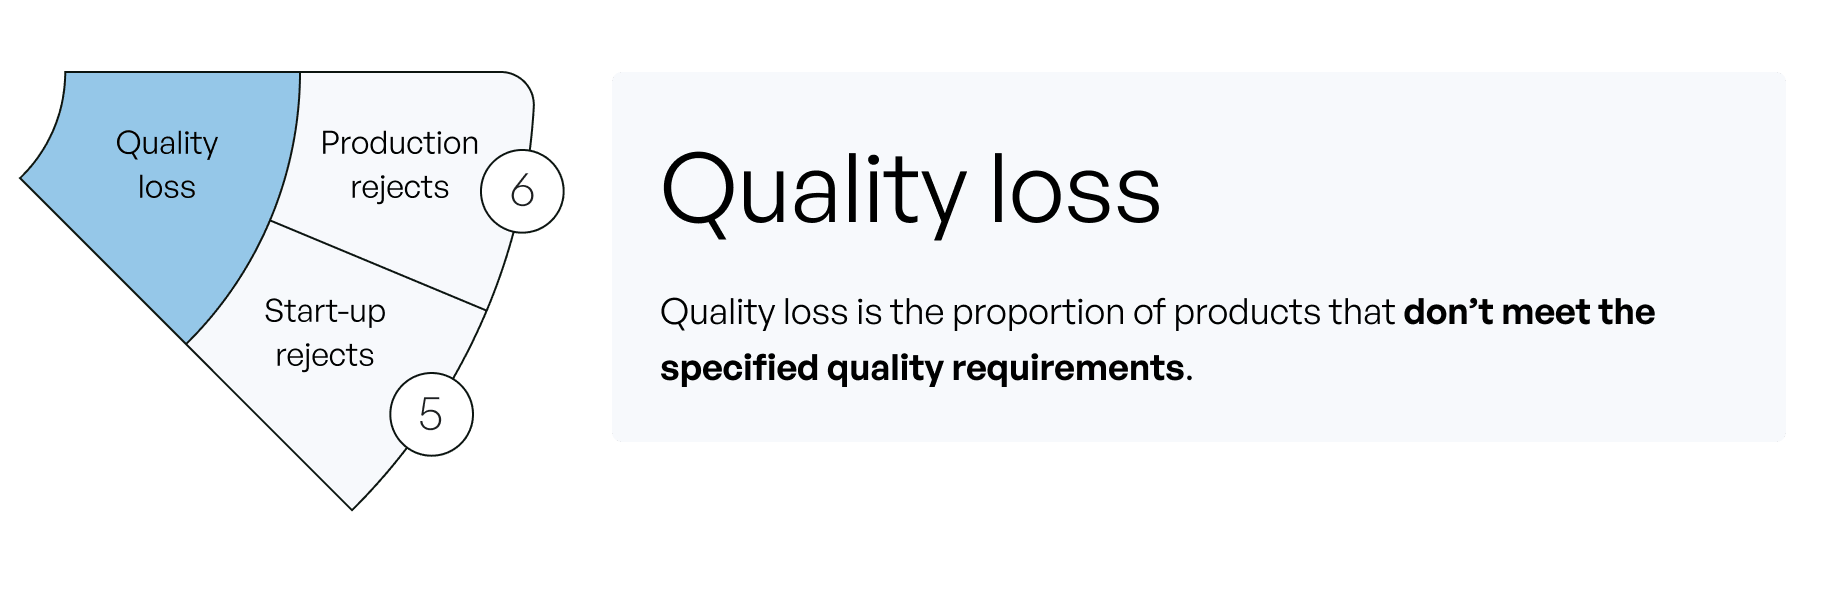
What is quality loss? It is the proportion of products that don’t meet the specified quality requirements.
While the quality loss is somewhat less common, it is the most expensive, because not only material is lost, but also all production time spent on producing the faulty part is wasted. Even if a part can still be reworked, it is still classified as a loss: reworking takes time, both from the machine and the operator.
When striving for better OEE, it is advisable to strive towards 100% quality or “zero defects”.
5. Quality loss due to start-up rejects
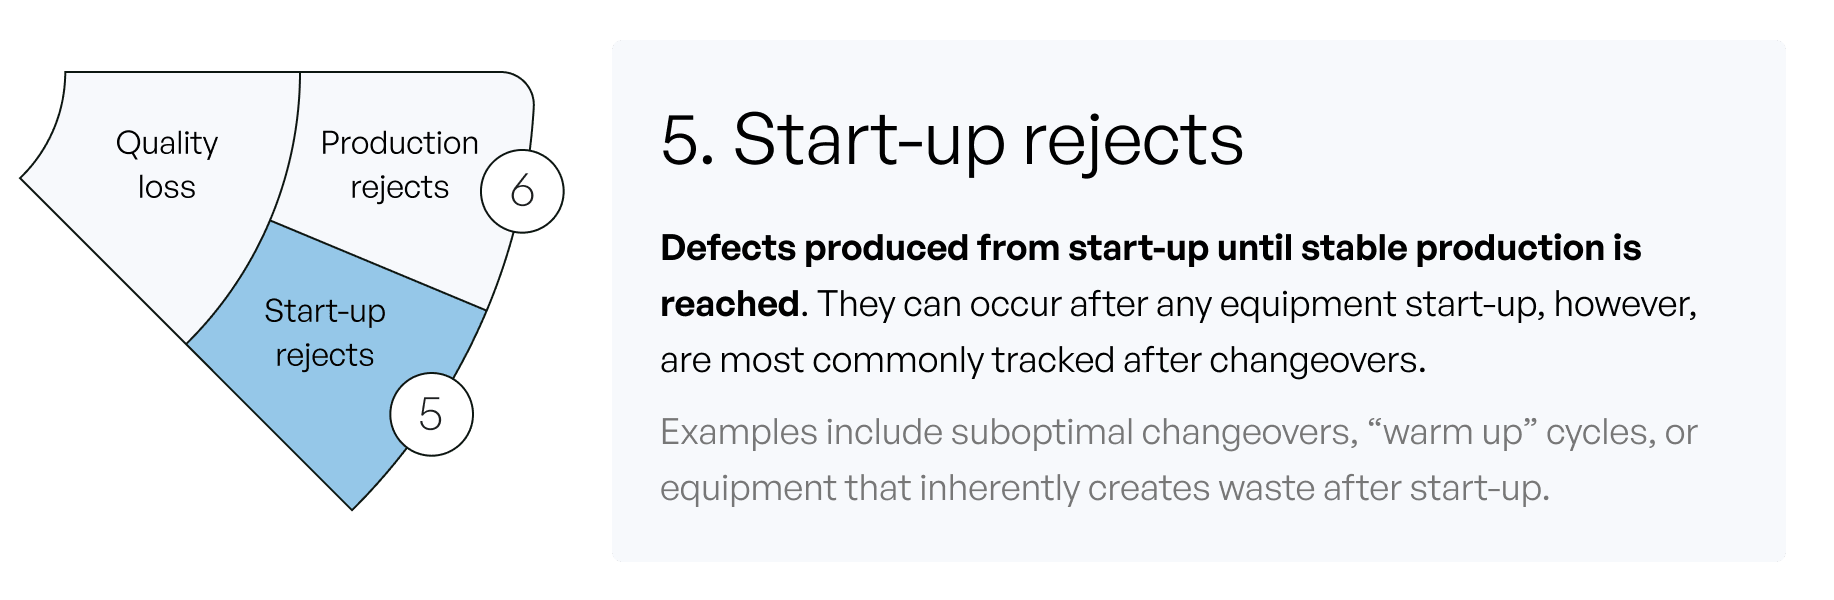
This type of quality loss occurs when equipment is unstable and produces faulty parts. Instability periods happen after:
- Turning a machine on
- Change of settings
- Product changeover
How to reduce quality losses occurring due to start-up rejects?
To reduce rejects after changeovers operators need to know how to change equipment settings as precisely as possible, avoiding a trial and error approach. Technology can help by saving the settings for each type of product.
For less obvious causes of rejects, automated production tracking helps to reveal patterns among problems.
6. Quality loss due to production rejects
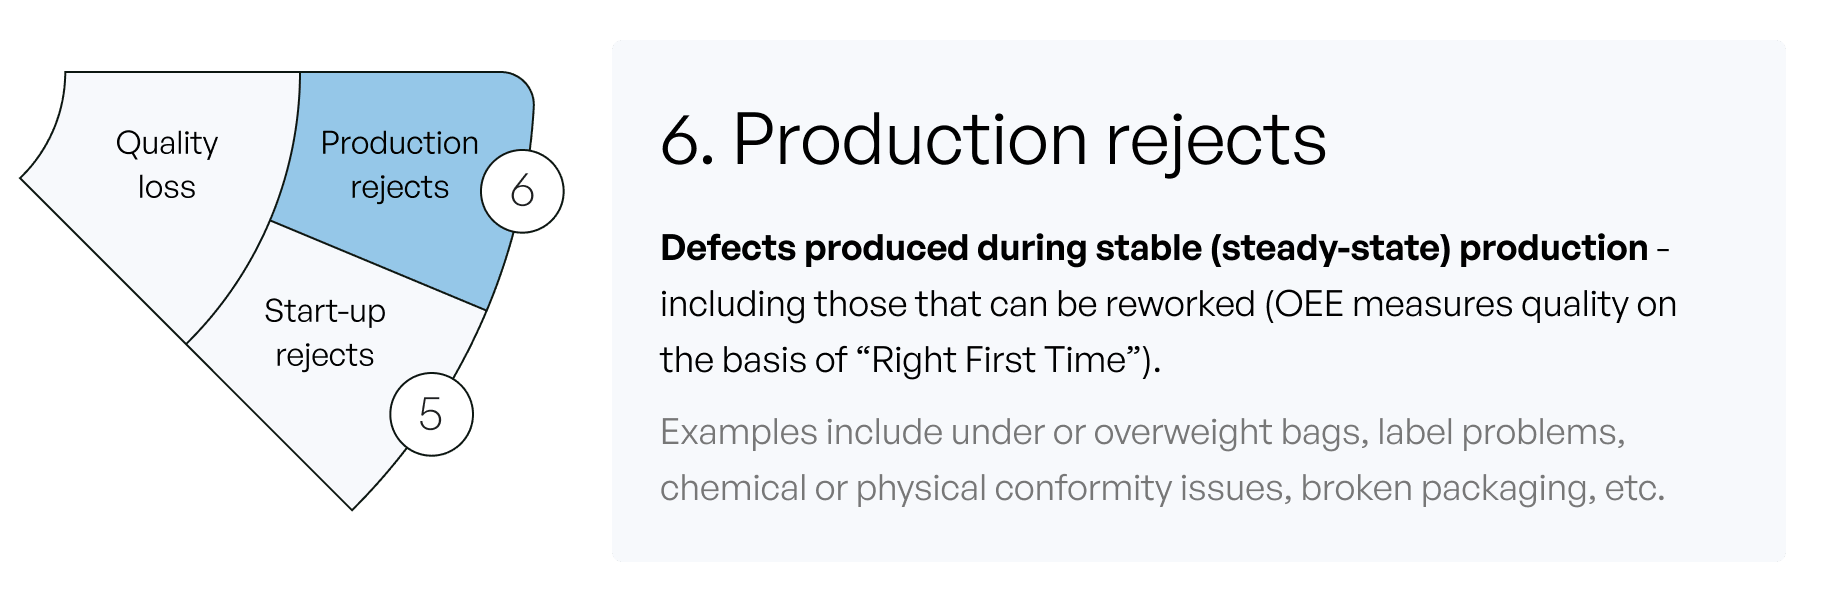
Possible reasons for defects produced during stable production:
- Wrong equipment settings
- Expired equipment not functioning smoothly
- Poor equipment handling
Examples of defects:
- Under/overweight bags
- Wrong labeling
- Broken packaging
- Chemical or physical conformity issues
How to reduce quality losses occurring due to production rejects?
Collecting data from sensors or cameras can help predict when products are about to deviate too much from the quality standards. That way, it is possible to adjust the equipment to avoid unacceptable quality.
How Evocon visualizes quality losses?
Time Not Scheduled for Production
While this is not one of the Six Big Losses, it still deserves an explanation.
Time not scheduled for production has to do with equipment utilization, also called machine utilization. It indicates the time that you lose because you haven’t scheduled your equipment to run, for example, due to no demand for the product.
While time not scheduled for production is not a loss in a sense that it does not indicate poor equipment efficiency, but it is still a loss that you can address via sales and planning to realize the potential of your current equipment.
Time not scheduled for production is not part of the OEE calculation. However, it is part of TEEP (Total Effective Equipment Performance) metric and also part of your “hidden factory”.
Discover your hidden factory
Start monitoring your production to discover the true potential of your factory. Free for 30 days.
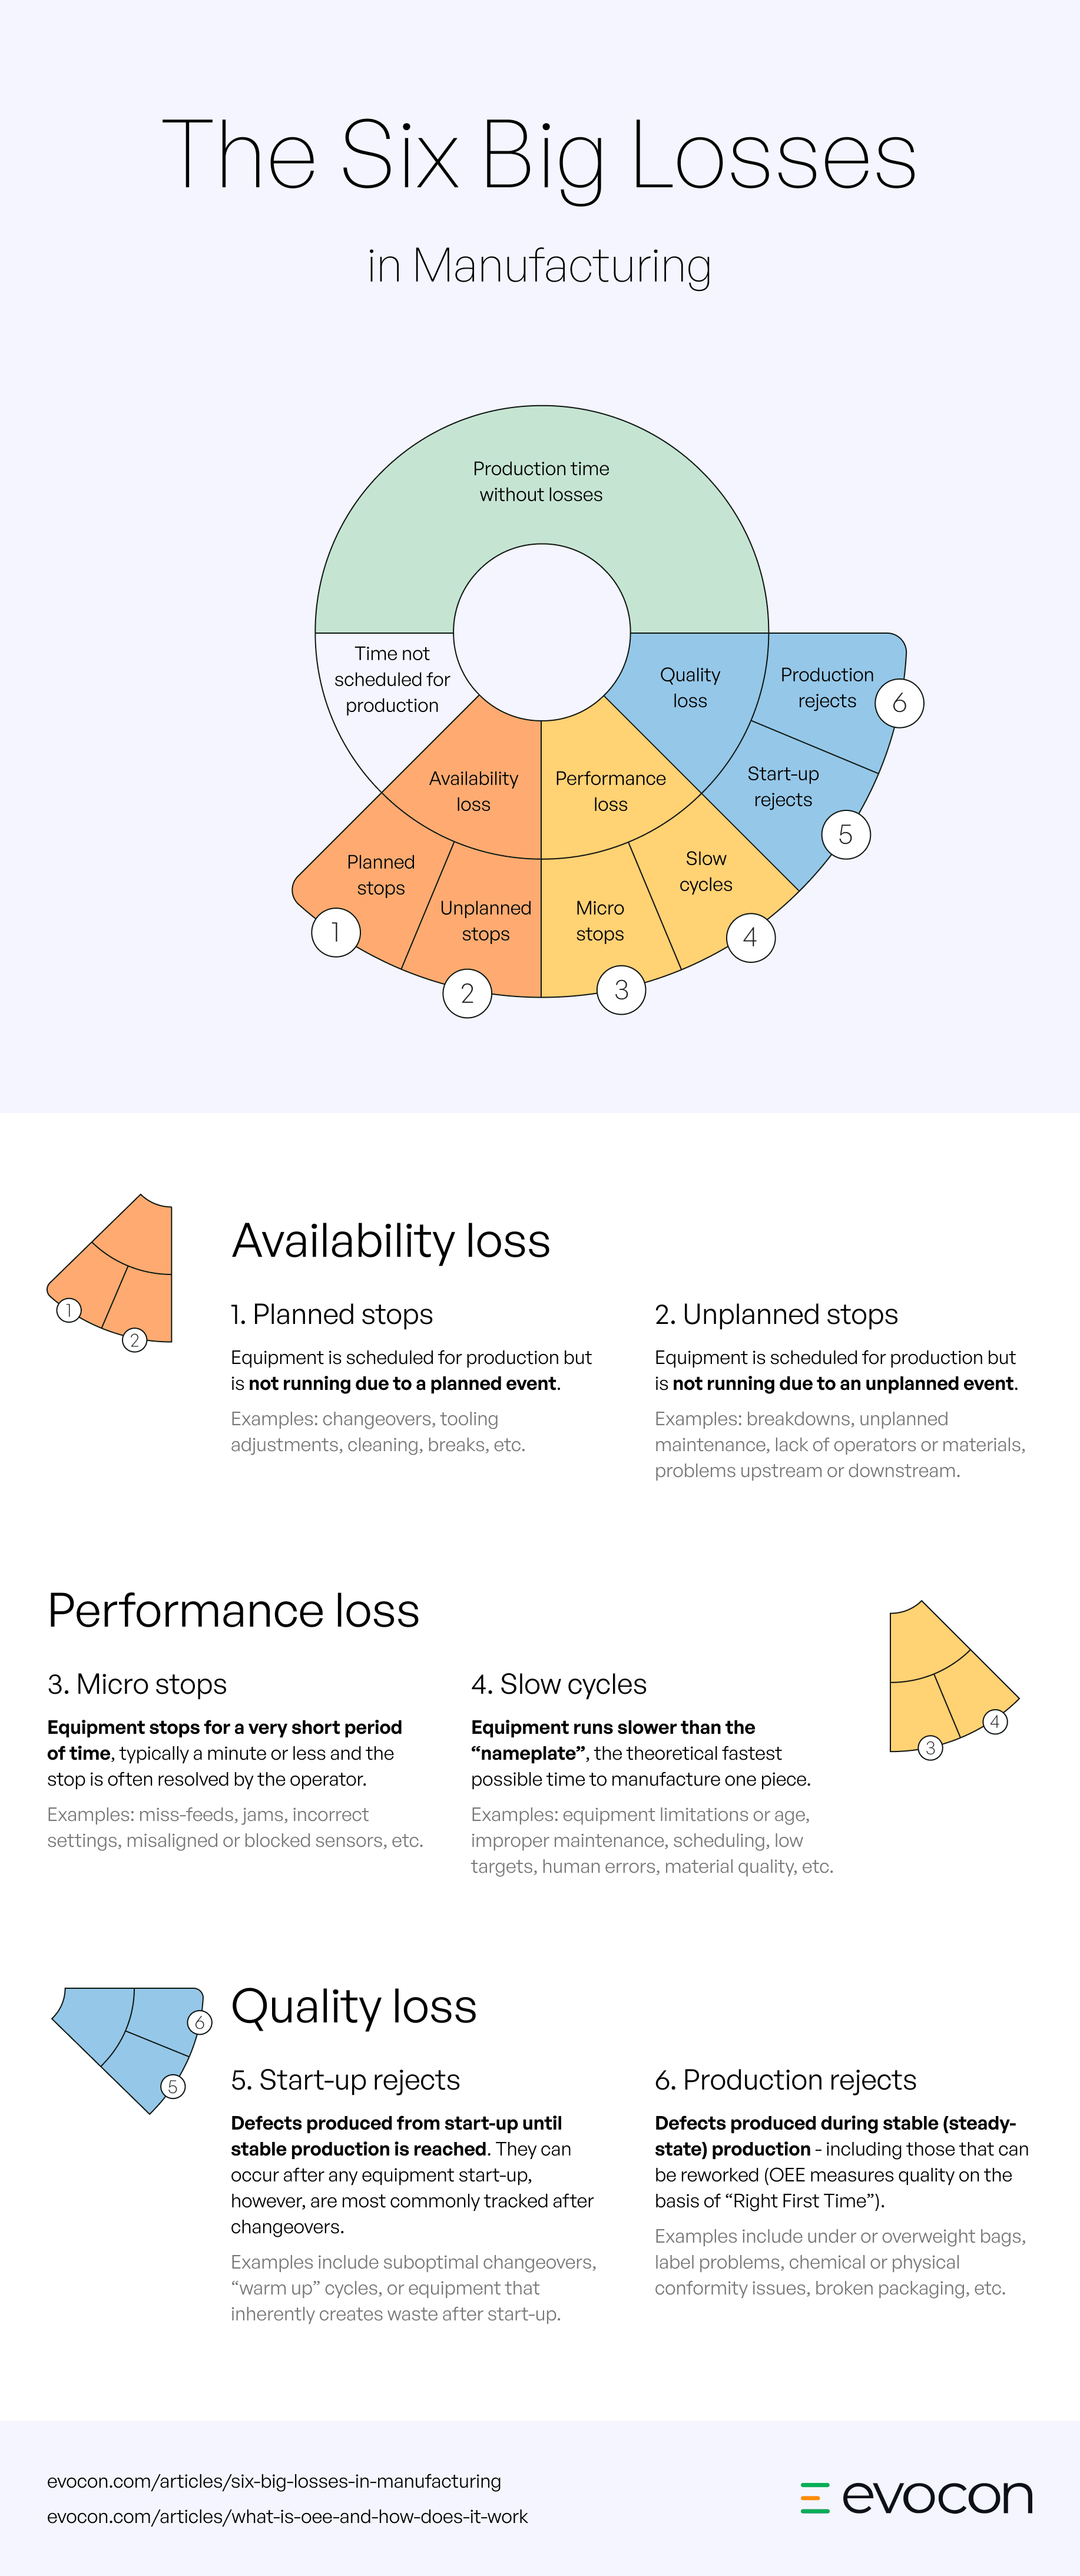
Overview of Six Big Losses
Naming and categorizing your losses is an essential step in your journey towards world-class OEE and the Six Big Losses framework is a great tool to help you with that.
Here we provide a quick overview of all types of losses, and below you will find the summary as an infographic (as a picture and as a PDF) and a printer-friendly one-page summary PDF for your convenience.
Availability loss
1. Planned stops
Time where equipment is scheduled for production but is not running due to a planned event. Examples include changeovers, tooling adjustments, cleaning, planned maintenance, quality inspection, rest breaks, meetings, toolbox talks, etc.
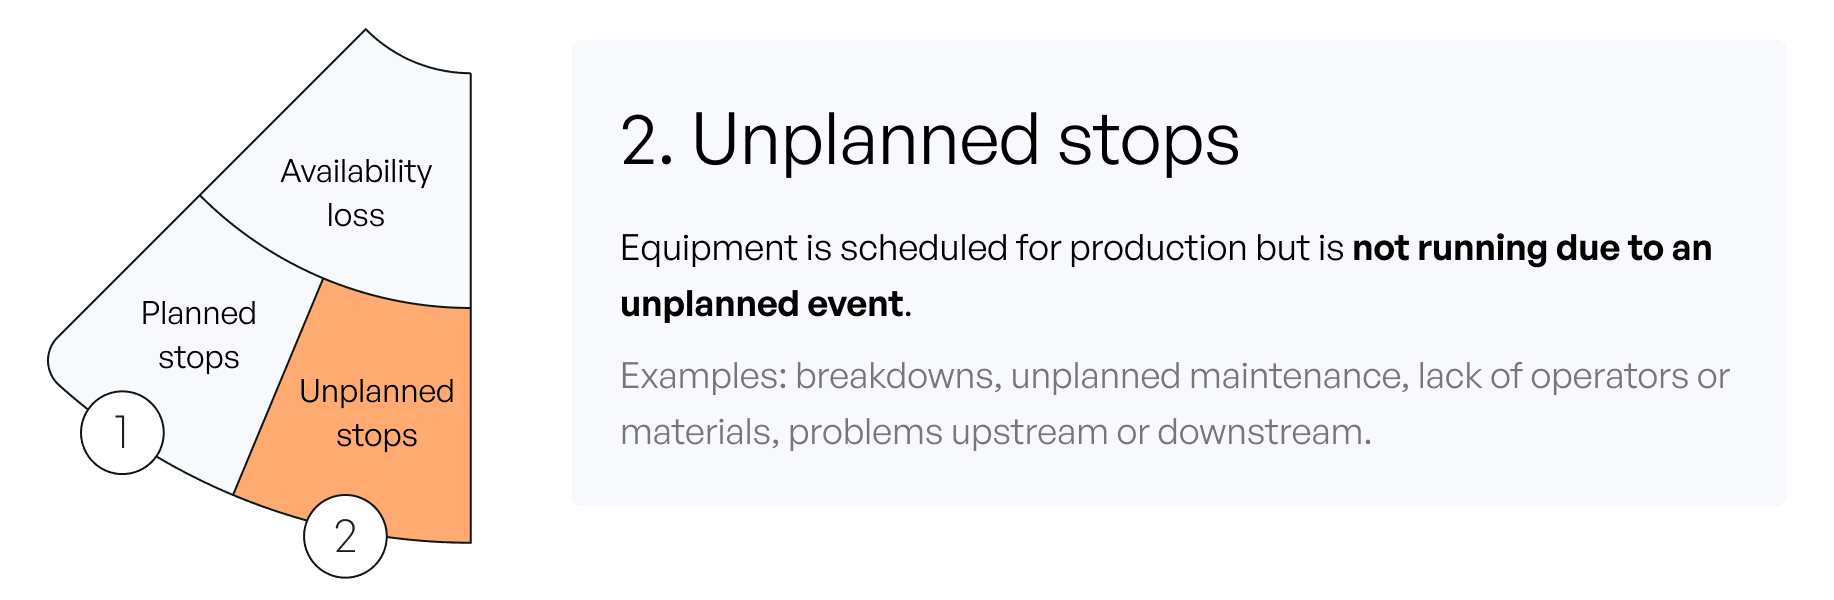
2. Unplanned stops
Time where equipment is scheduled for production but is not running due to an unplanned event. Examples include equipment breakdowns, unplanned maintenance, lack of operators or materials, being starved by upstream equipment, or being blocked by downstream equipment.
Performance loss
3. Micro stops
Equipment stops for a very short period of time, typically a minute or less and the stop is often resolved by the operator. Examples: miss-feeds, material jams, incorrect settings, misaligned or blocked sensors, equipment design issues, and periodic quick cleaning.
4. Slow cycles
Equipment runs slower than the “nameplate”, the theoretical fastest possible time to manufacture one piece. May be a consequence of equipment limitations or age, improper maintenance, scheduling, low targets, human errors, inexperience, material quality, product variety, rejects.
Quality loss
5. Start-up rejects
Defects produced from start-up until stable production is reached. They can occur after any equipment start-up, however, they are most common after changeovers. Examples include suboptimal changeovers, equipment that needs “warm-up” cycles, or equipment that inherently creates waste after start-up.
6. Production rejects
Defects produced during stable (steady-state) production – including those that can be reworked (OEE measures quality on the basis of “Right First Time”). Examples include under or overweight bags, label problems, chemical or physical conformity issues, broken packaging, etc.
Download this infographic as PDF
or a printer friendly version of it as PDF.