Product Overview
  Enterprise Package
  Integrations
  Security
  Hardware
  FAQ
FAQ 
 How Evocon Works
  OEE Monitoring
  Downtime Tracking
  Manufacturing Data Collection
  Production Monitoring
  Continuous Improvement
  Quality Control
 Learn
Learn  Case Studies
  Reports and Tools
  OEE Fundamentals
  Increasing Productivity
  Sustainability in Manufacturing
  The 5-Day Guide to Launch OEE Monitoring in 2026
 OEE Calculator
  ROI Calculator
  OEE Excel Template
  Evocon
  Contact
  Join us
  Sign in
 Back to main menu
Production Reporting
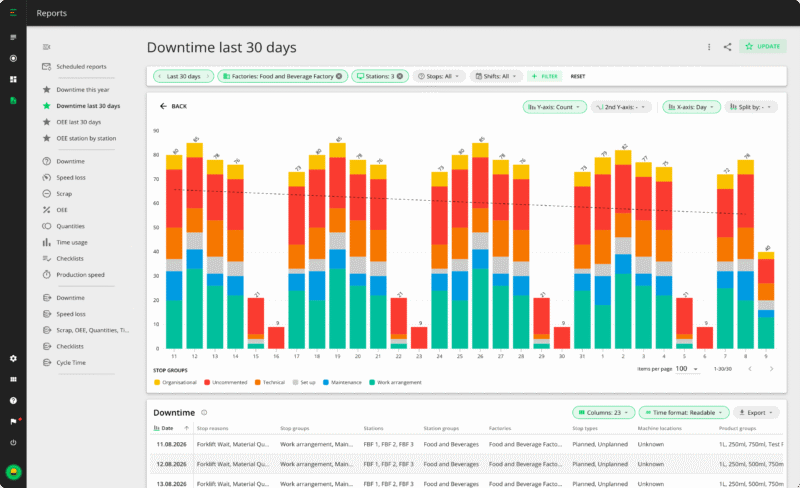

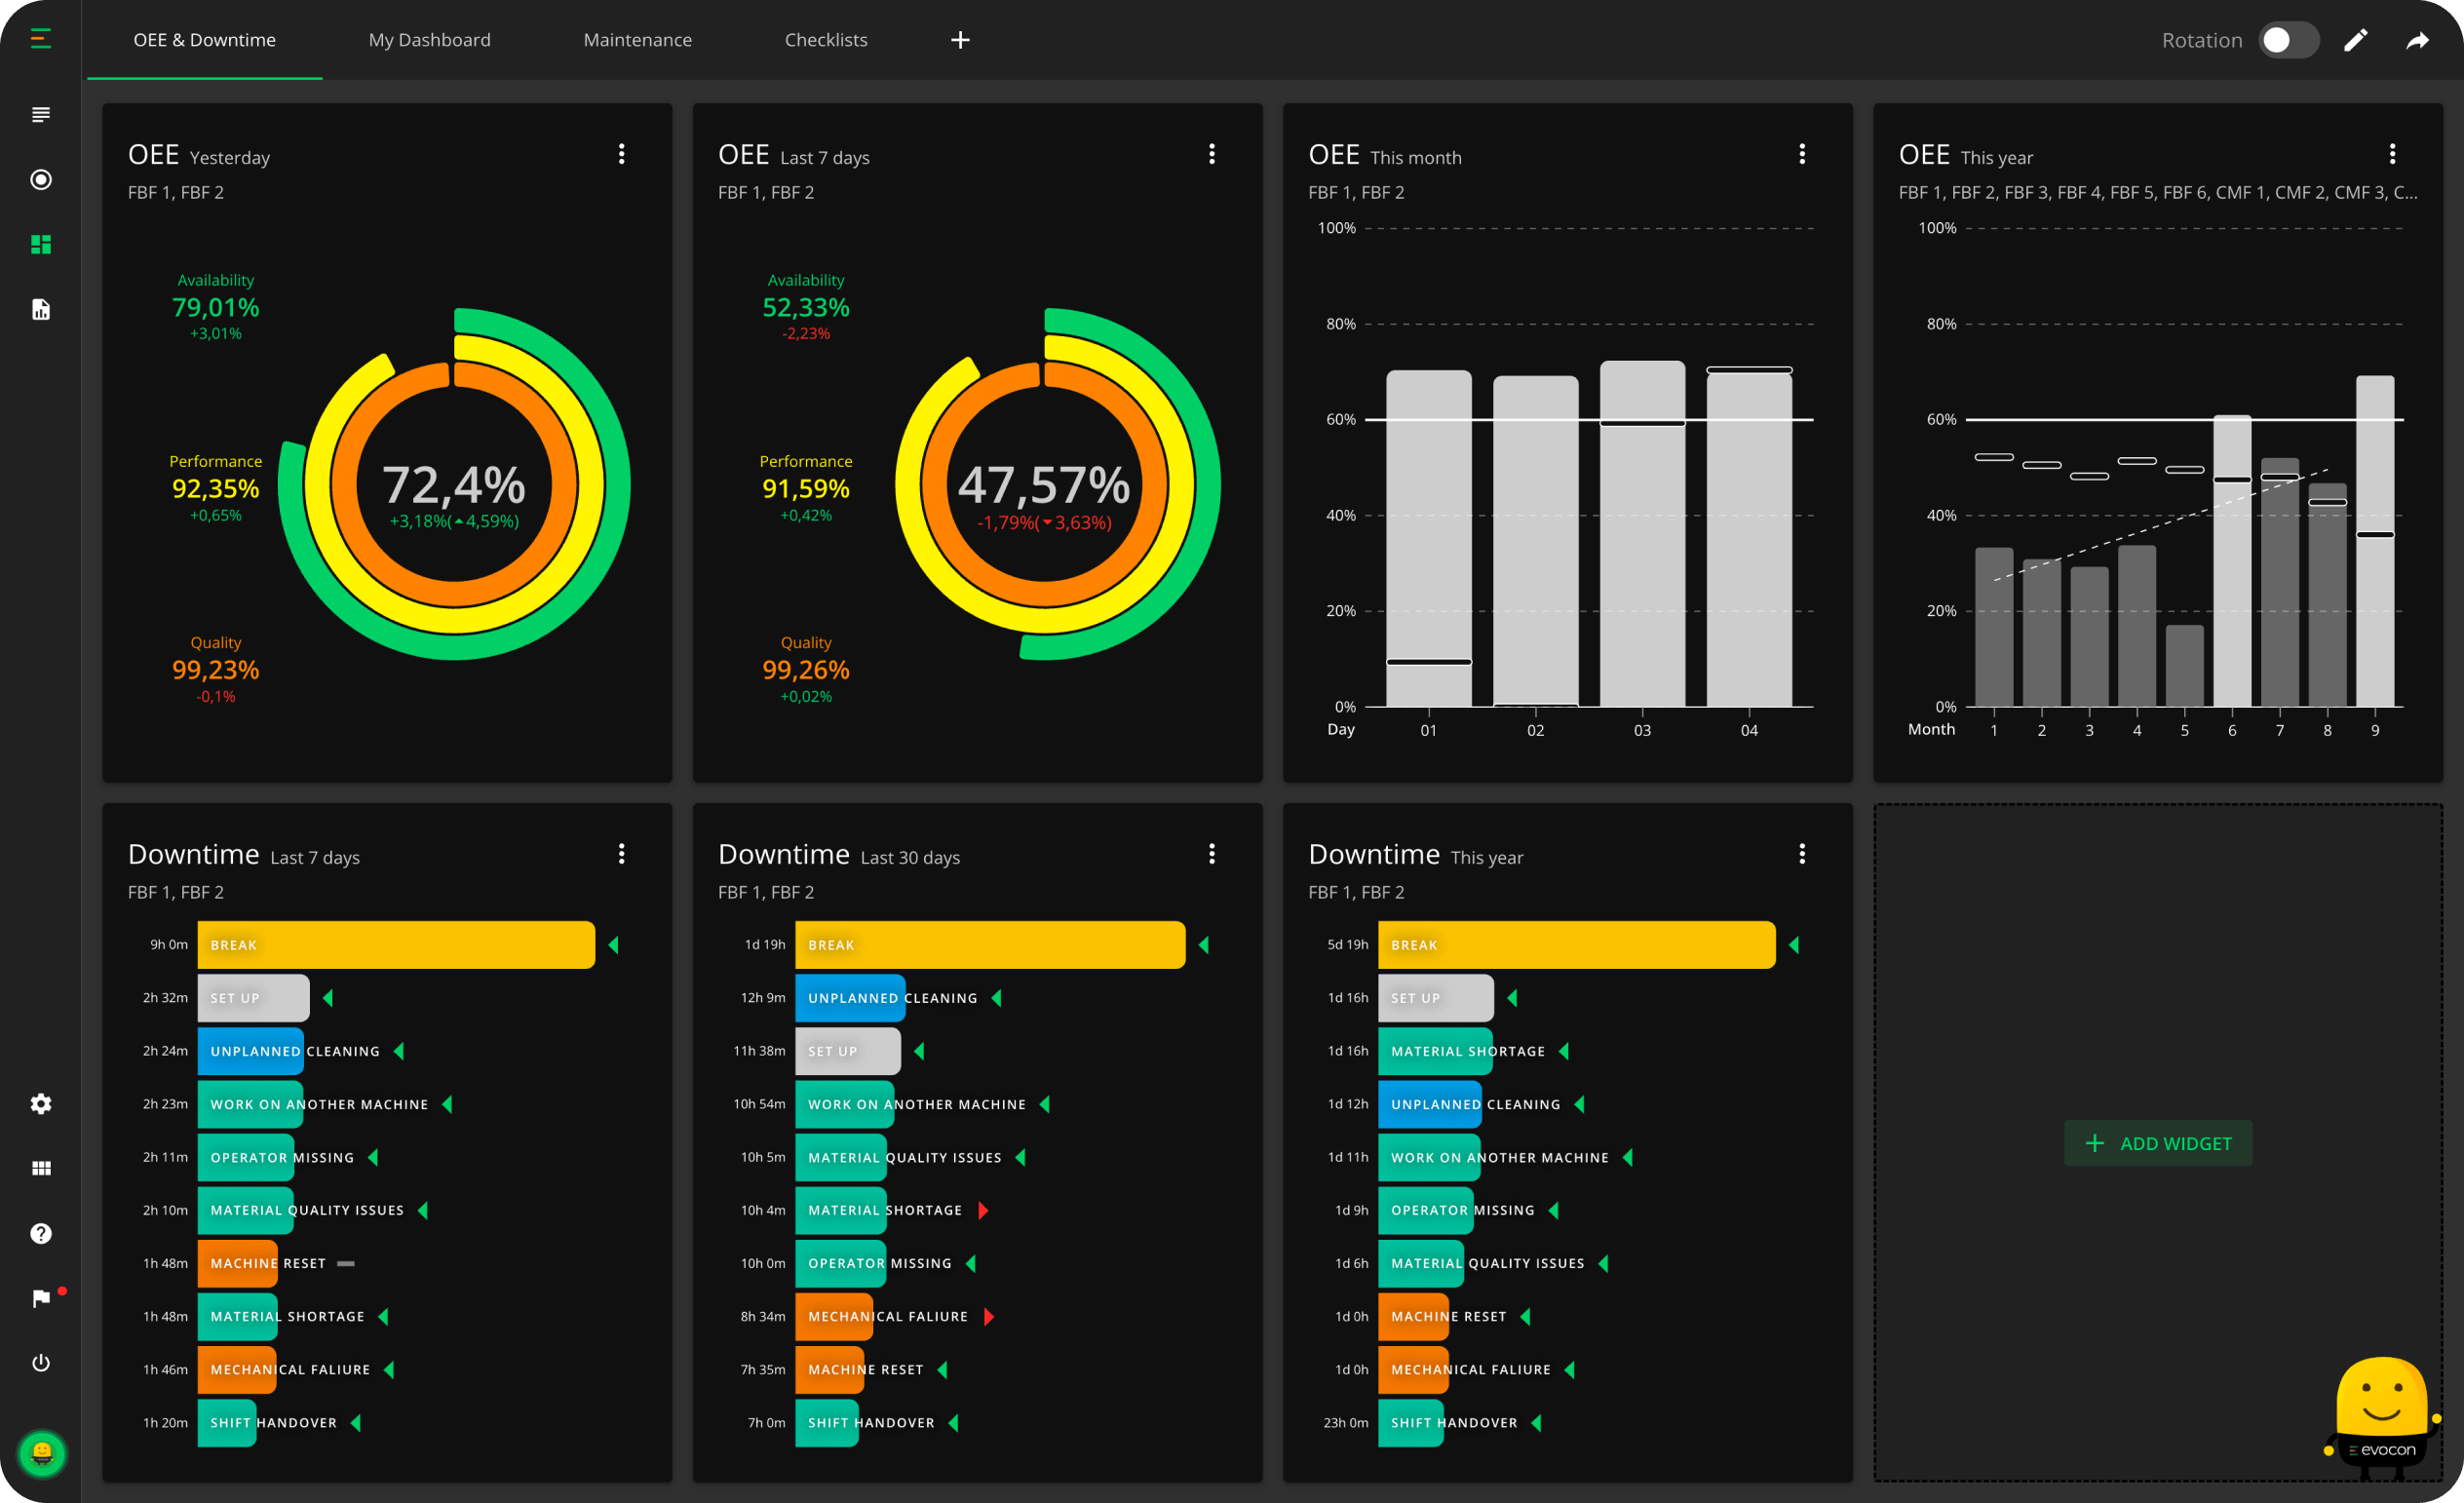
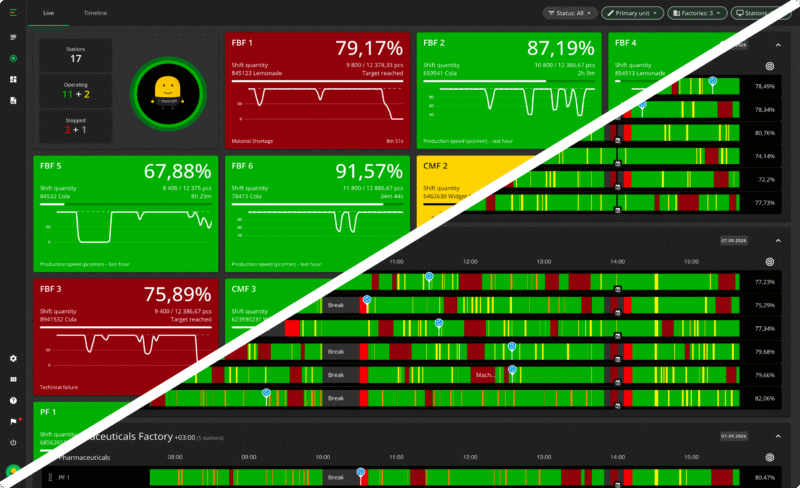
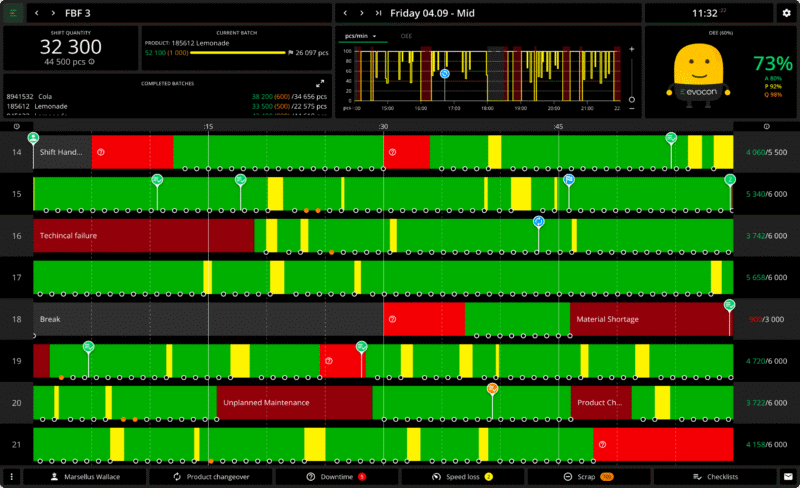
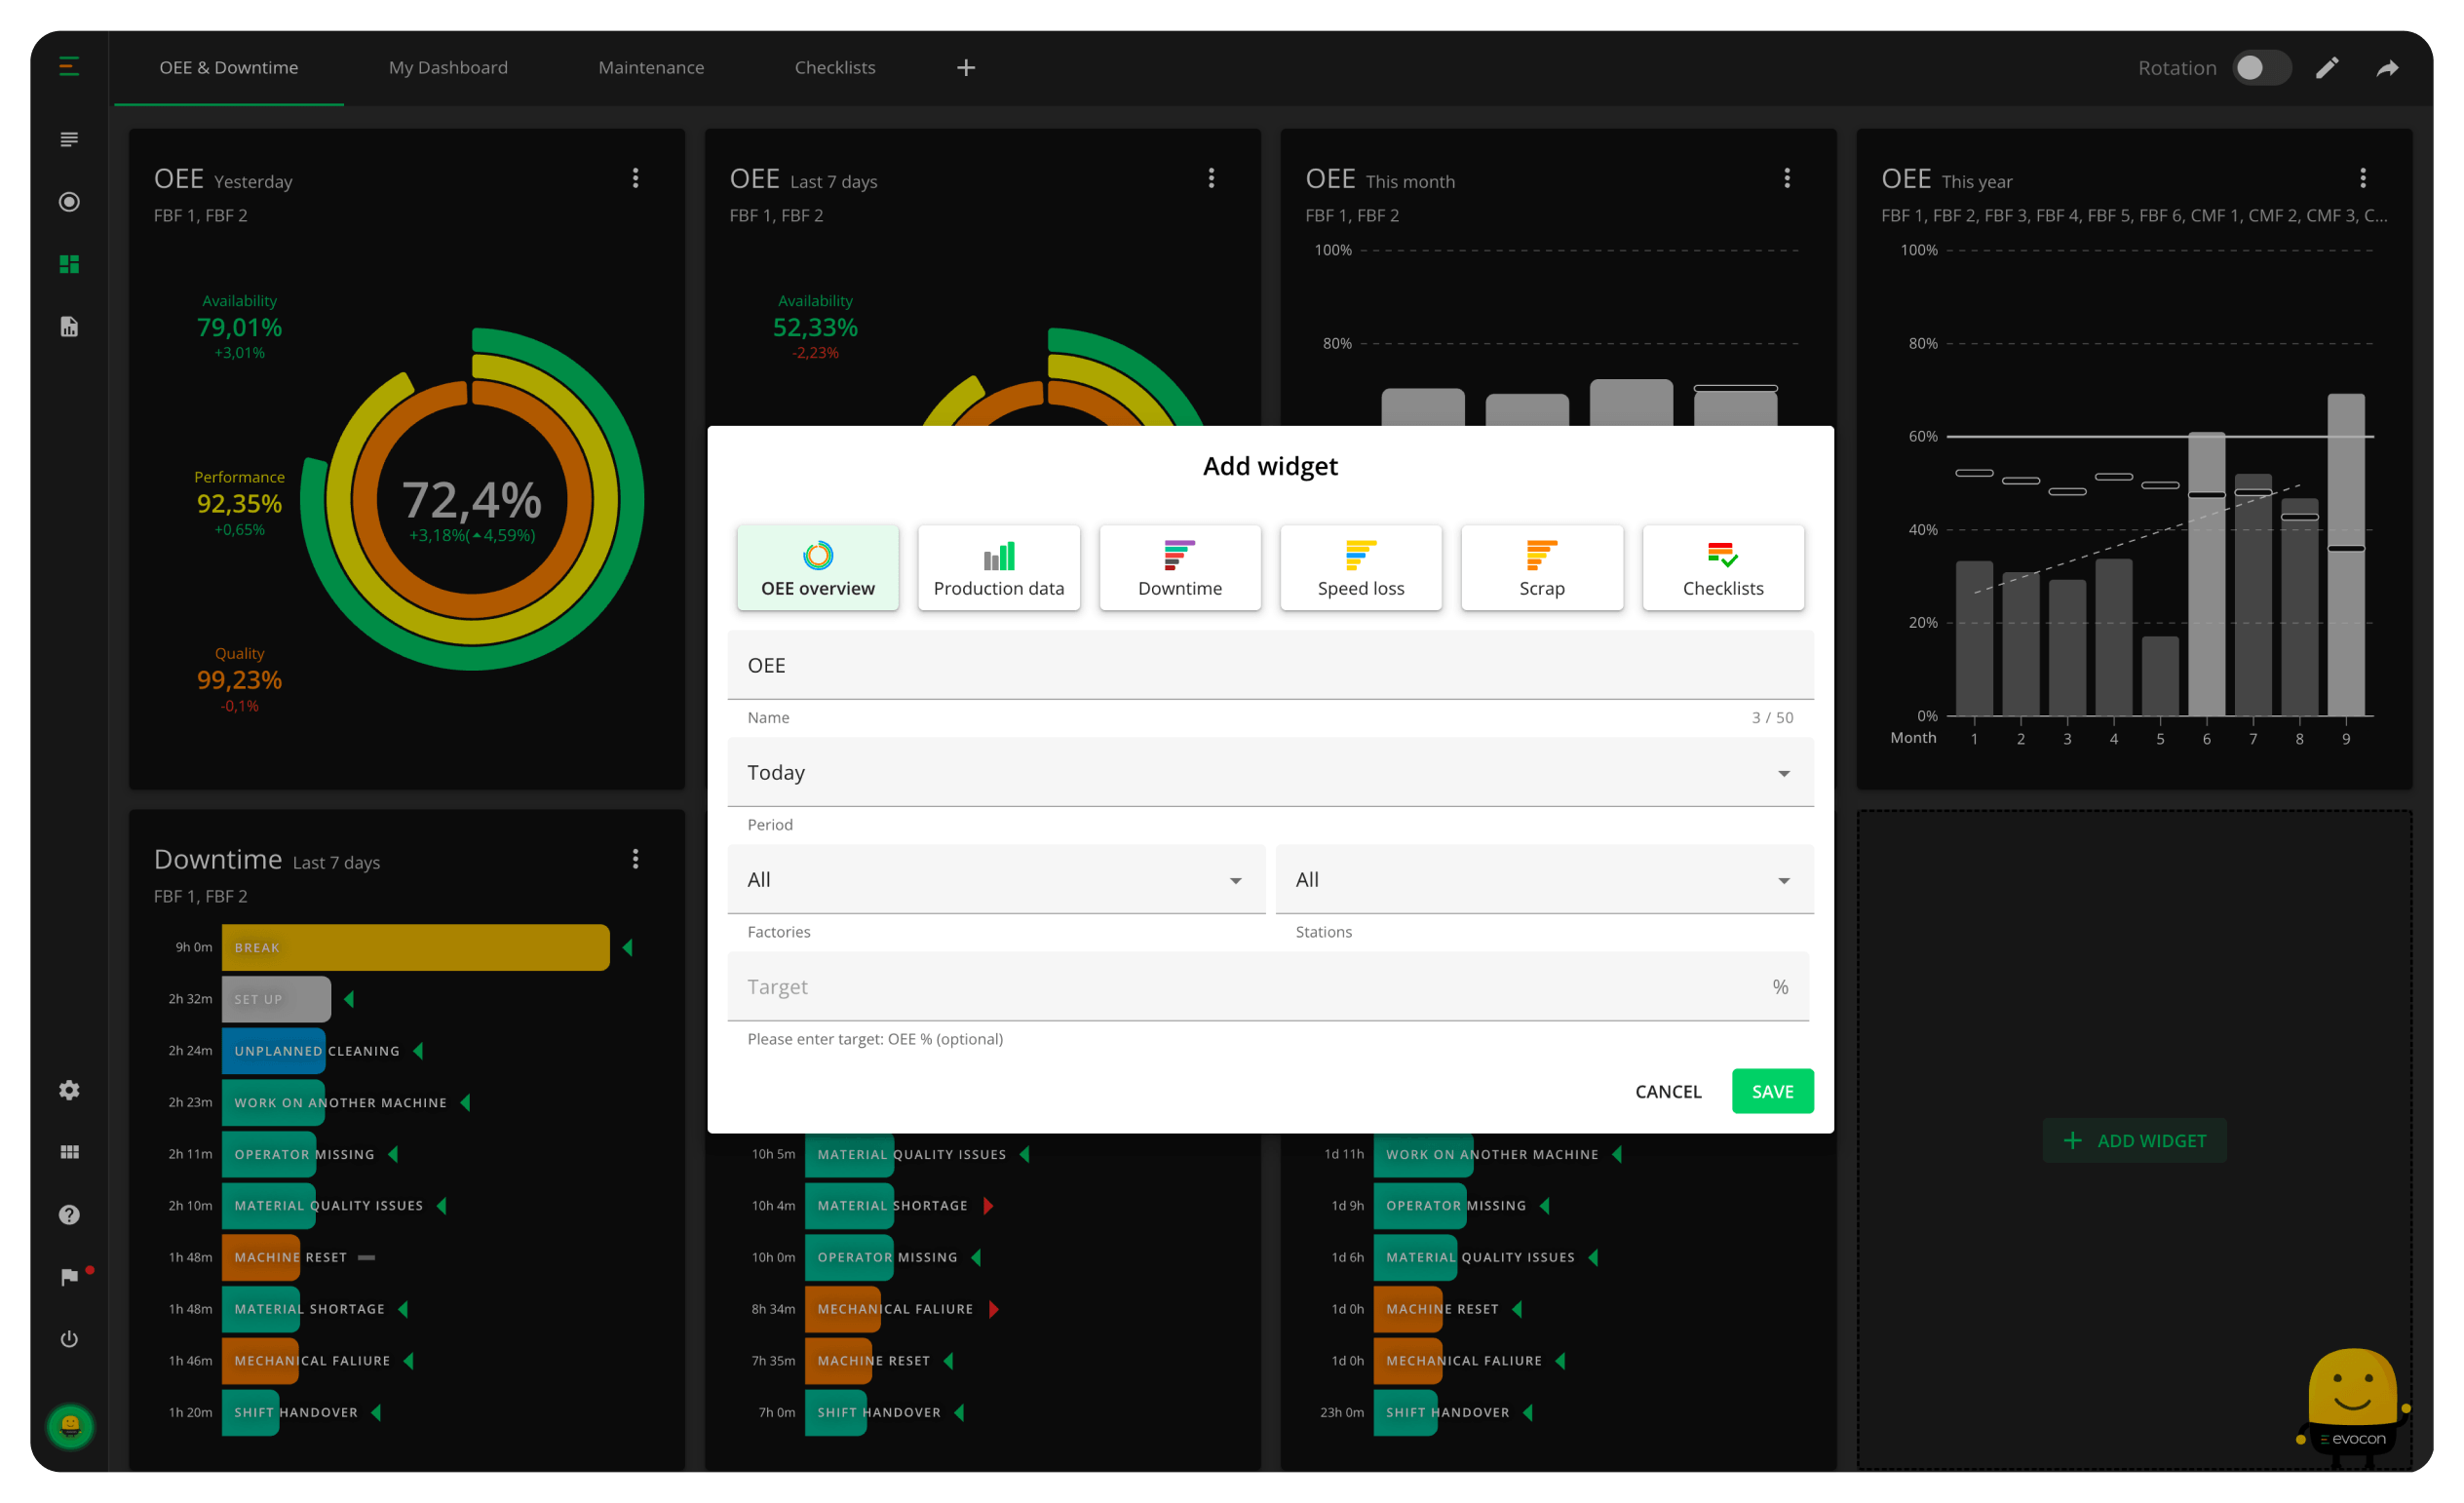
Evocon’s OEE dashboard transforms complex data into clear, actionable insights, letting you track OEE and production performance in real-time—anytime, anywhere.
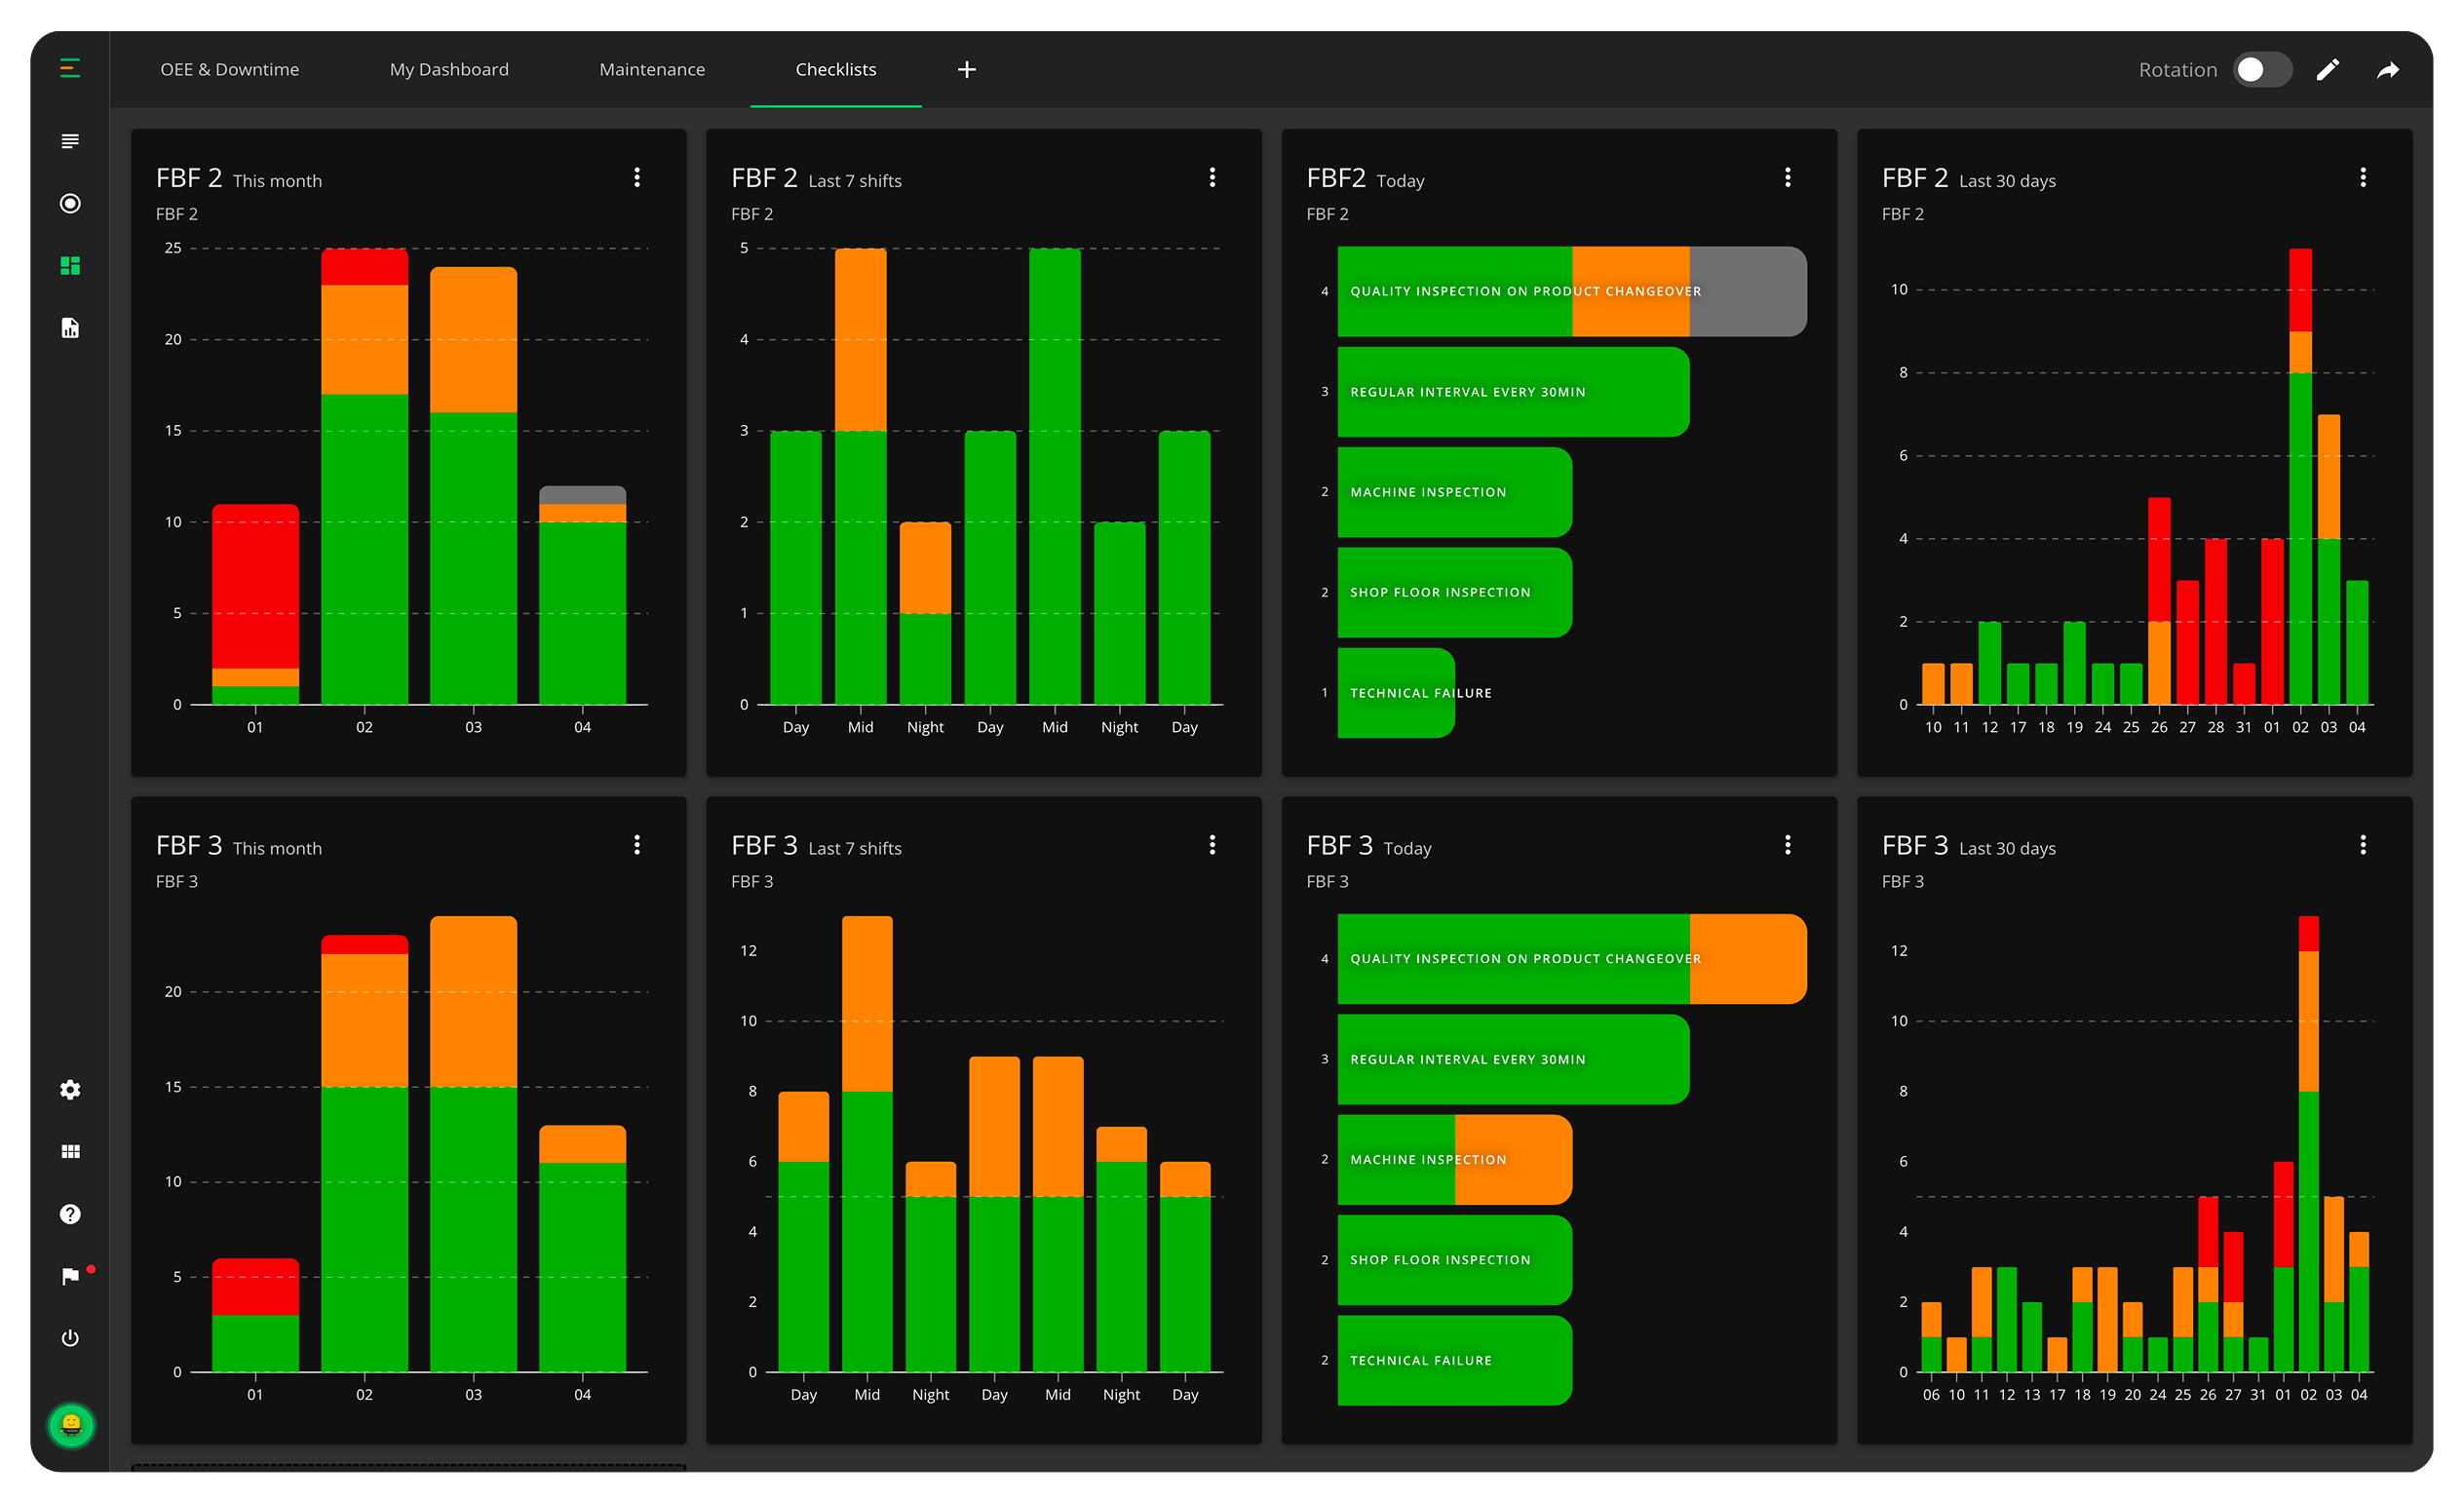
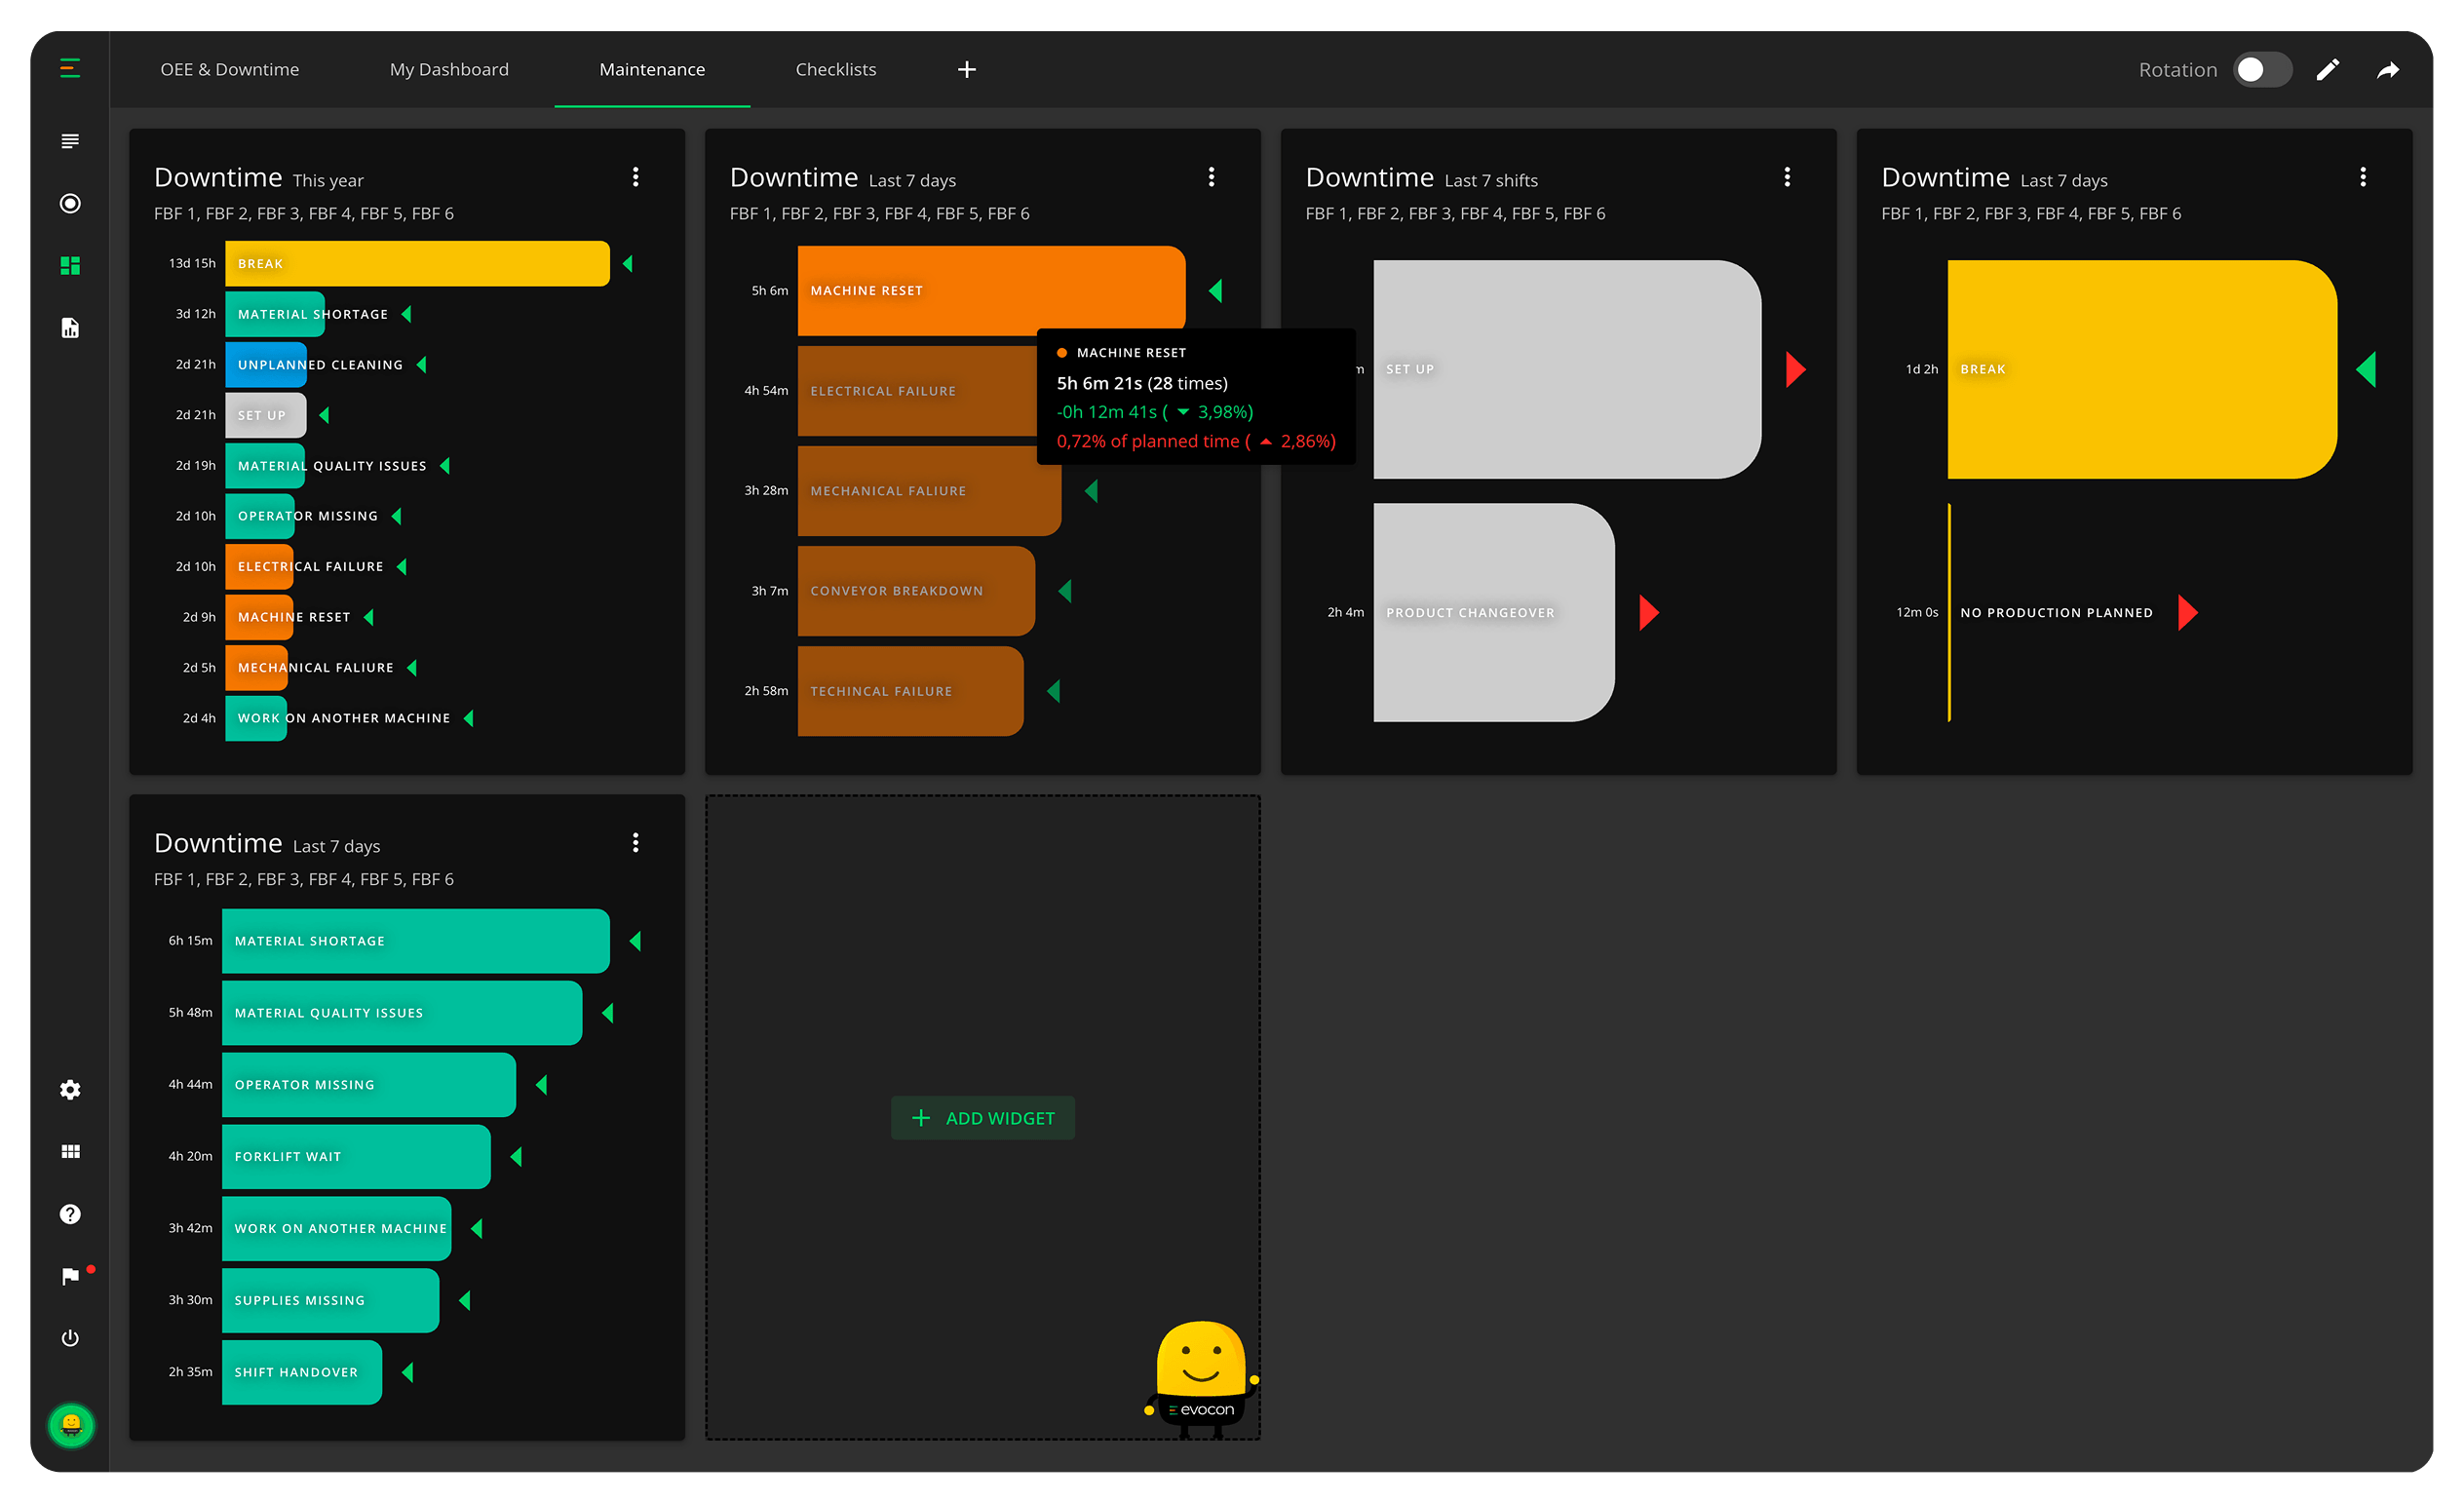
Missed checks turn into quality problems and machine breakdowns. The OEE dashboard shows you whether quality, maintenance, and other recurring checks are done on time so failed or missed checks get fixed before causing bigger issues.
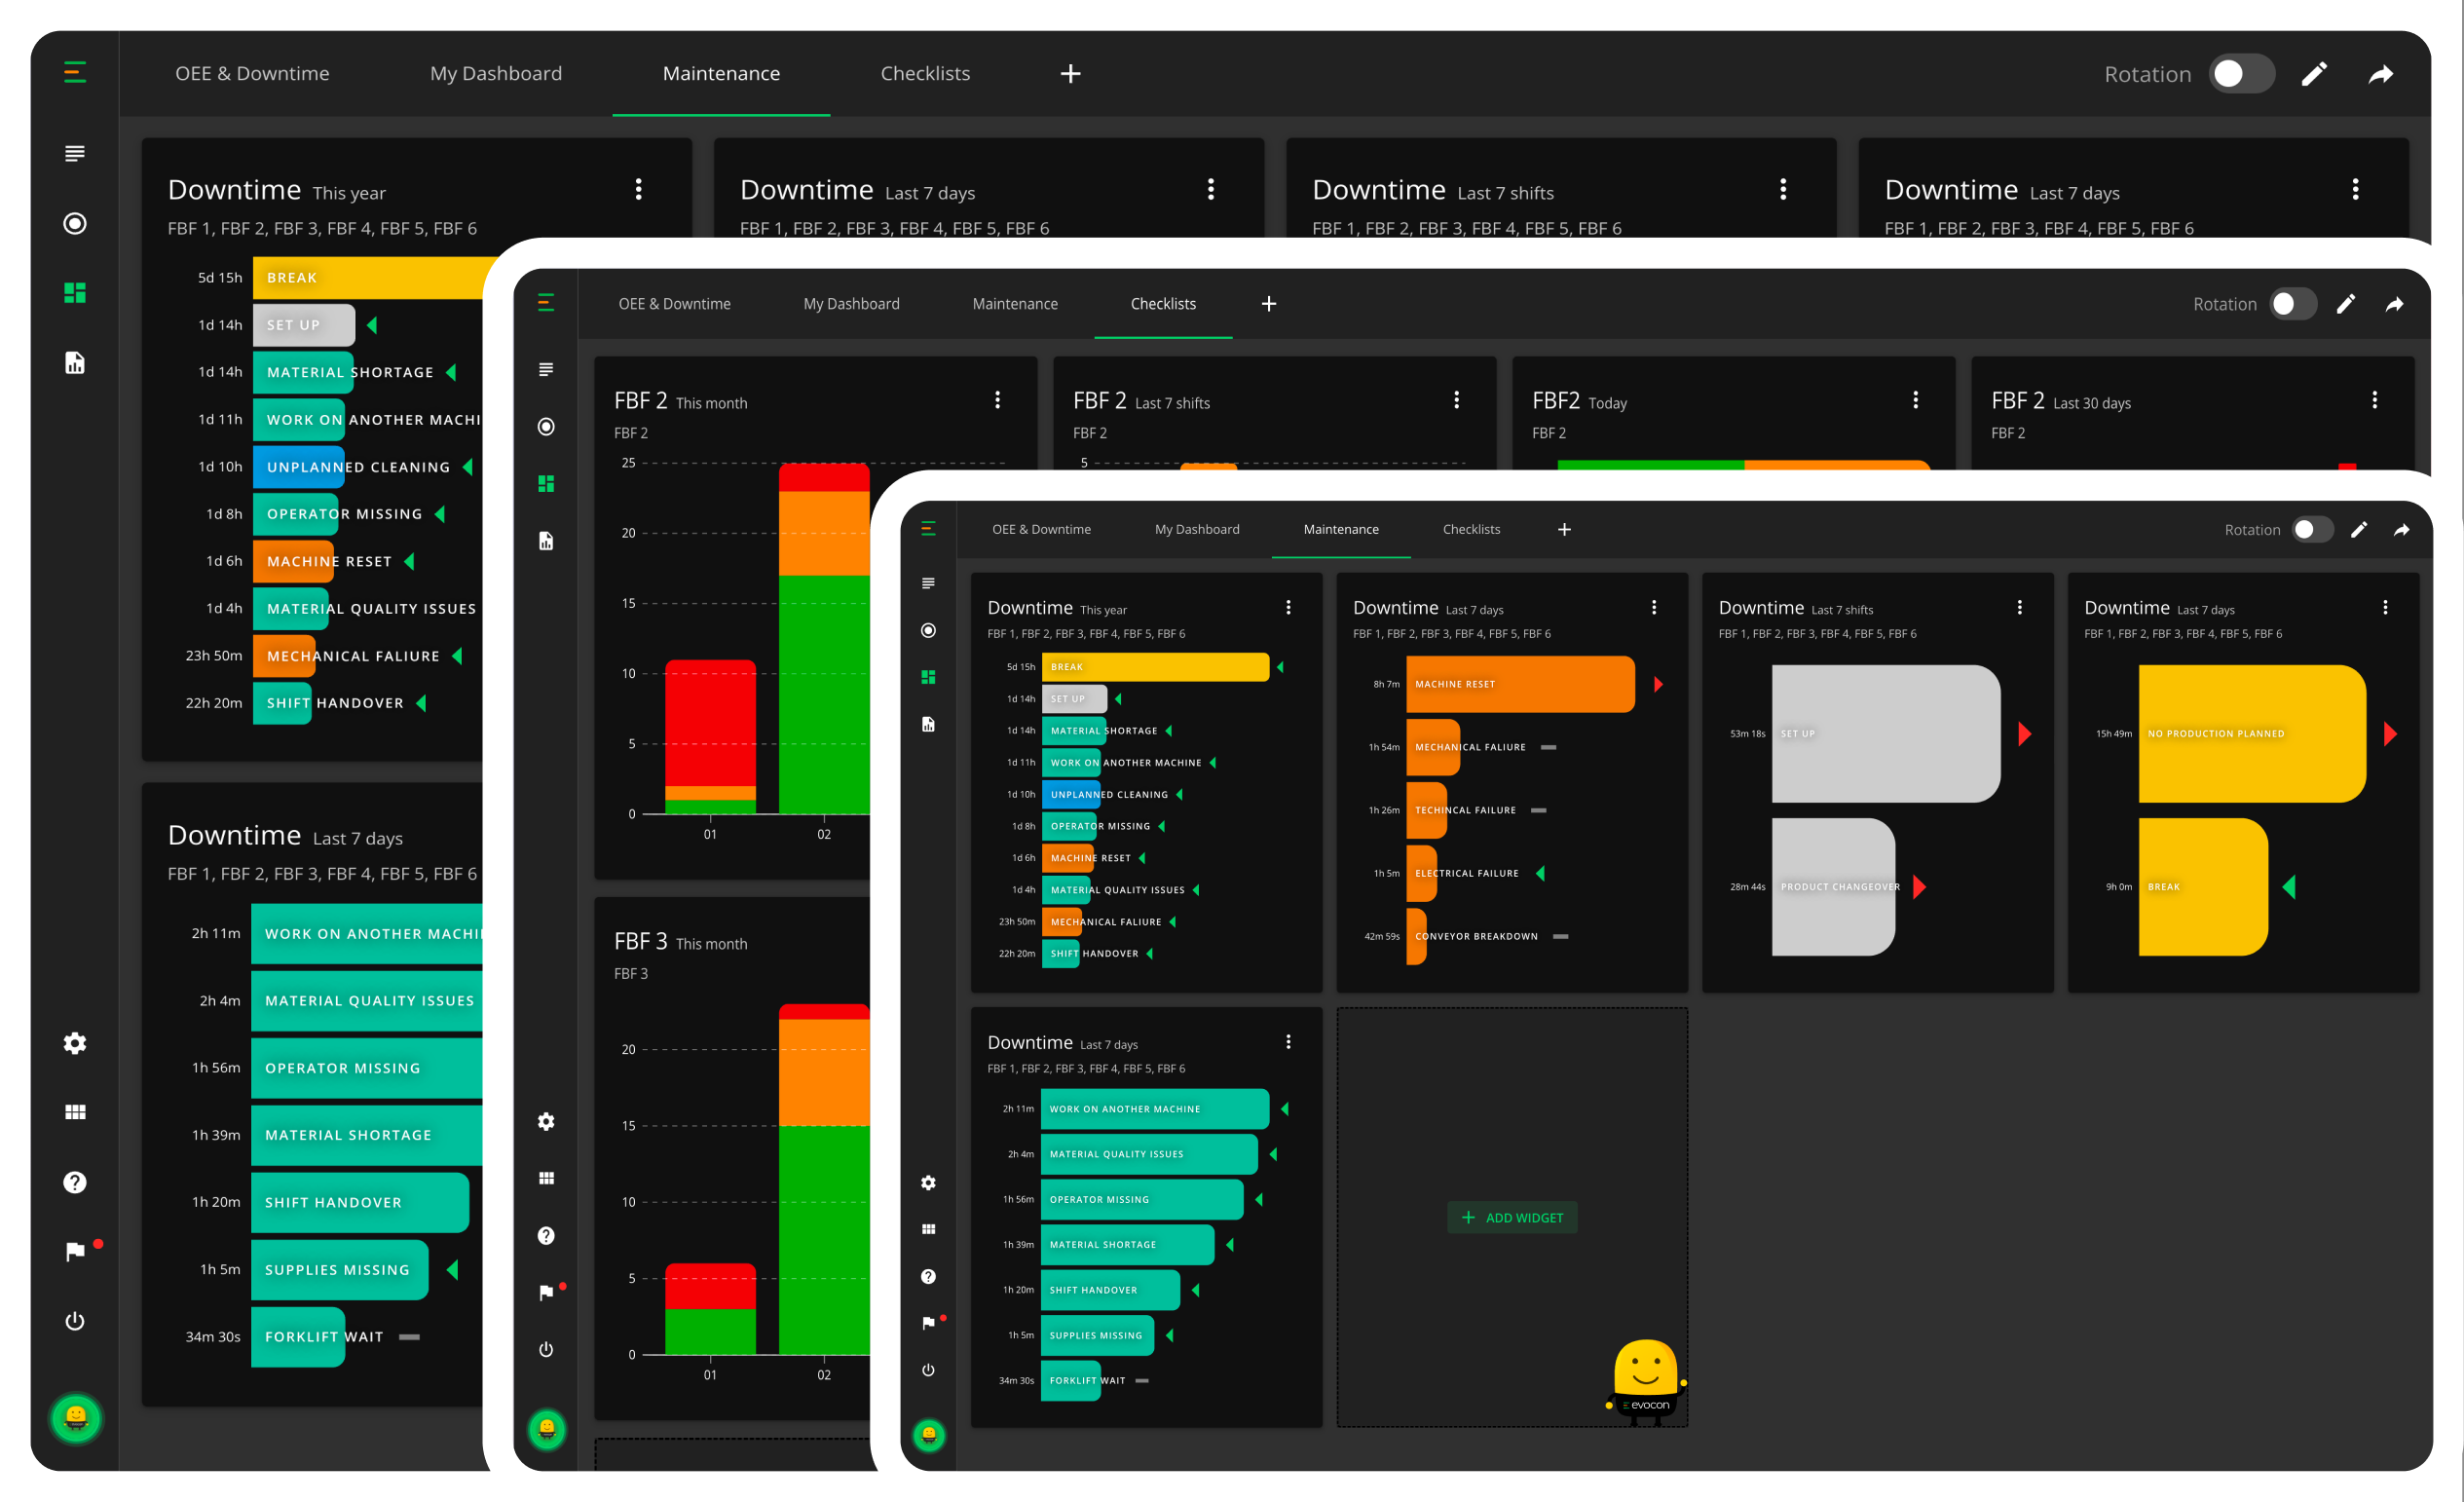
Empower every team member with a dashboard they can customize based on need. Whether it’s production, maintenance, or quality, each department gets tailored data to drive collaboration and improve factory-wide performance.
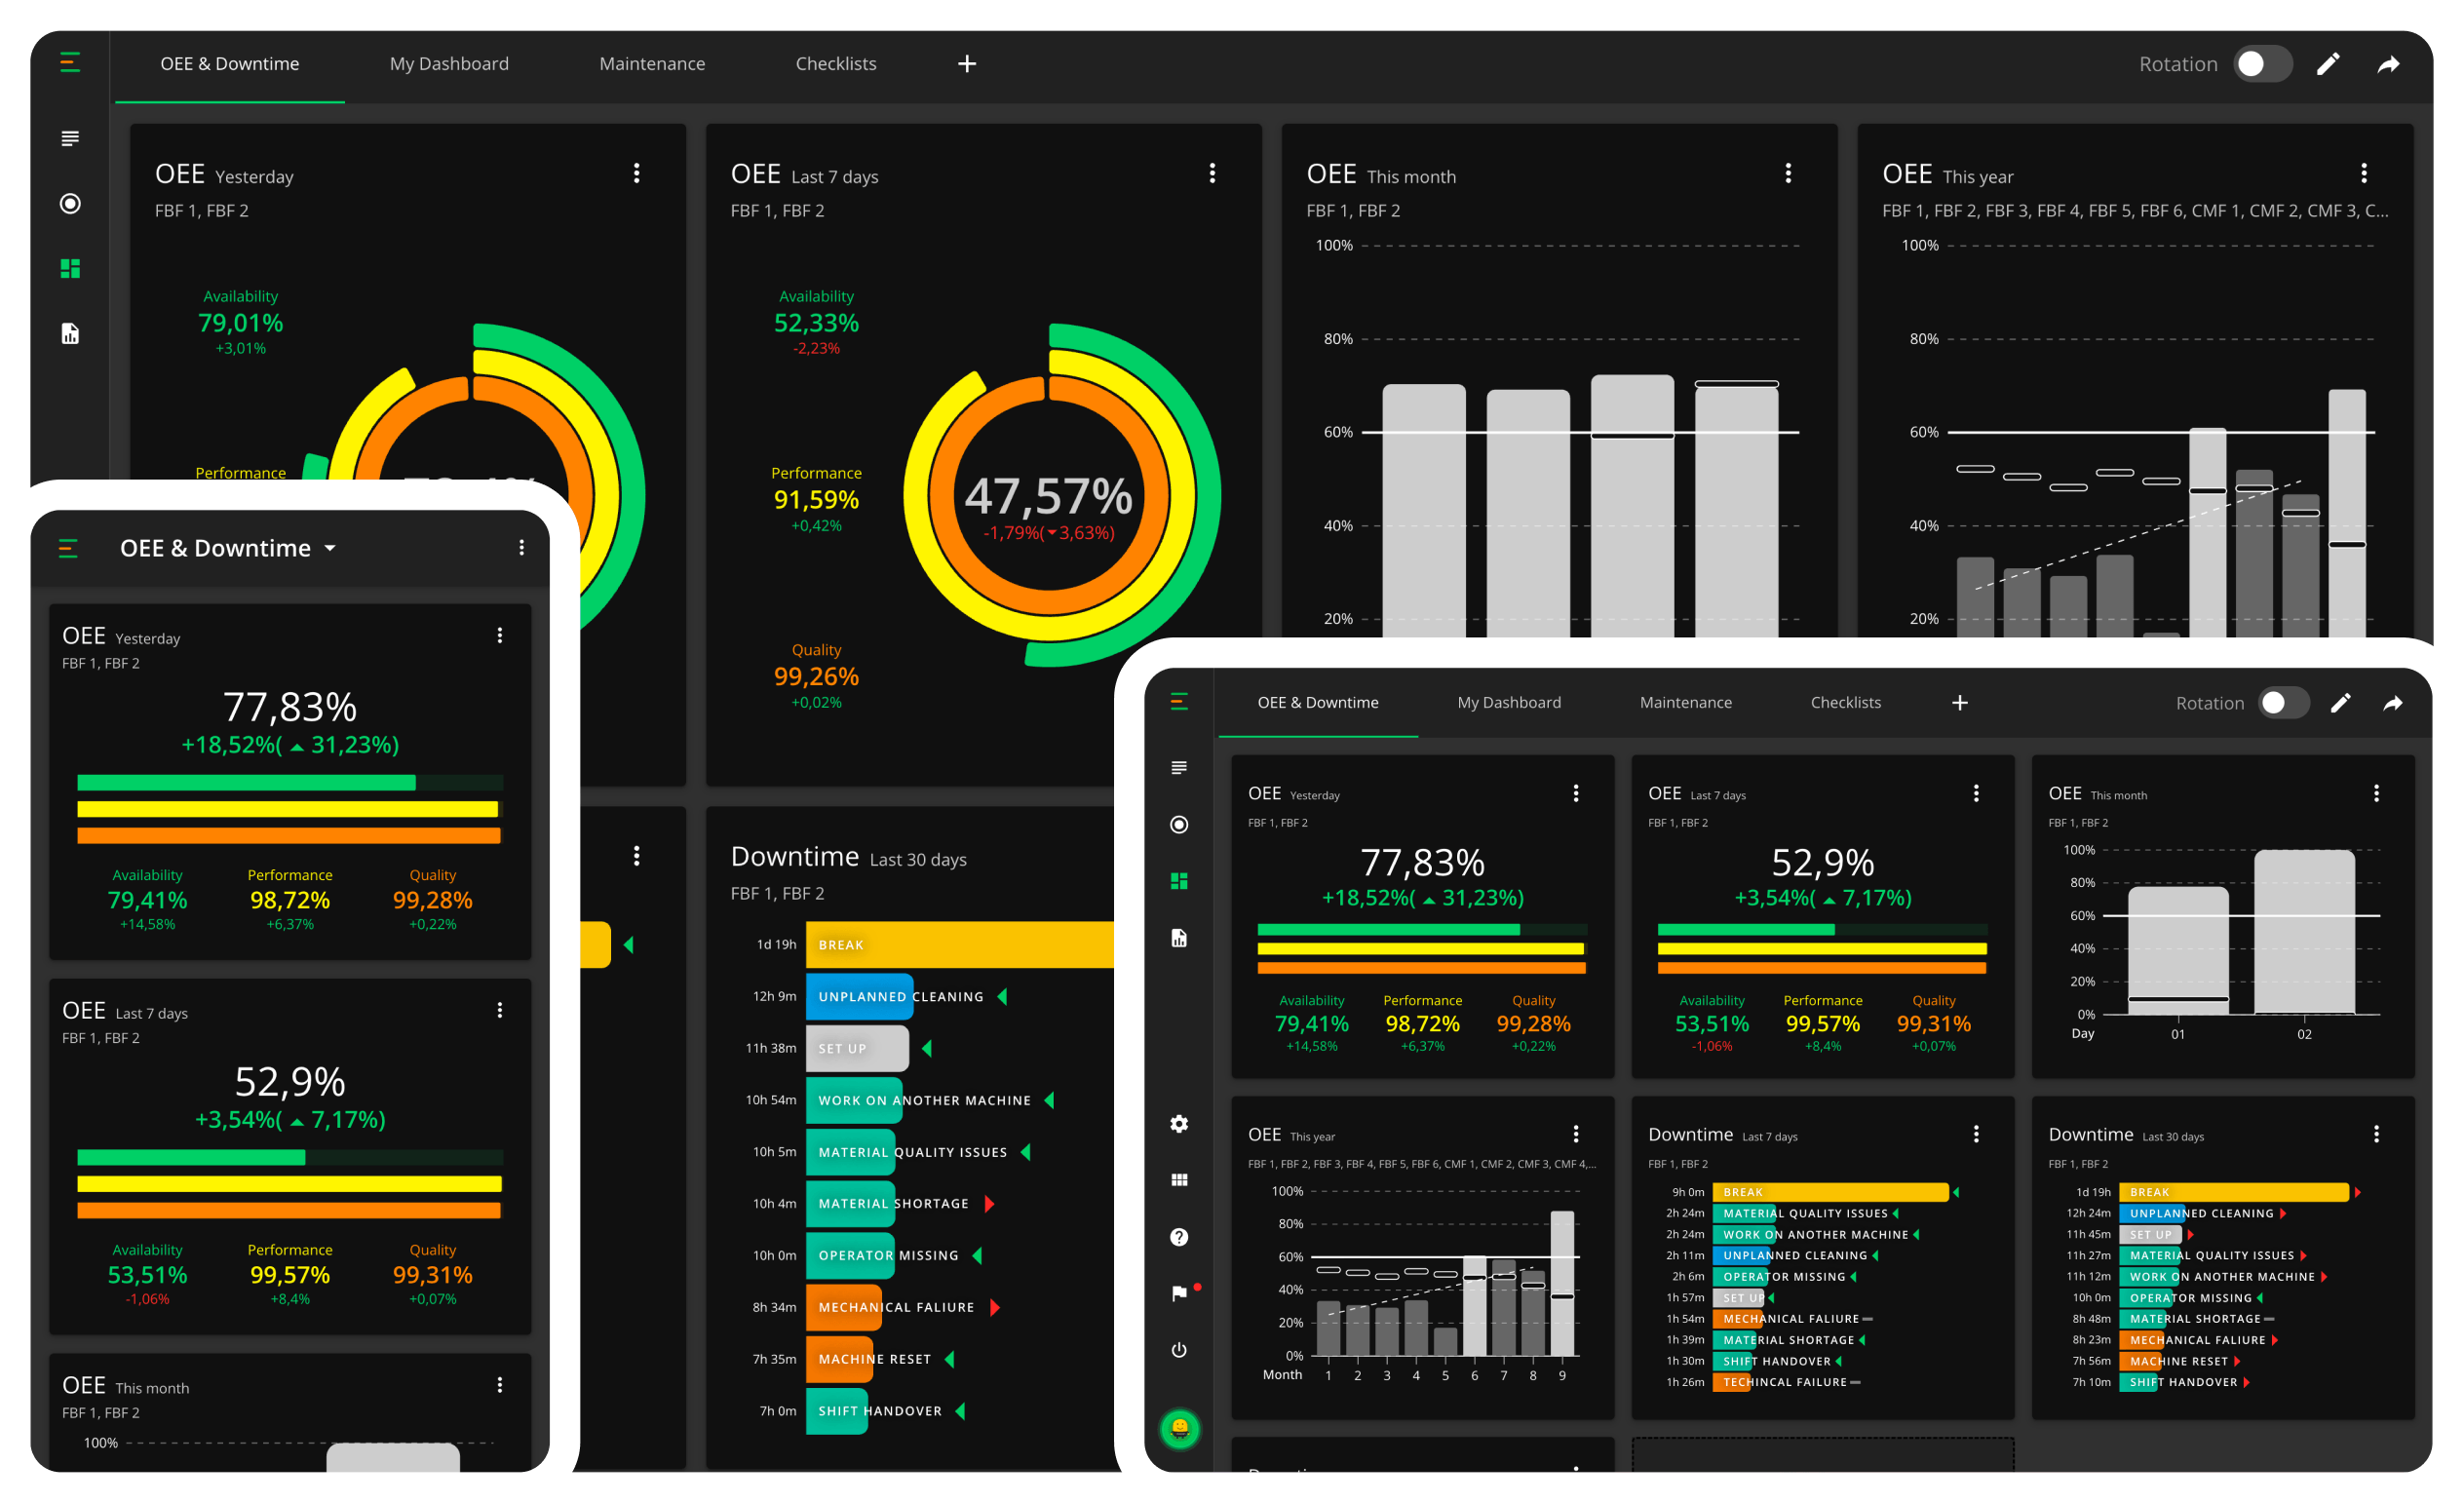
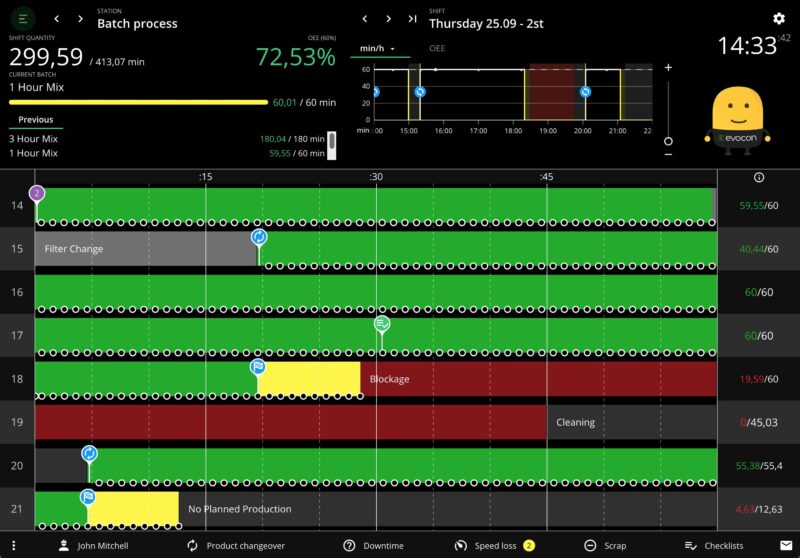
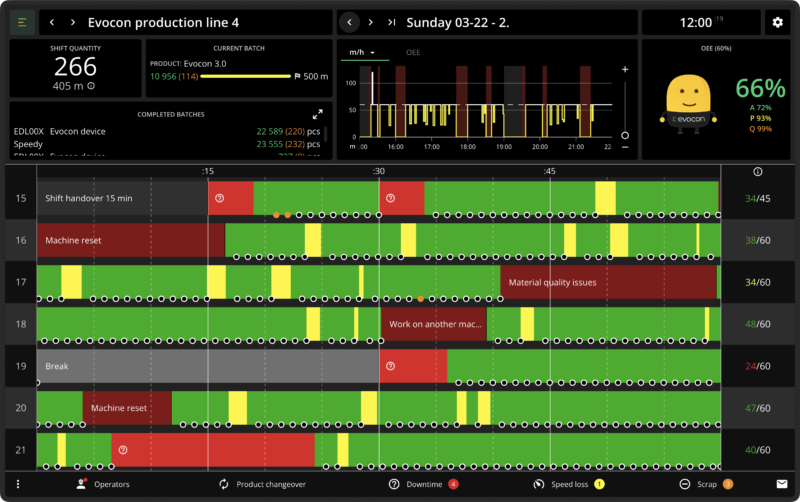
Your OEE dashboard runs in the browser on any device—live data follows you from the shop-floor tablet to your phone to the TV on the wall. Wherever a decision needs to be made, the numbers are already there.
"Evocon is at the heart of our daily follow-ups regarding production, and we also use it on a daily basis to cover the needs of maintenance and activity planning."

Lars Severin
World Class Manufacturing Coordinator
Saint-Gobain Weber Sweden
 Real-time data on all production losses
Comparison with previous time periods
Trend lines to help understand progress
Automatic tab rotation for always-on displays
Unlimited dashboards, tabs, and widgets per user
Different chart types for improved visualization
Performance analysis compared to target
Filter widgets by factory, station, time period, and reason
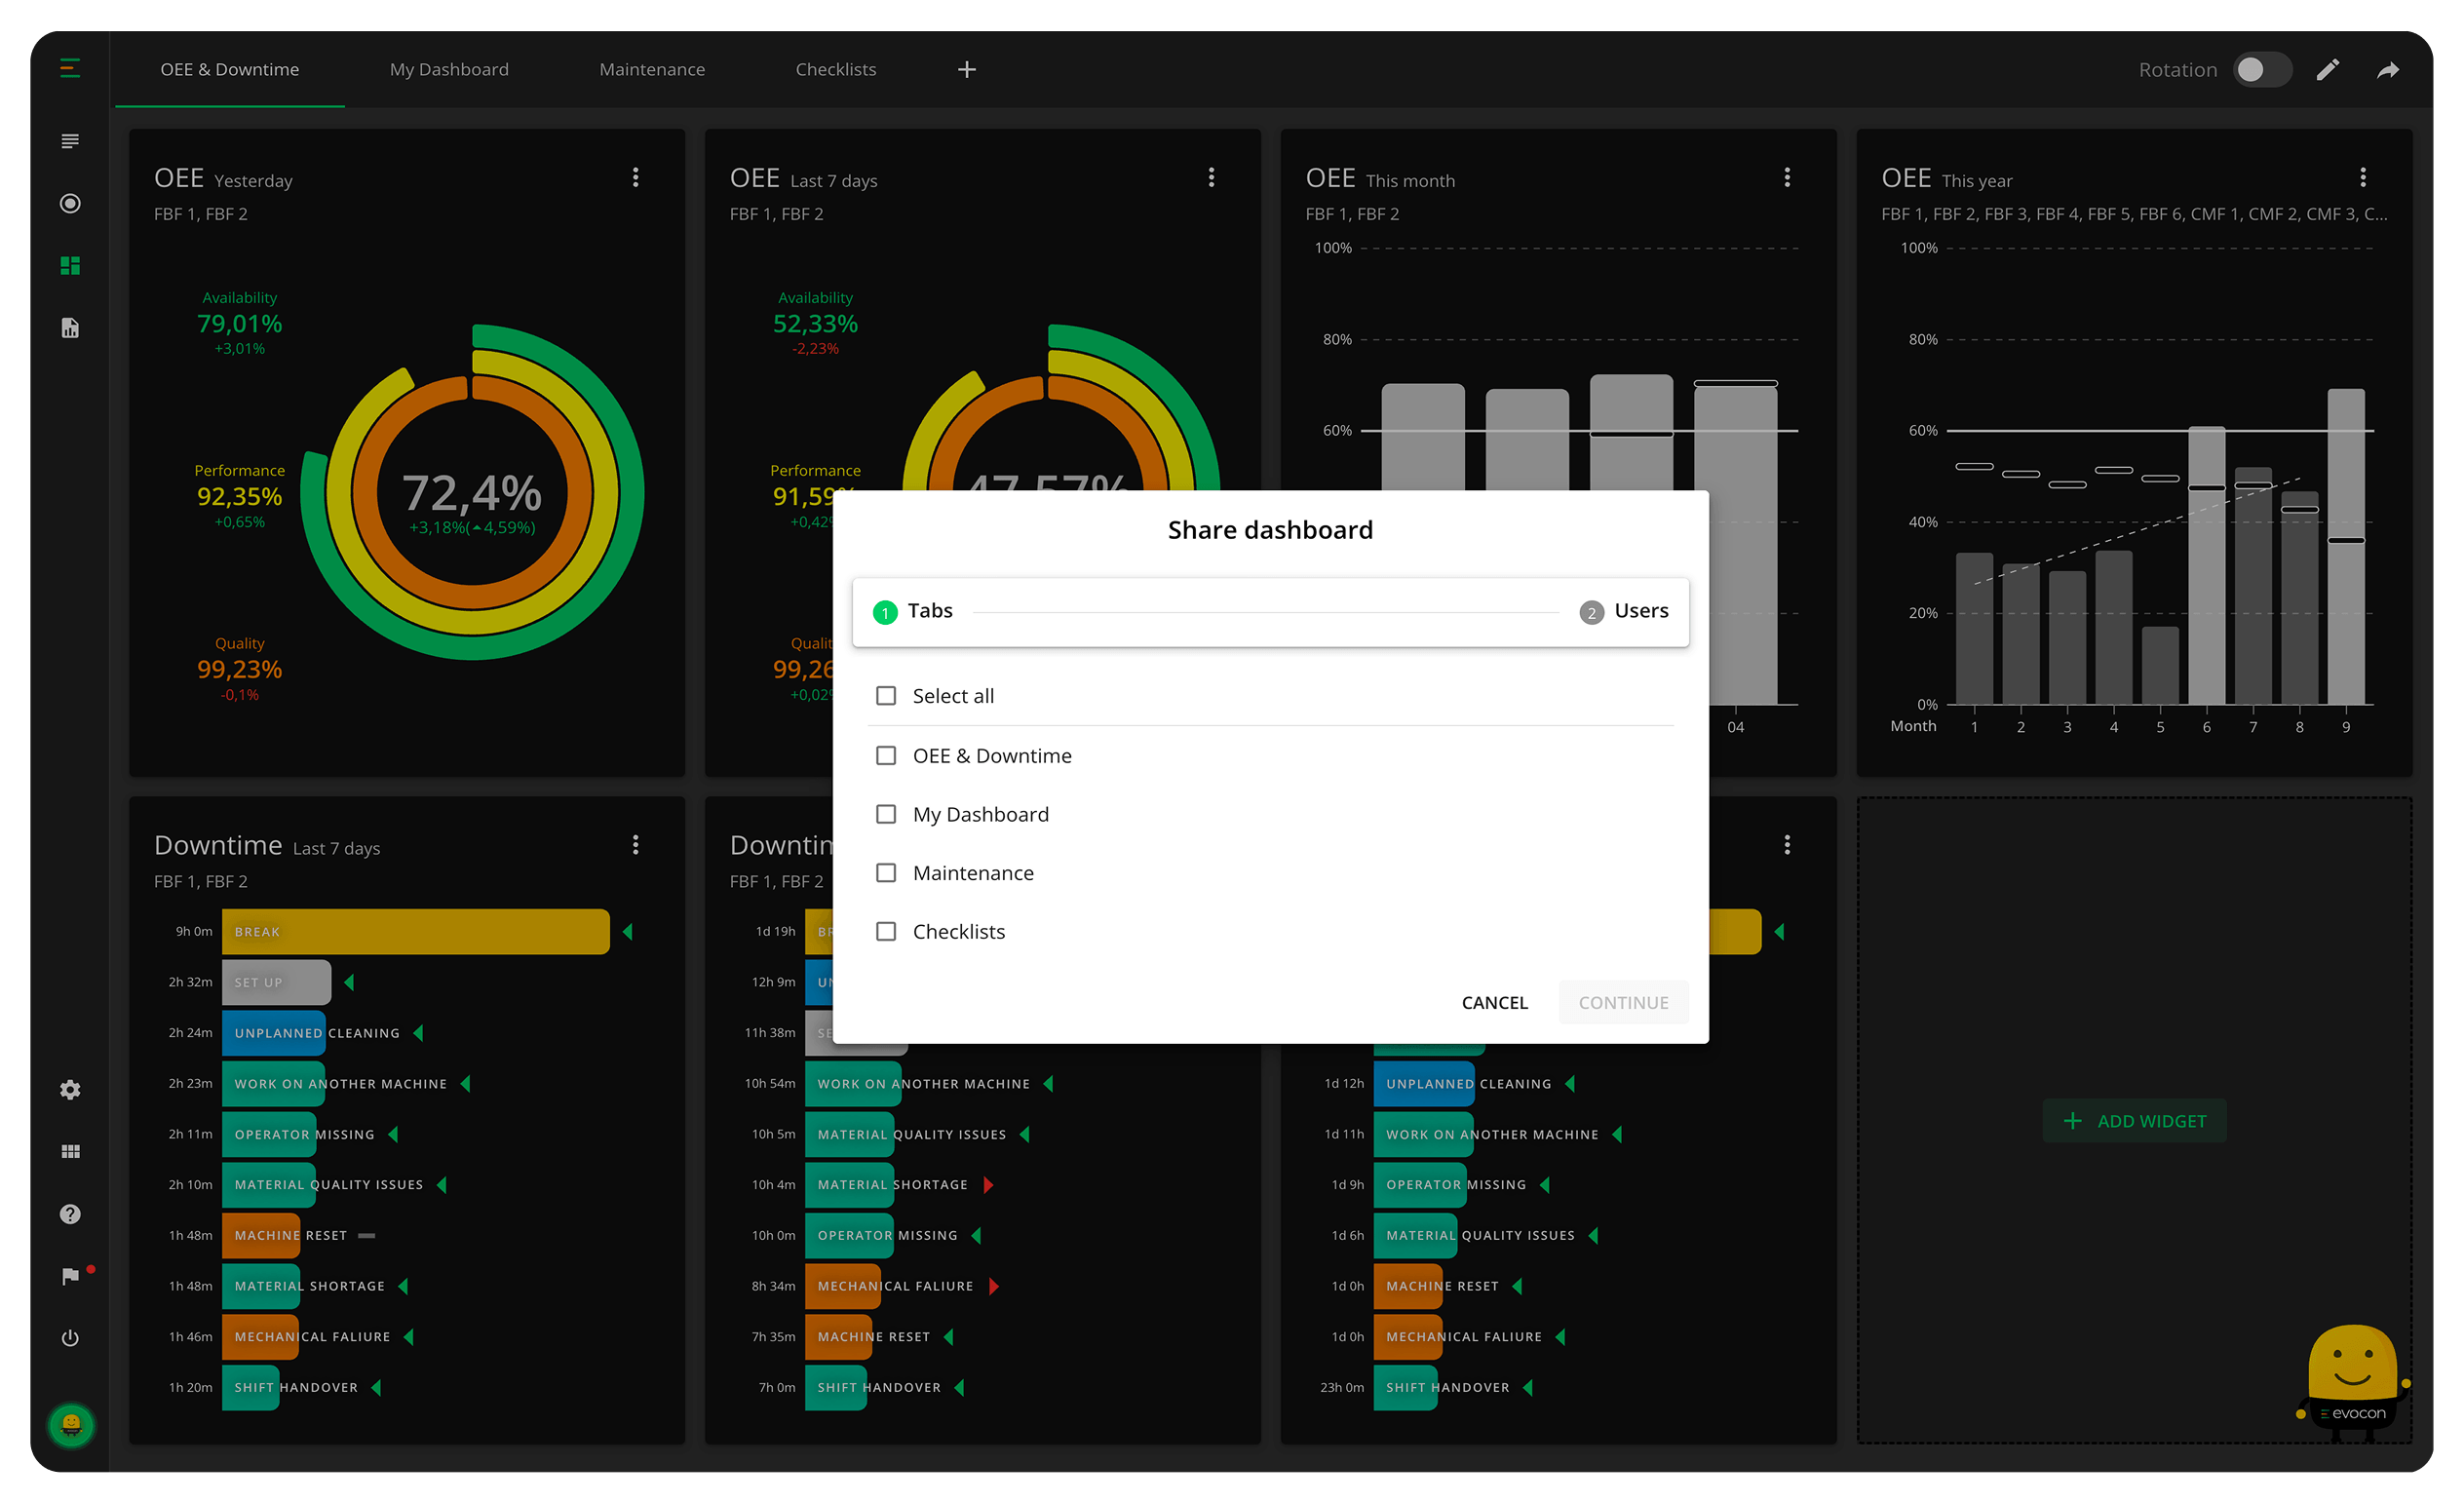
Sharing of dashboards
Works on any device with a browser
Time periods from the ongoing shift to the last 12 months
Checklist widgets with completion status and trends
Real-time data on all production losses
Comparison with previous time periods
Trend lines to help understand progress
Automatic tab rotation for always-on displays
Unlimited dashboards, tabs, and widgets per user
Different chart types for improved visualization
Performance analysis compared to target
Filter widgets by factory, station, time period, and reason
Sharing of dashboards
Works on any device with a browser
Time periods from the ongoing shift to the last 12 months
Checklist widgets with completion status and trends No financial commitment.
Start your improvement journey by trying out Evocon for free in your factory.
No financial commitment.