 Enterprise Package
  Integrations
  Security
  Hardware
 How Evocon Works
  OEE Monitoring
  Increasing Productivity
 OEE Calculator
  Evocon
  Join us
 Manufacturing companies have two options when it comes to monitoring OEE – a fully automated approach or one where operators manually add reasons for downtime into the system. While some managers believe in the former method, we spoke to Evocon’s partner and industry expert, Spiros Vamvakas, to make the case for the latter.
This article explores why obtaining stop reasons from operators leads to more benefits than relying solely on PLC data. We use an example of a bottling line for clarity, but the principle also applies to many other types of production.
The Two Main Problems with PLCs
There are two main problems when using input from machine PLCs to analyze downtime. First of all, it’s the cost of installation. Secondly, and even more importantly, the real reason for the downtime remains unknown.
To explain these points, we talked to Spiros Vamvakas, who has consulted more than 100 factories in the last four years, on OEE and downtime monitoring.
The cost of installation
Viktorija: From your experience, why is it so costly to use PLCs to capture downtime reasons?
Spiros: PLCs can effectively capture reasons for downtime if there is a breakdown in a single machine. However, it is not uncommon for multiple machines or factors to contribute to downtime. Manufacturers would need multiple PLCs installed across the production line. It’s a lengthy process that requires technical knowledge. Programming the system is highly complicated because of the many scenarios that are difficult to predict in advance. This programming can take months or years to calibrate when in operation. In contrast, it’s a straightforward process when operators enter stop reasons.
This is how I acquired the first customer for Evocon in Greece in 2019. A large factory was considering a PLC-based monitoring solution. I asked how long it would take them to run a demo. They said three to six months. I suggested trying Evocon instead; it would only take three minutes.
Knowing the real reason behind the downtime
Viktorija: You also say that the real reason remains unknown. Why?
Spiros: PLCs only know the reason for downtime in case of a breakdown. If a stop happens because of a changeover, material shortage, defective materials, or something else, then PLCS can’t identify the reason. The problem with that is that breakdowns only comprise a small part of downtime.
I have a perfect example, using a typical bottling line, to explain this issue. We’ll analyze the downtime using either PLCs or operators.
Viktorija: Let’s dive in, then.
An Example of a Bottling Line
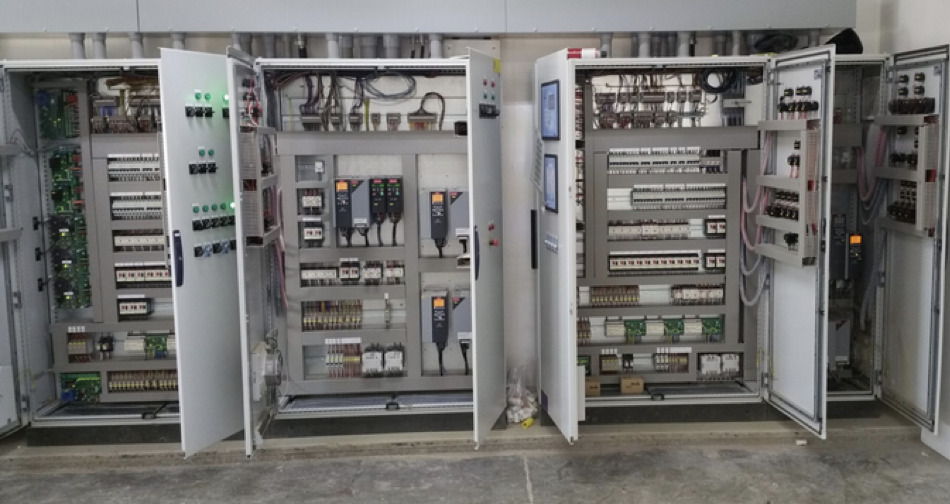
Here is an example of a medium to high complexity bottling line:
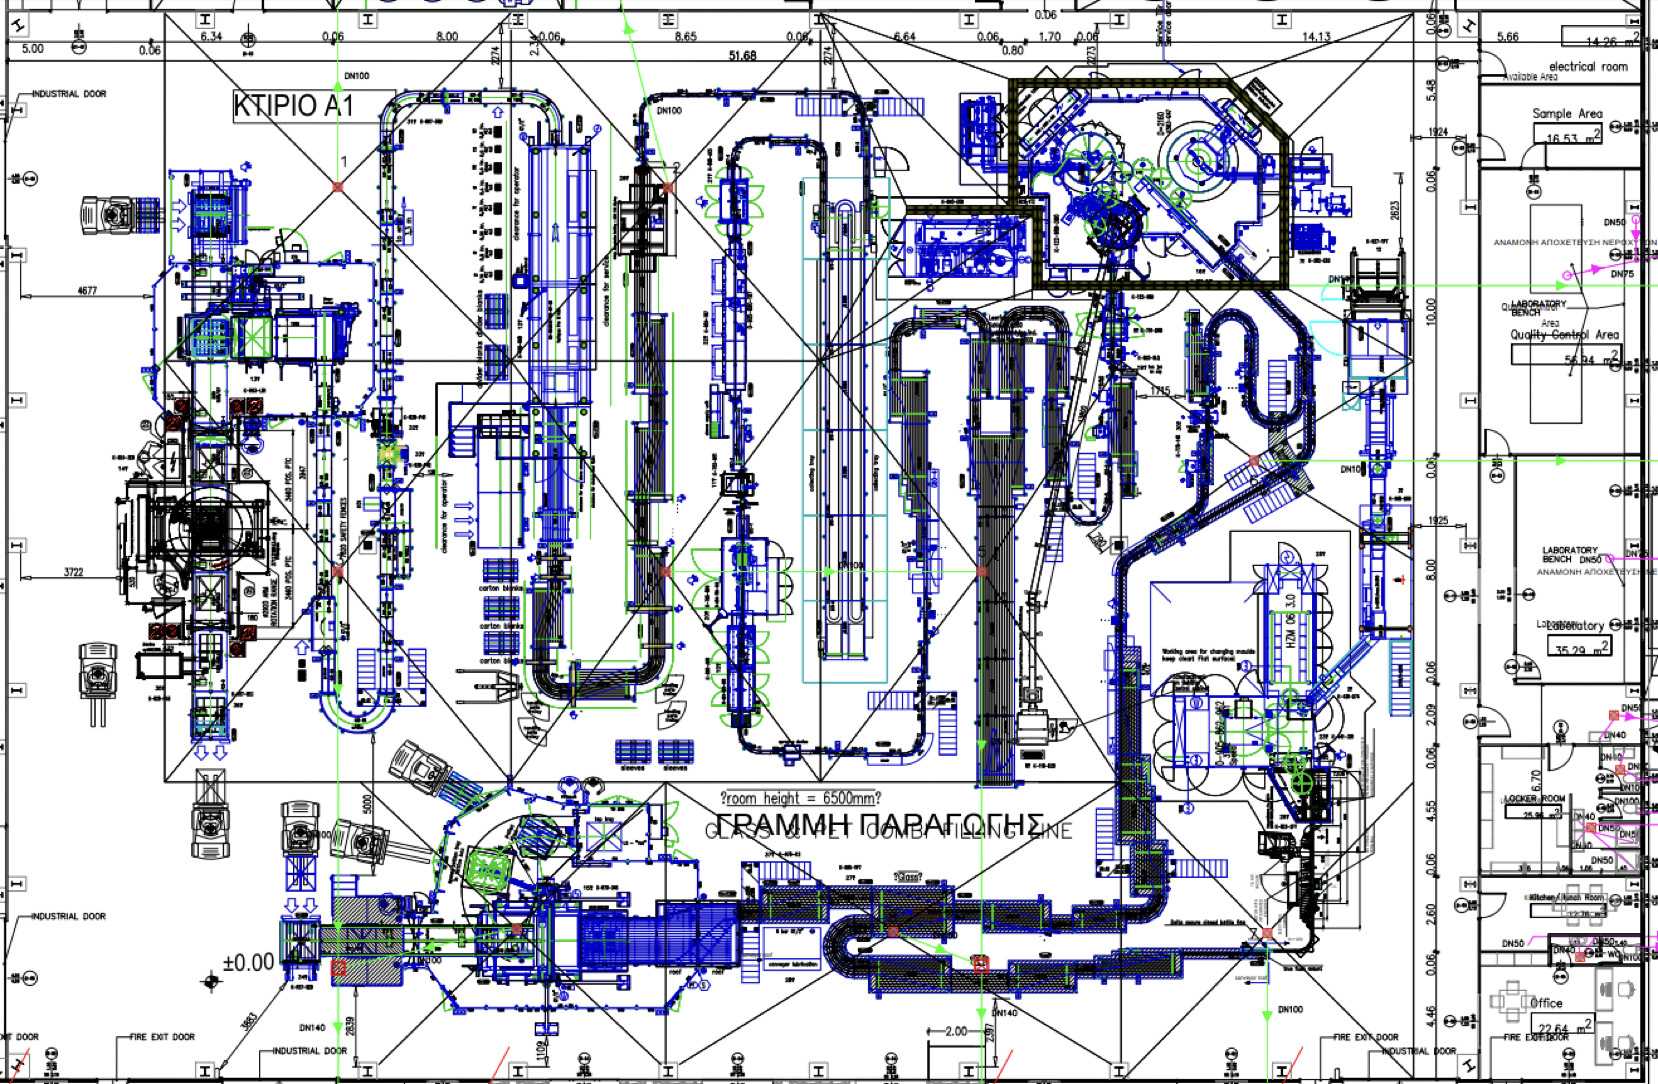
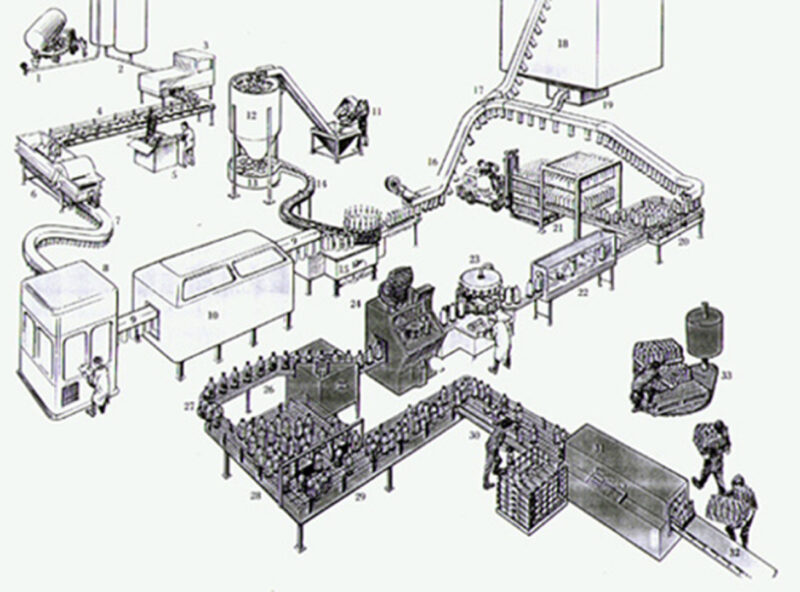
Each machine has specific parts that a PLC controls. In total, there are 60 PLCs. The heart of the line is the combination of filling and capping machines, marked below with the red circle. OEE is measured by automatically counting the bottles coming from the capper.
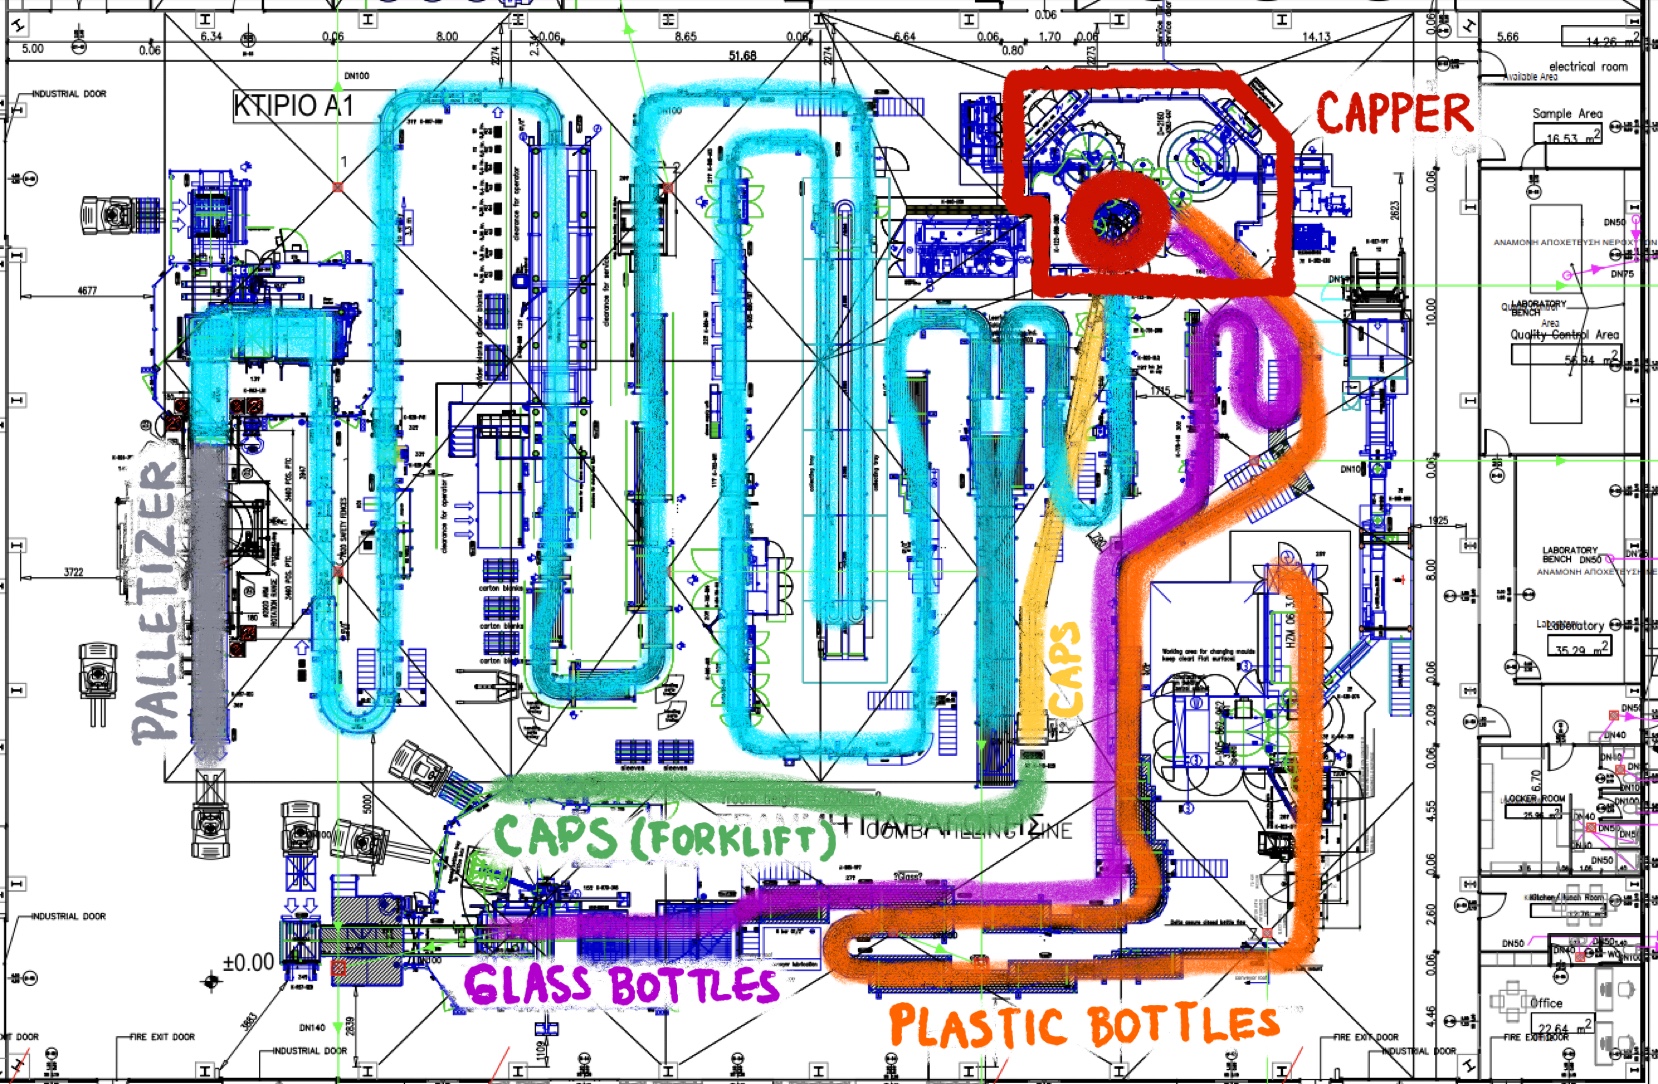
For the capper to work, several things need to work smoothly simultaneously. The raw material needs to be available in the filler, bottles need to be in transit (plastic bottles along the orange line or glass bottles along the purple line), the caps need to be fed into the capper (first by forklift truck along the green line, then on the conveyor along the yellow line), and the downstream equipment needs to function (blue conveyor line, grey palettizer).
When the capper stops, it could be because of one of these reasons:
- One of the downstream machines has stopped, and bottles have piled up
- The forklift is late to bring the caps, and the capper has run out of them
- The procurement department sent the wrong caps
- Either the plastic or glass bottles are of bad quality
- An operator detected a quality issue
- An operator is not in place
- It’s a stop that’s supposed to happen, and everything is fine
- Several other reasons.
Some of these reasons are impossible to know automatically by only using PLCs. Other reasons are possible to infer, but all the other machines need to be connected, their status needs to be checked all the time, and conditions need to be defined (when and which machines are supposed to be working and how to interpret their stoppages). You would also need to know how to translate the combination of working or standing machines into a specific reason for the stoppage of the whole line. Several weeks of developers’ time may be needed to build the entire network, with hardware and software.
So, when it is possible to determine the reason for the stoppage, it may not be worth the cost and time of installing such a solution.
How Much do Operators Tell You Compared to PLCs?
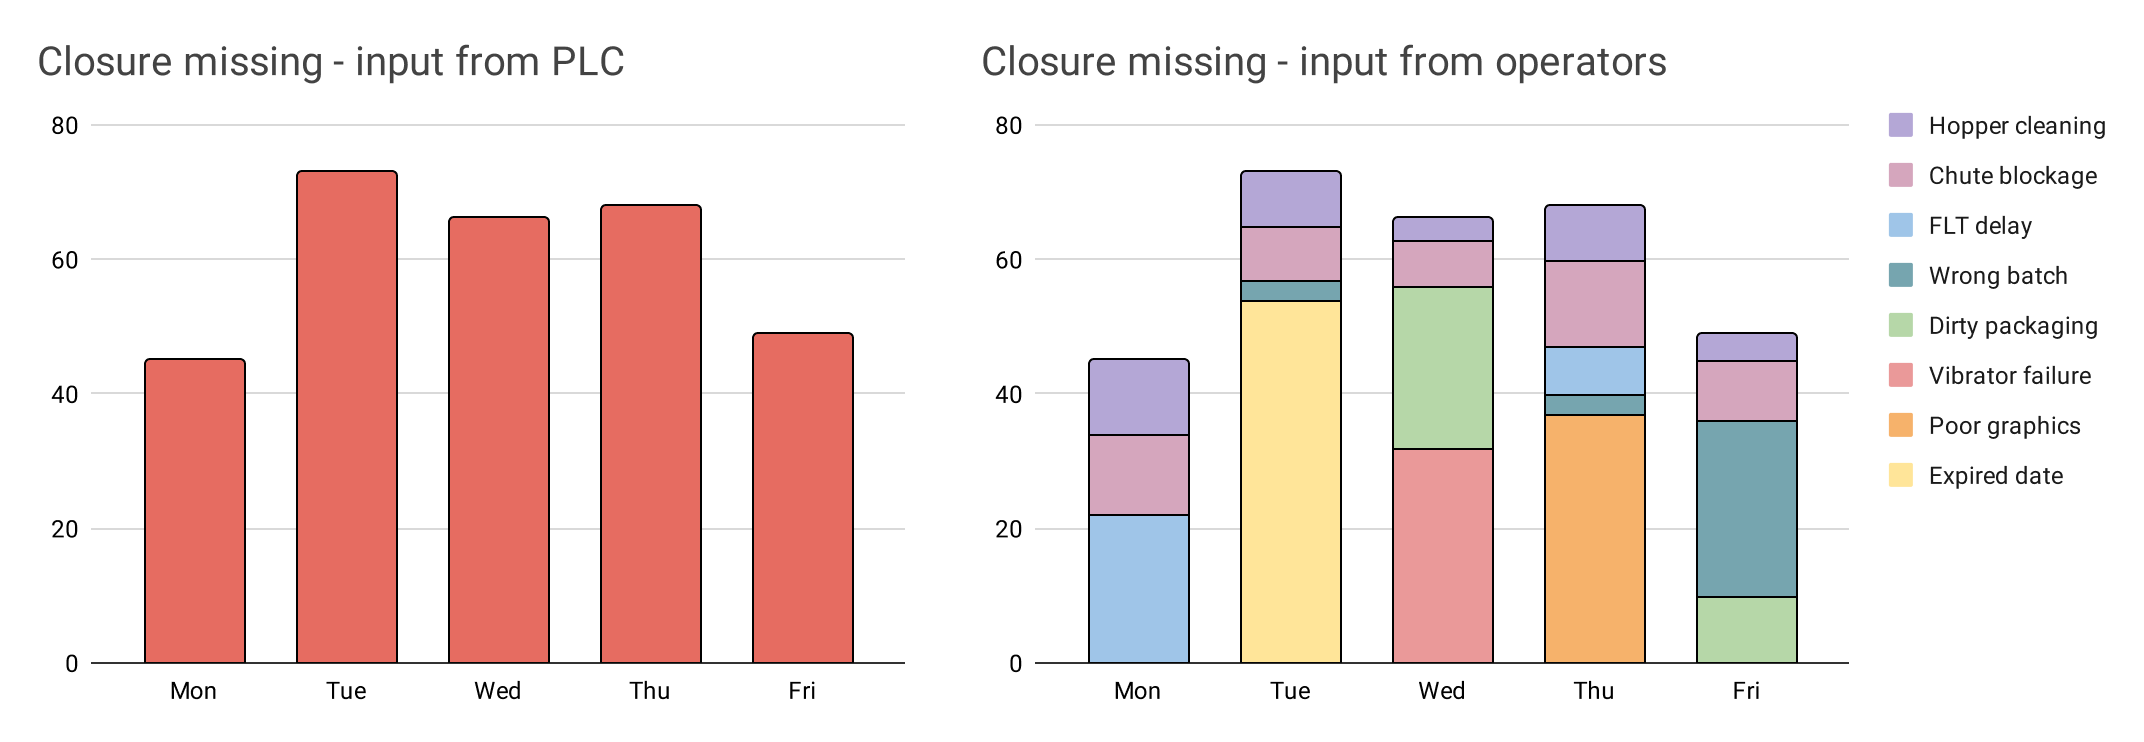
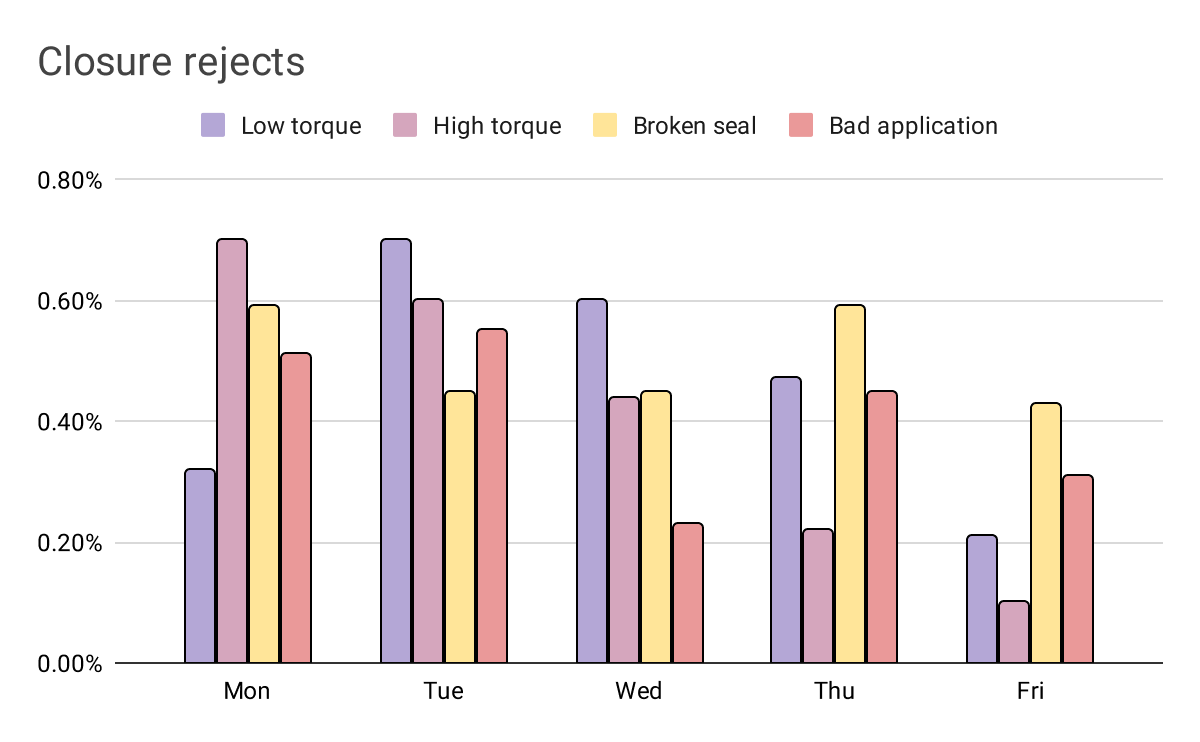
Let’s drive the point further while continuing with our bottling line example. Here is a comparison of how deeply you can analyze information collected from just PLCs or just from operators.
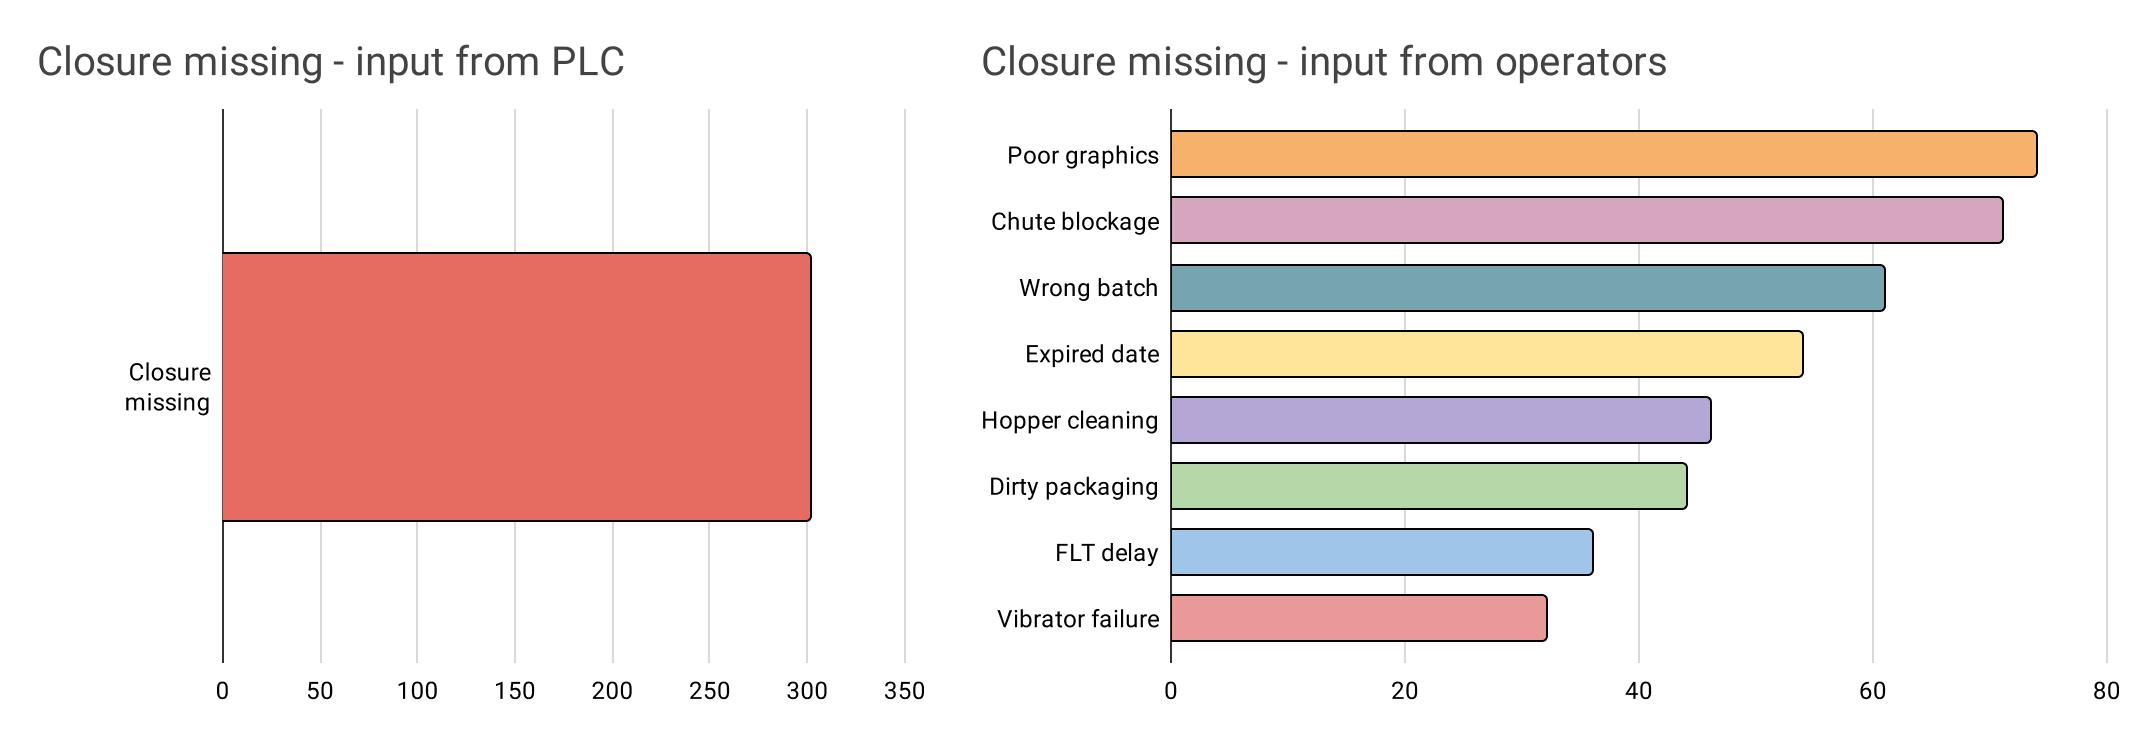
If you collect information from just PLCs, you will know that the caps were missing and how much time that cost you each day of the week (see left chart). But if your operators have been entering the reason for those missing caps, you will see something like the chart on the right side: a breakdown by exact reason for the missing caps.
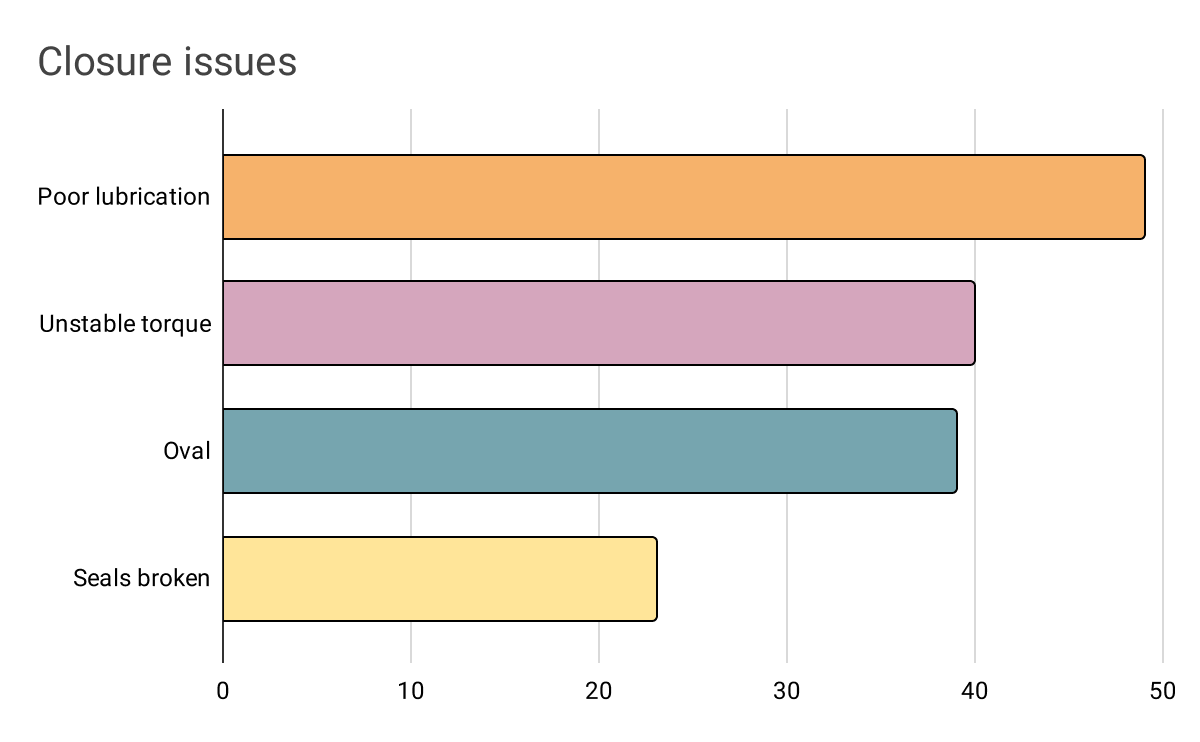
This breakdown can be further analyzed by sorting each reason by the size of its impact:
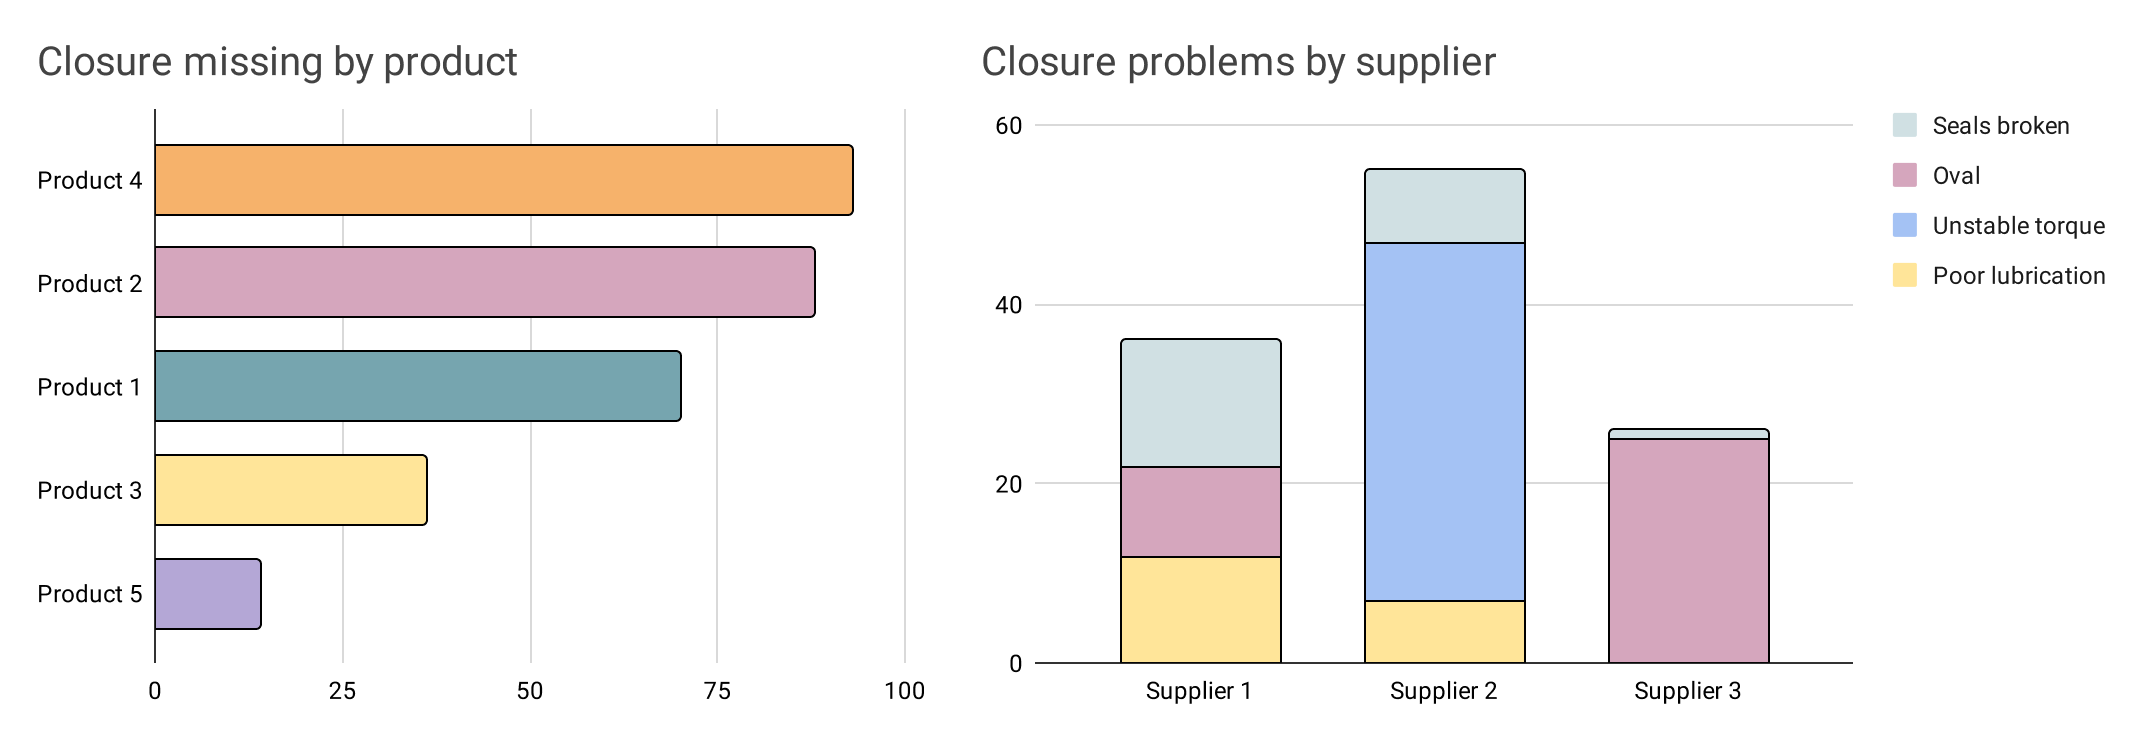
With the help of operators, any reason for a breakdown can be created. When operators mark changeovers, it becomes possible to see which type of cap is causing more problems. Similarly, operators could note down information about suppliers, making it possible to analyze which issues are more frequent for caps from certain suppliers:
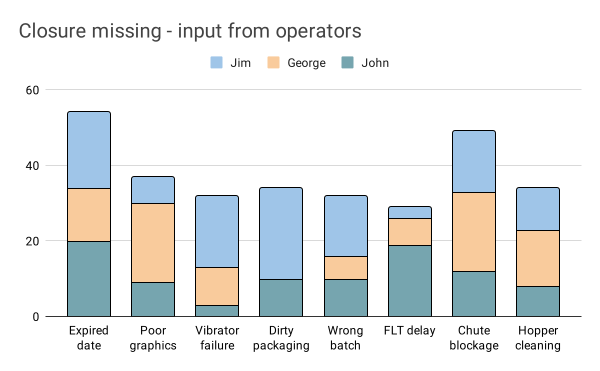
You could also analyze information by operator and stop reason to see if certain operators are marking specific reasons more than others:
Downtime Tracking Software
Equip your operators with the best tools and unlock key data for increased transparency and efficiency now. Free for 30 days.
Slow Speed or Micro-stops
Besides availability, another type of loss is performance. When lines run slow or have microstops, PLCs don’t detect it. A real-time production monitoring solution, however, can detect these issues. This allows operators to assign reasons for slow performance, making it possible to analyze speed loss. Like availability losses, speed loss can be broken down and sorted by impact.
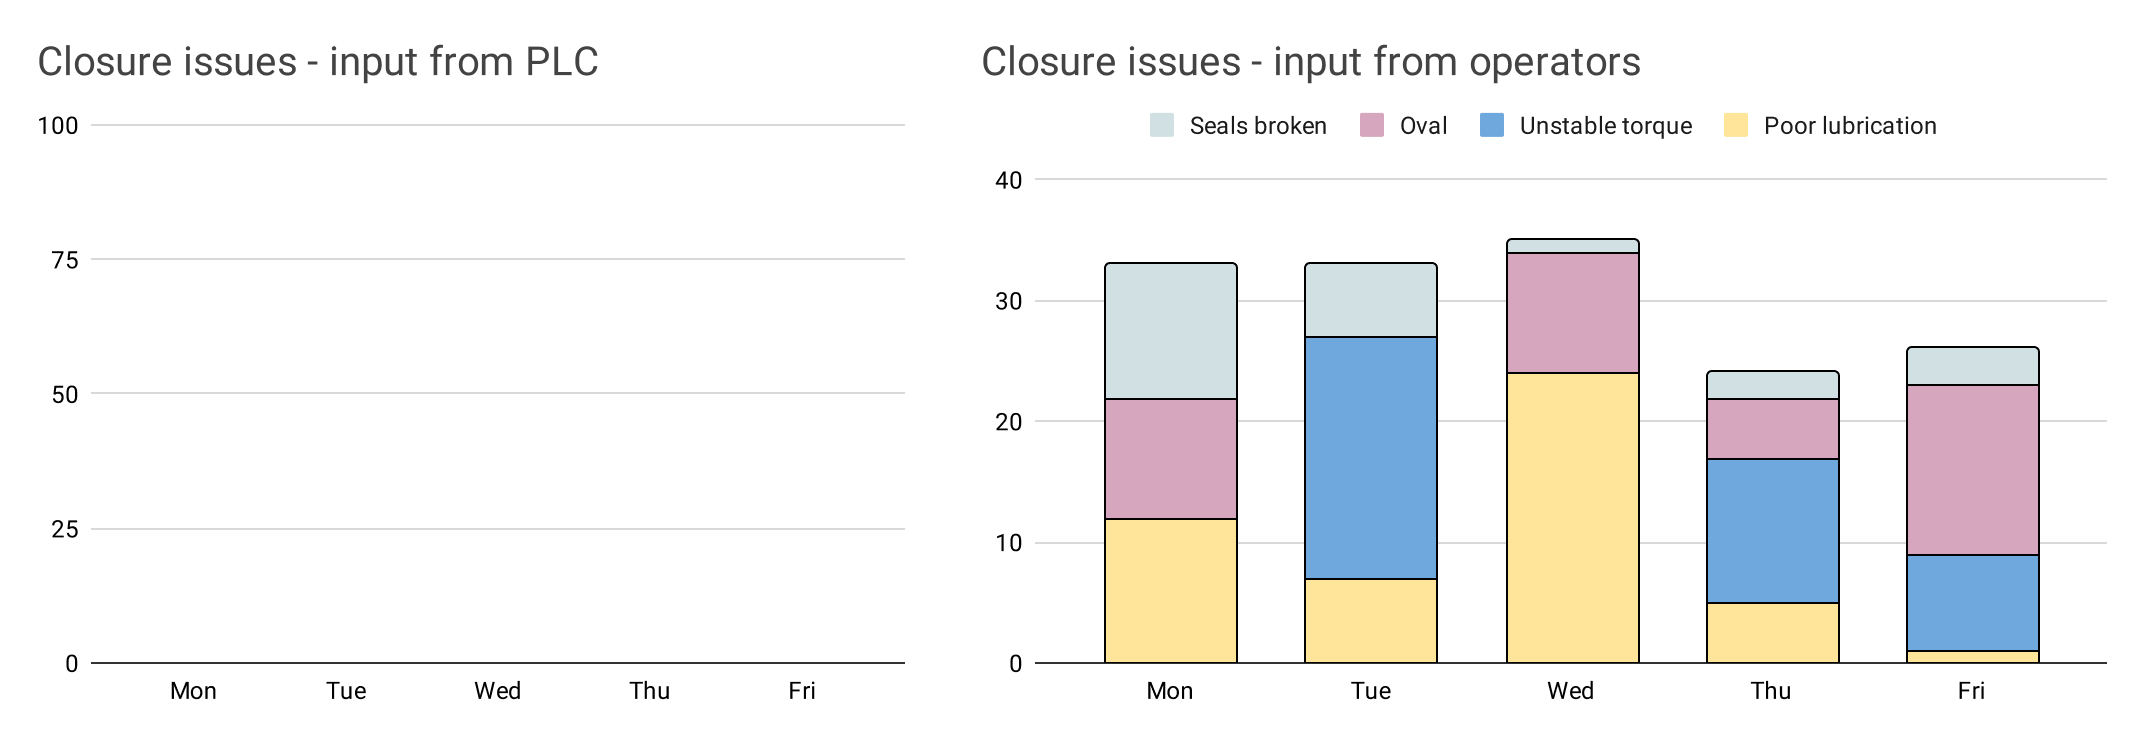
Quality Problems
Quality is another topic that PLCs can’t tell you about, but operators can.
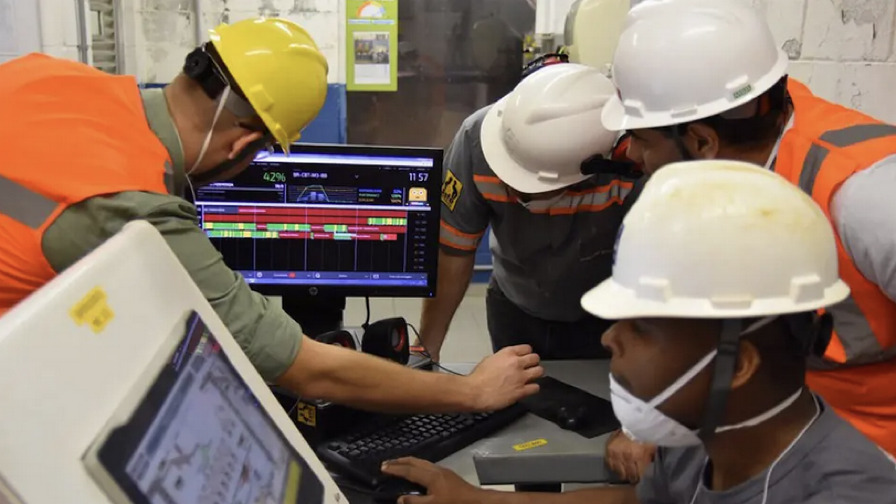
Setting Targets and Discussing Shifts with Operators
Here are a couple more examples of what operators can do that PLCs can’t. You can discuss the performance and problems of your lines with operators during shift reviews or weekly meetings.
Vs.
Your operators can also set out to achieve the targets you have given them.
Vs.

To Conclude
Viktorija: You have definitely made your case. Have you encountered any situations where PLCs were still a better solution than humans?
Spiros: Sometimes, making the case for operators doing it manually is harder. It depends on the culture of the company. When a company is already measuring downtime, even if it’s just with a pen and paper, then it understands the value of operator input. But sometimes there is no such culture, or perhaps operators are not trusted. But at the end of the day, the operators are the ones who know. I have a friend in Greece who is very fond of getting information from PLCs. I asked him: if your capper stops for one hour, how do you know the reason? He replied that he would go and ask the operator!