 Enterprise Package
  Integrations
  Security
  Hardware
 How Evocon Works
  OEE Monitoring
  Increasing Productivity
 OEE Calculator
  Evocon
  Join us
 Speed loss in manufacturing has not been getting as much attention as downtime. It is often underestimated in factories and overlooked by management due to its hidden and complicated nature. Recent research indicates that the effect of speed loss on OEE is at least 9-15%, but it is probably higher because of measurement difficulties and the tendency to set targets too low.
All of this means that there is an opportunity for improvement, and a significant part of it can be achieved at low cost, because you can reduce speed loss by reorganizing production lines, improving working practices or production scheduling.
What Is Speed Loss?
Speed loss presents itself in two categories: slow speed and micro stops.
- Slow speed is when machines or production lines run slower than the target run rate,
- and micro stops are when machines or production lines stop briefly and frequently.


In this article, speed loss is a synonym for performance loss, which is one of the three categories of OEE losses (all three being availability, performance, and quality).
Speed loss can be defined slightly differently depending on the source mentioning it. To bring in more clarity, let’s review those alternative definitions briefly.
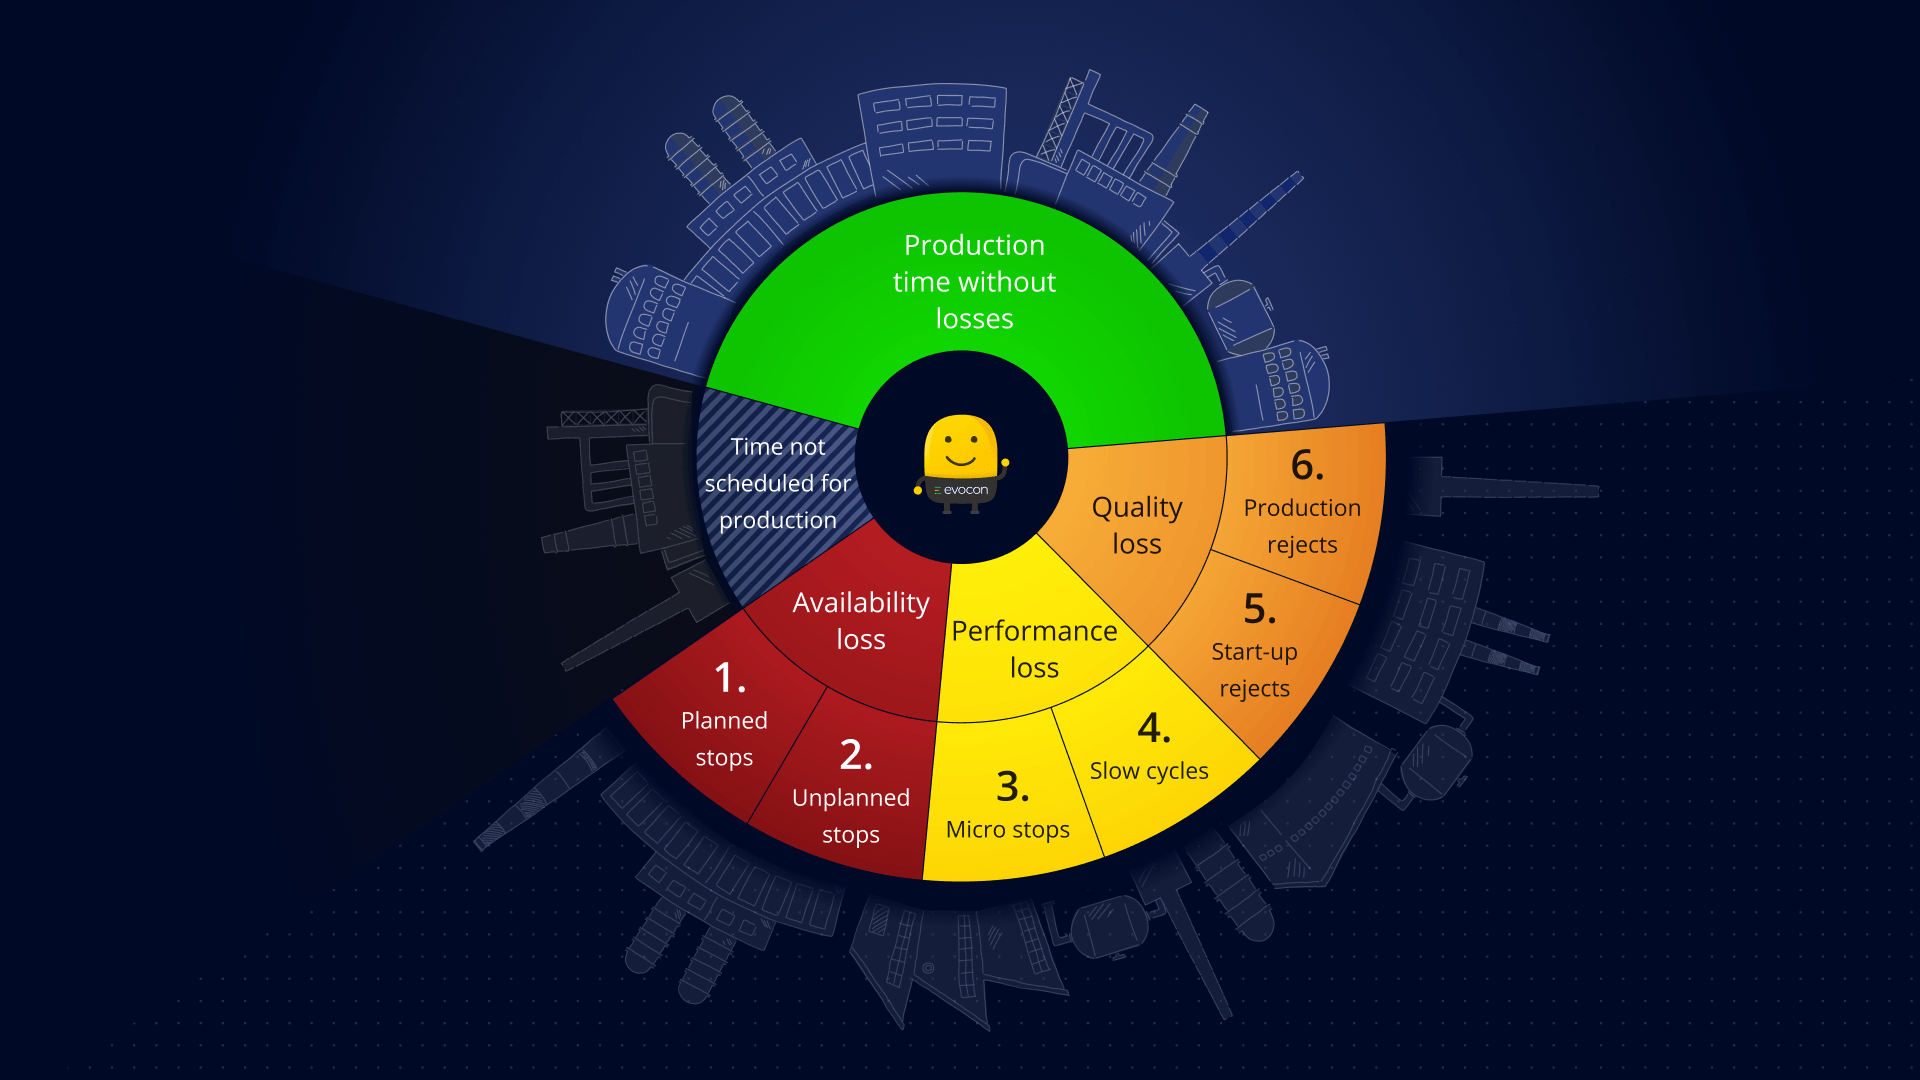
Performance loss in the Six Big Losses framework
The Six Big Losses framework is aligned with OEE loss categories. It has three main categories of losses, which are the same as OEE losses. Each category has two more sub-categories:
- Availability loss
- Planned stops
- Unplanned stops
- Performance loss (same as speed loss)
- Micro stops
- Slow cycles (same as slow speed)
- Quality loss
- Start-up rejects
- Production rejects
Learn more about performance loss, as described in the Six Big Losses article
Speed loss in Total Productive Maintenance (TPM)
Speed loss is also part of the TPM framework. The terms used are slightly different:
- Minor stoppages & idling (same as micro stops in the Six Big Losses framework)
- Speed loss, reduced speed (same as slow cycles in the Six Big Losses framework)
Learn more about Total Productive Maintenance
Why Are Micro Stops Classified as Speed Loss, and Not Downtime?
As we know, downtime is when a production line stops, and it is classified as availability loss. So, you may ask, if micro stops happen when the line stops, why are they not part of the downtime? Why are they classified as speed loss?
There are a few reasons:
- The reasons for micro stops overlap more with slow speed issues rather than downtime.
- The solutions applied to reduce micro stops are more similar to solutions for slow speed rather than downtime.
- Downtime is occasional and easily noticeable, and micro stops, just like slow speed, are chronic and hidden.
Examples of Micro Stop Reasons
Typical causes of micro stops are:
- Equipment misalignment, poor positioning
- Incorrect settings
- Blocked sensors
- Material miss-feeds and jams
- Equipment design issues
- Periodic quick cleaning

Typical Reasons for Slow Speed
The framework of slow speed factors, suggested by Trattner, A., Hvam, L. & Haug, A. in a 16 Dec 2019 article, can be divided into three categories.
1. Technology factors
- Reliability of technology (machine reliability, equipment wear, improper maintenance, production stops)
- Technology limitations (incapable equipment, equipment wear, queue capacity for work in process)
- Environmental limitations
2. Human factors
- Operator inefficiency (i.e., due to lack of training)
- Measurement error
- Planning issues (ideal cycle time set too low or target too unambitious, production scheduling, capacity utilization issues)
3. Product factors
- Material availability
- Material quality (could also be due to natural process variation or raw material mix)
- Product variety
- Product quality (quality of finished goods)
Start visualizing speed losses
Start measuring and optimizing your speed losses with Evocon’s 30 day free trial.
The Impact of Speed Loss on OEE
“Running at slower speed can silently reduce the capacity of production lines, impacting service levels in capacity-constrained situations and eroding efficiencies in situations of surplus capacity. […] PE varies from 54 to 100% across the nine studies while speed efficiency ranges from 85 to 91% in the two studies, which explicitly calculate it.“
The above research indicates that almost half of performance efficiency (PE) can be lost due to micro stops and speed loss, and between 9 and 15% is lost due to slow speed alone.
Furthermore, manufacturers often set speed targets too low, which leads to performance efficiency to exceed 100% mark – something that should not happen if targets are set correctly. This is a widespread issue among our clients, suggesting that the actual speed loss is often bigger than officially recorded.
How to Measure and Analyze Speed Loss
When you want to assess speed loss, you need to compare your actual speed to the maximum speed of your machine or line. Manufacturers have a few options when it comes to setting the maximum:
- Theoretical maximum speed
This is the speed that could theoretically be achieved if the machine was running at its highest possible speed under ideal conditions. In reality, however, conditions aren’t ideal, so it would be very difficult to run at theoretical maximum speed. - Nameplate capacity (NPC) or Design speed
This is what the manufacturer of the equipment defines to be the maximum speed.
NPC is usually lower than the theoretical maximum speed. Suppliers often provide a more realistic number in order to meet customers’ expectations or to cover deviations. Therefore you may discover that your machines run faster than specified by the manufacturer, and your measured performance exceeds 100%. - Ideal cycle time
Cycle time in manufacturing is simply a different way to define the speed. For example, if the speed of a machine is 6 products per minute, then it’s cycle time is 10 seconds per 1 product.
Ideal cycle time is the term used in Evocon when defining the maximum speed in the settings for the calculation of performance. It can be based either on theoretical maximum speed, or NPC.
So, when determining your ideal cycle time, what do you base it on, theoretical maximum speed or NPC?
How to choose your maximum speed when calculating OEE and estimating speed loss
In the ideal world, you would use the theoretical maximum speed as a basis for calculating OEE and speed loss. This makes sense when you focus on exposing as much speed loss as possible because the theoretical maximum speed is the fastest speed among all the speed definitions that we discussed.
However, manufacturers are cautious about setting such a high target because it could pressure staff into increasing the speed at the expense of product quality or equipment wear. Therefore, factories set a slightly lower maximum speed. It is an exercise in finding the balance between exposing as much of your hidden loss as possible, while not sacrificing other aspects of your production.
This is the moment when digital champions and lean specialists should educate the shop floor about the benefits of setting a higher maximum speed while balancing out the other OEE factors.
Let’s look at an example. A digital label press printer is able to run at 50 meters per minute – that is its theoretical maximum speed. The nameplate capacity, NPC of the printer, is 30 m/min. An operator manages to run the printer at 45 m/min but notices that the quality becomes unacceptable. At 30 m/min, quality is good, but the machine could still run faster without too much quality loss. After some experimentation, the operator decides that 35 m/min is the maximum speed, at which quality is still just about acceptable, but the machine should never run faster than that. So, he uses 35 m/min in his OEE software settings.
So, you may have to choose something between the theoretical maximum speed and NPC.
What if you don’t know the theoretical maximum speed or the NPC of your machine?
When you don’t know the theoretical maximum speed, or if your machine’s supplier hasn’t provided the nameplate capacity, you will need to figure out the maximum speed for yourself.
If you are monitoring your machine automatically, you can do it by finding out the maximum demonstrated rate (MDR) based on collected data. If you’re not, you will need to break out the stopwatch and head to the shop floor.
Let’s look at an example, using Evocon’s Cycle Time Chart.
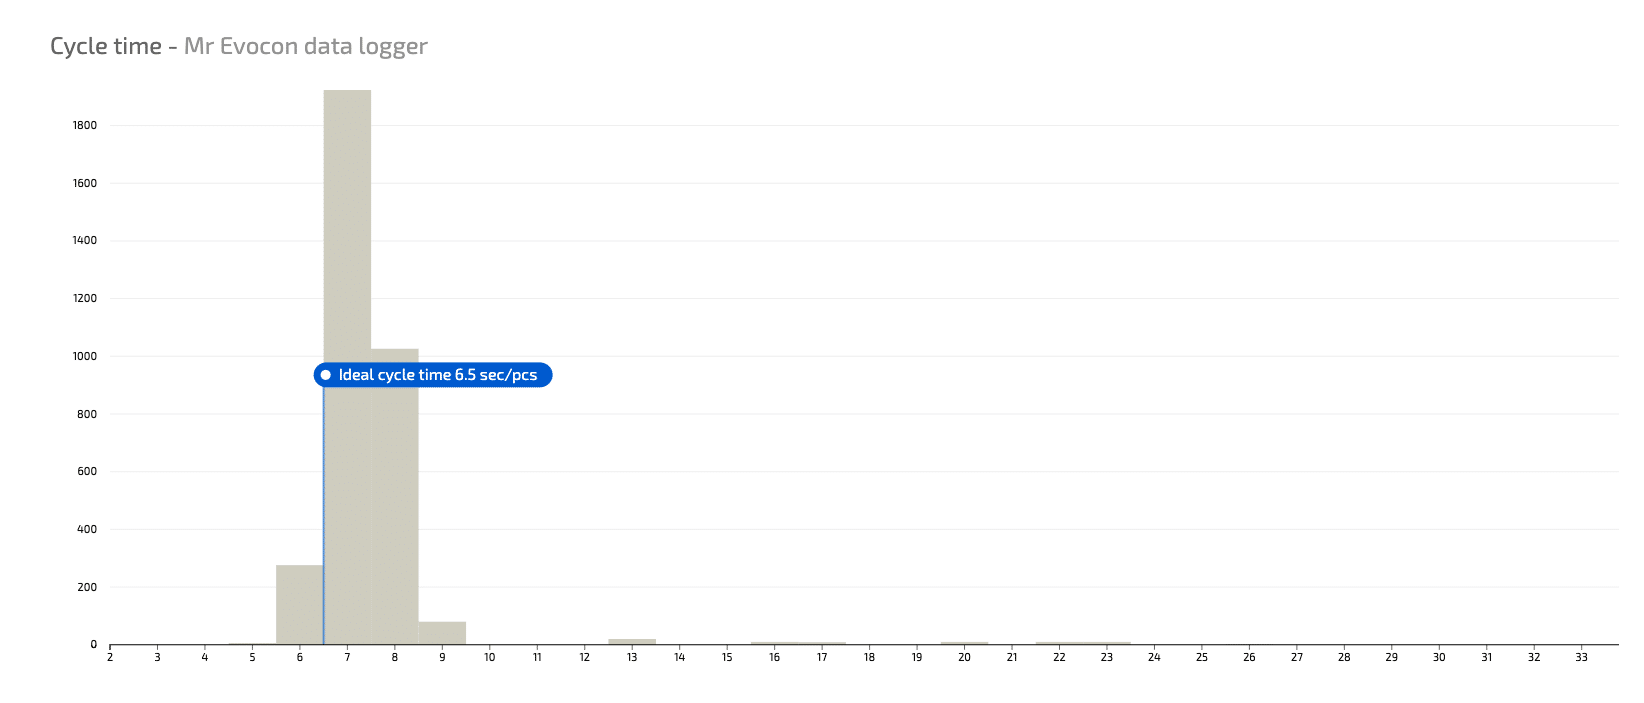
This chart shows all recorded cycle times of a machine. The X-axis represents the duration of cycle times in seconds, and the Y-axis shows how frequently those cycle times occur. As you can see, cycle times vary between 6 and 9 seconds, with 7 seconds being the most frequent cycle time.
We can see that our customer has chosen 6.5 seconds as the ideal cycle time. Why not 6? The reason for that, in this case, is that cycle times of 6 seconds are considered to be anomalies. That could happen, for example, if the machine stops and restarts with the part already in place, therefore the first cycle time is shorter than normal.
Note: even if you do know the theoretical maximum speed or NPC, you may still use historical data to adjust your ideal cycle time to fit your needs better.
What if your performance (OEE component) is higher than 100%?
Because of the way the performance component of OEE is calculated, performance should never exceed 100%. If your performance is higher than 100%, it means that your machine is running faster than your maximum speed. Usually, the reason for that is that the maximum speed in your OEE software settings is too low (or ideal cycle time is too long).
The solution is to adjust the maximum speed using your machine’s monitoring data, which is explained in the chapter above.
Here’s an example using Evocon Cycle Times Chart once again.
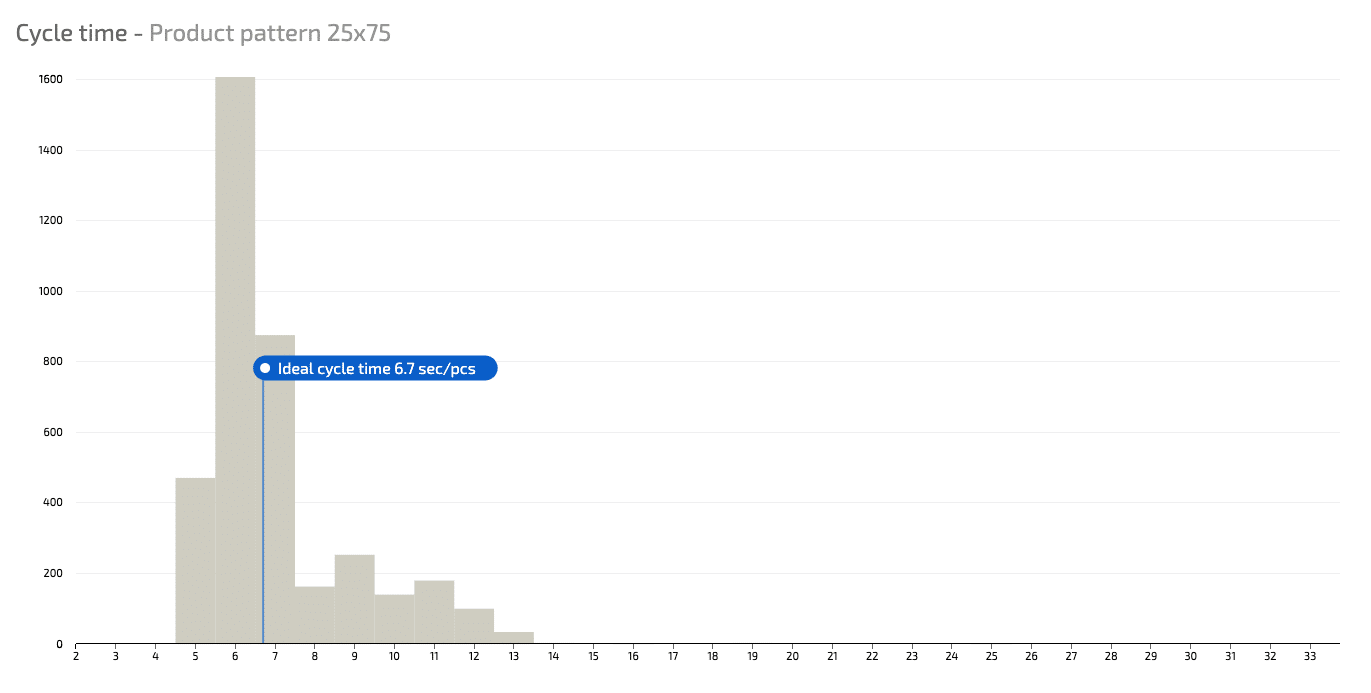
This chart, like the one above, shows all recorded cycle times of a machine. The X-axis represents the duration of cycle times in seconds, and the Y-axis shows how frequently those cycle times occur.
This customer of ours had set ideal cycle time at 6.7 seconds, and their performance was frequently more than 100%. The chart demonstrated that machines were capable of consistently running faster. In this case, the maximum speed is definitely too low and needs to be set higher.
How to distinguish between slow speed and micro stops when measuring speed loss?
Not every OEE tracking system distinguishes between slow speed and micro stops. Usually, systems track both together and report as one number, the Performance Efficiency. The reasons are:
- the difficulty of identifying which speed issues are slow speed and which are micro stops,
- and the lack of demand for it due to insufficient education about speed loss.
However, manufacturers are starting to realize the benefits of tracking and visualizing slow speed and micro stops separately.
For example, an operator at a filling line runs the line slower intentionally in summer, because liquids tend to splash more at warmer temperatures. The system is recording constant speed loss, but the operator is still interested in preventing micro stops, and she needs them to stand out on the screen visually, as well as to be able to see a report for micro stops only.
In another example, the operator of a product assembly line slows the line down because of a lower quality glue, to make sure that the product is glued properly. The cause of this temporary slowdown is known and needs to be visualized and reported separately in order not to obscure the other causes of speed loss.
So how do you track slow speed and micro stops separately? There is a simple way and a sure way.
- The simple way means that you use minimal hardware: you count products with a sensor. When products pass by the sensor at a lower than expected frequency, the reason could be either slow speed or micro stops. The system runs an algorithm to distinguish between the two. It depends on the type of production, but usually, it is possible with a high degree of accuracy.
- The sure way would be to use appropriate hardware, capable of monitoring whether the conveyor is moving or not. You can do that in several different ways, for example, you could attach a rotary sensor under the conveyor belt to register the movement of the conveyor, or you could use the PLC of your machines to send information about the status of production.
Importance of Automated Production Monitoring for Measuring Speed Loss
Automated production monitoring, as such, already has a lot of advantages compared to manual production monitoring, but it is especially important for monitoring speed loss.
Out of the three OEE components (availability, performance, and quality), performance is the hardest to measure manually. This is due to the frequency of speed issues and their “invisible” nature. As we mentioned before, this is one of the main reasons why speed loss has not received the attention it deserves.
However, automated production monitoring can change this. Production monitoring software is capable of capturing speed losses.
Automated Production Monitoring Software
Start accurately measuring speed loss and improving your performance. Free for 30 days.
How You Can Measure and Comment Speed Loss with Evocon
Evocon displays availability loss in red color and speed loss in yellow color. When an operator adds a comment to speed loss, it becomes amber yellow.
Let’s look at an example on a bagging line:
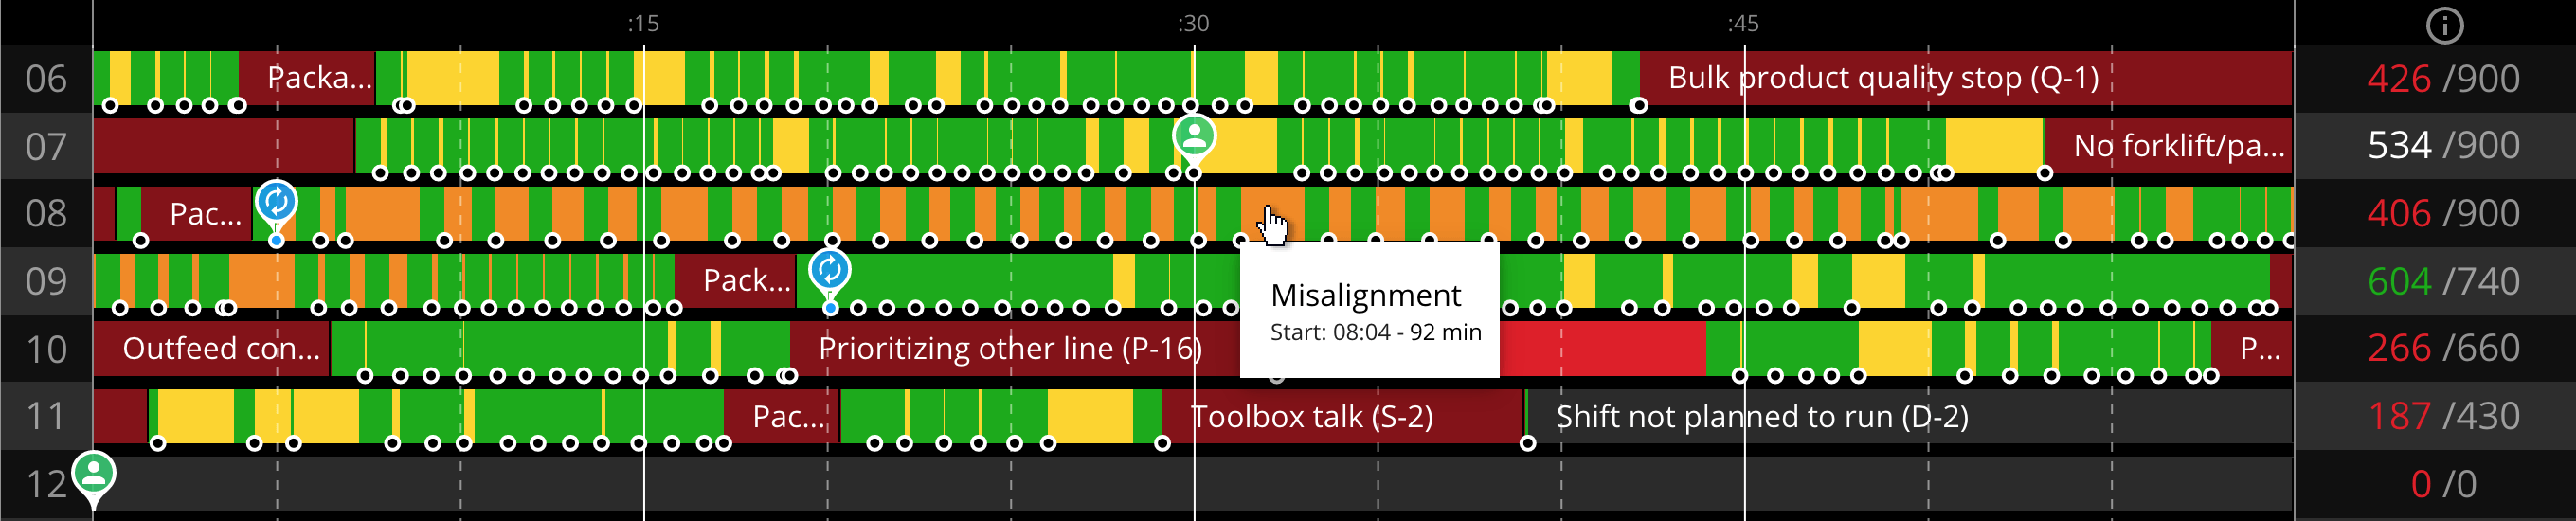
After a changeover line showed significant speed loss. A more experienced operator checked the line and found out that the bagging machine should have been aligned differently for this product. She selected the range of speed loss from the moment it started occurring until the moment it ended and added the speed loss reason from a predefined list:
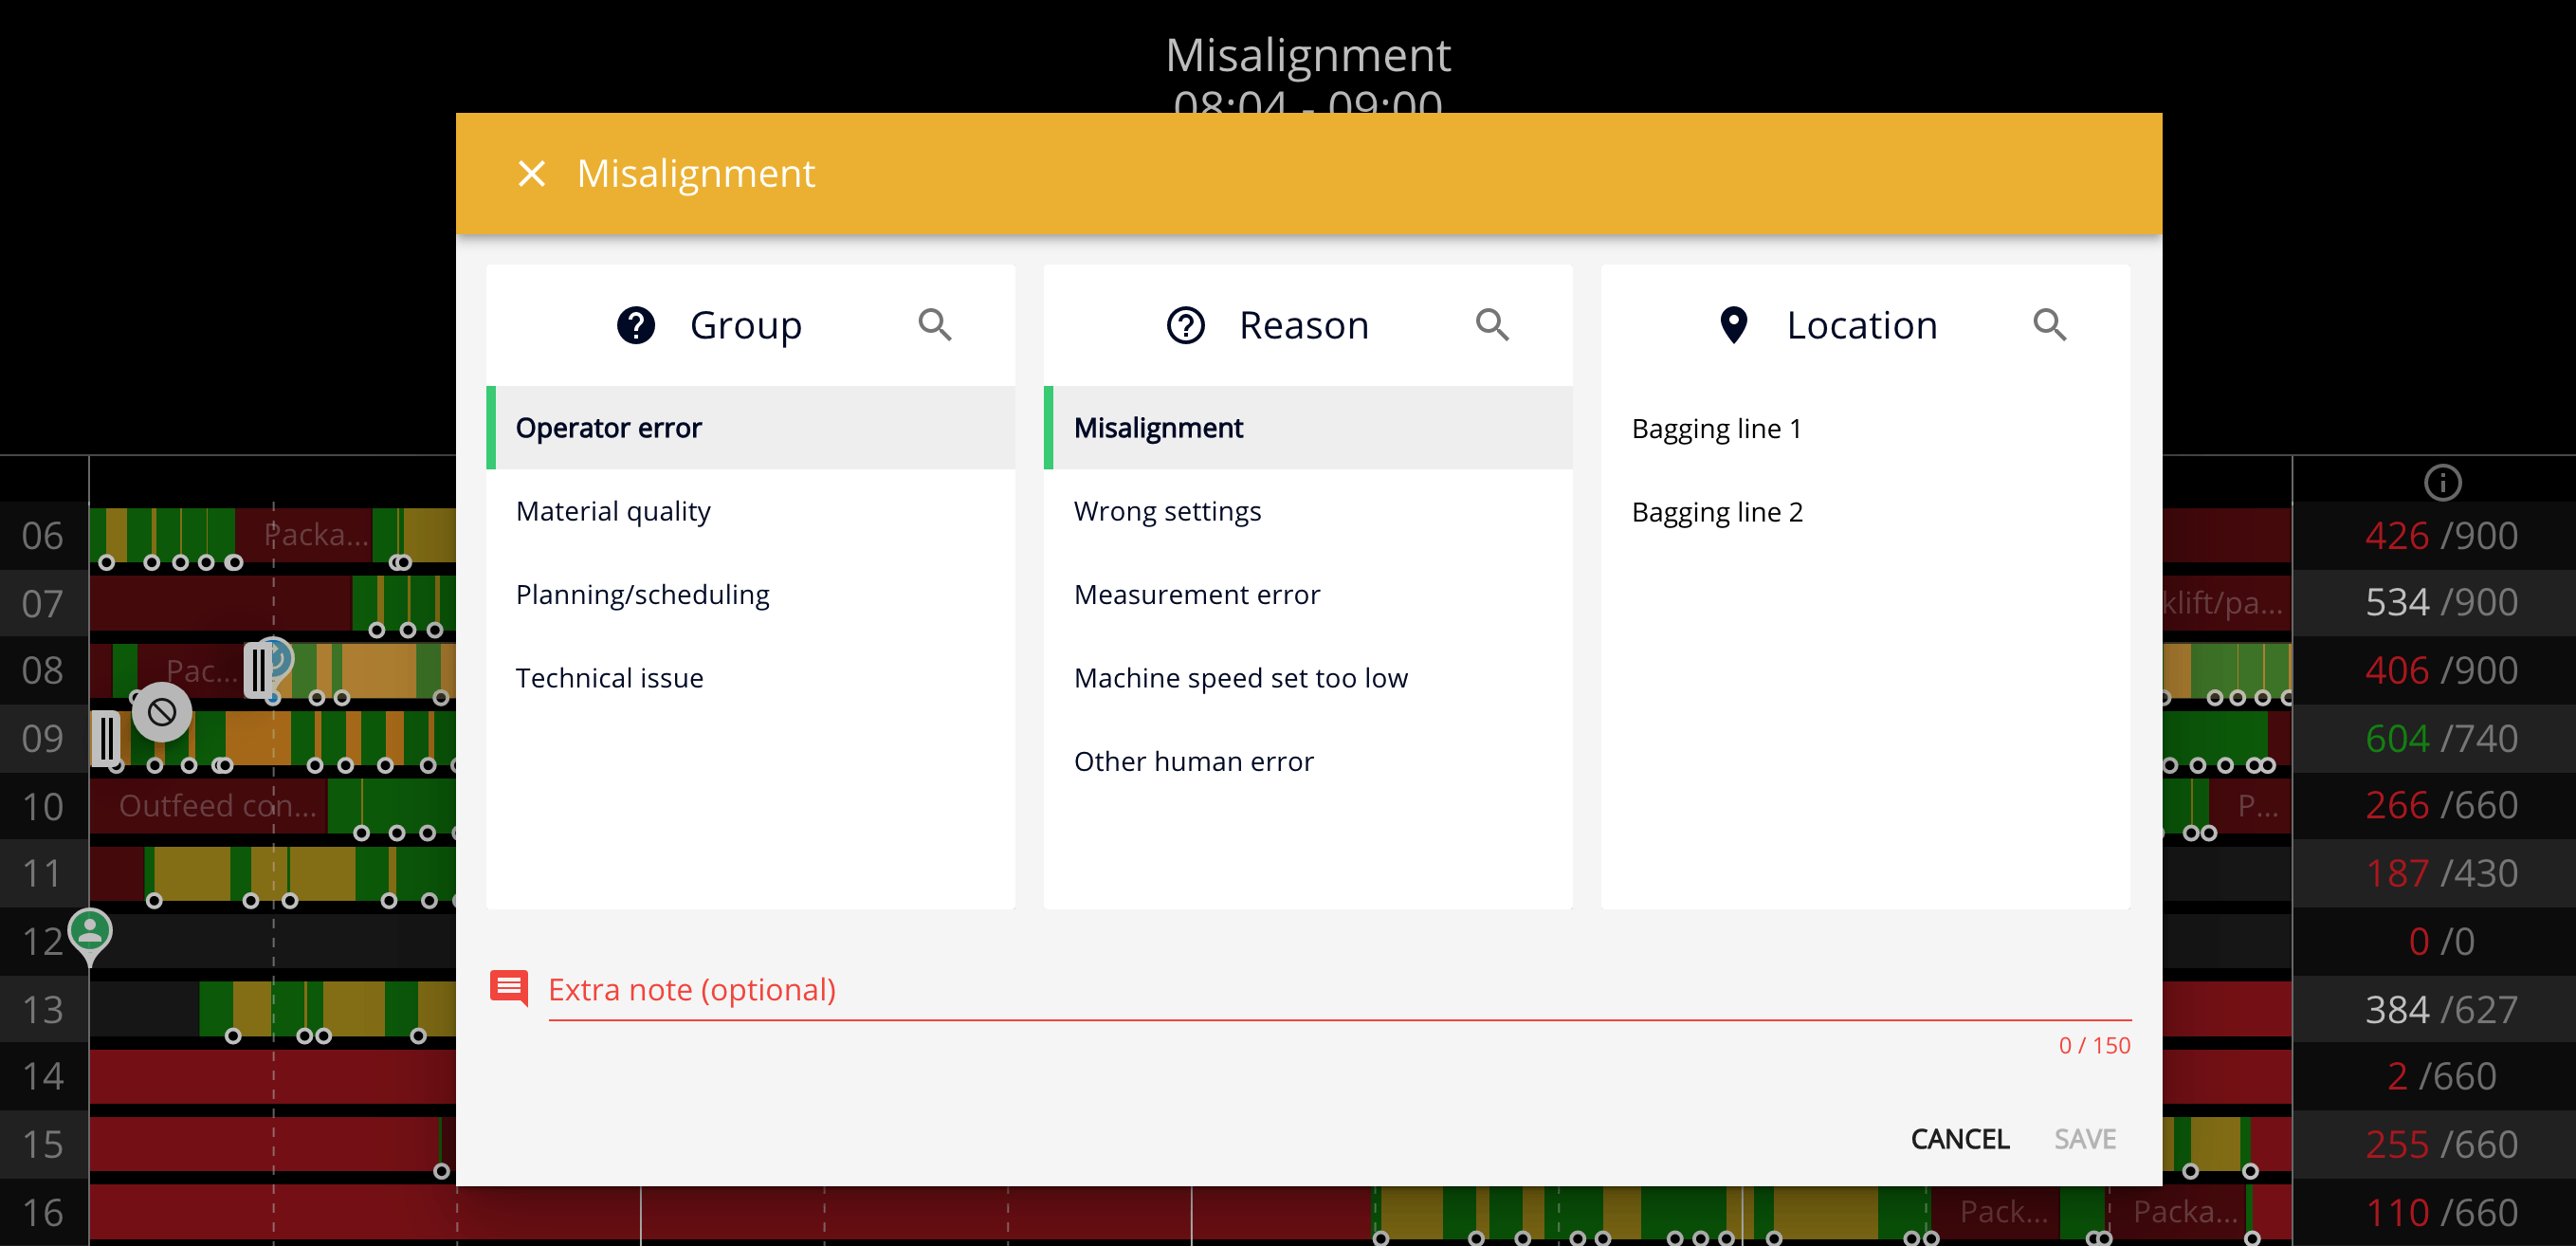
That way, not only she solved the problem in this instance, but the comment stays available for other operators who will encounter a similar situation.
And, of course, there is a report available to analyze the most frequent speed loss reasons:
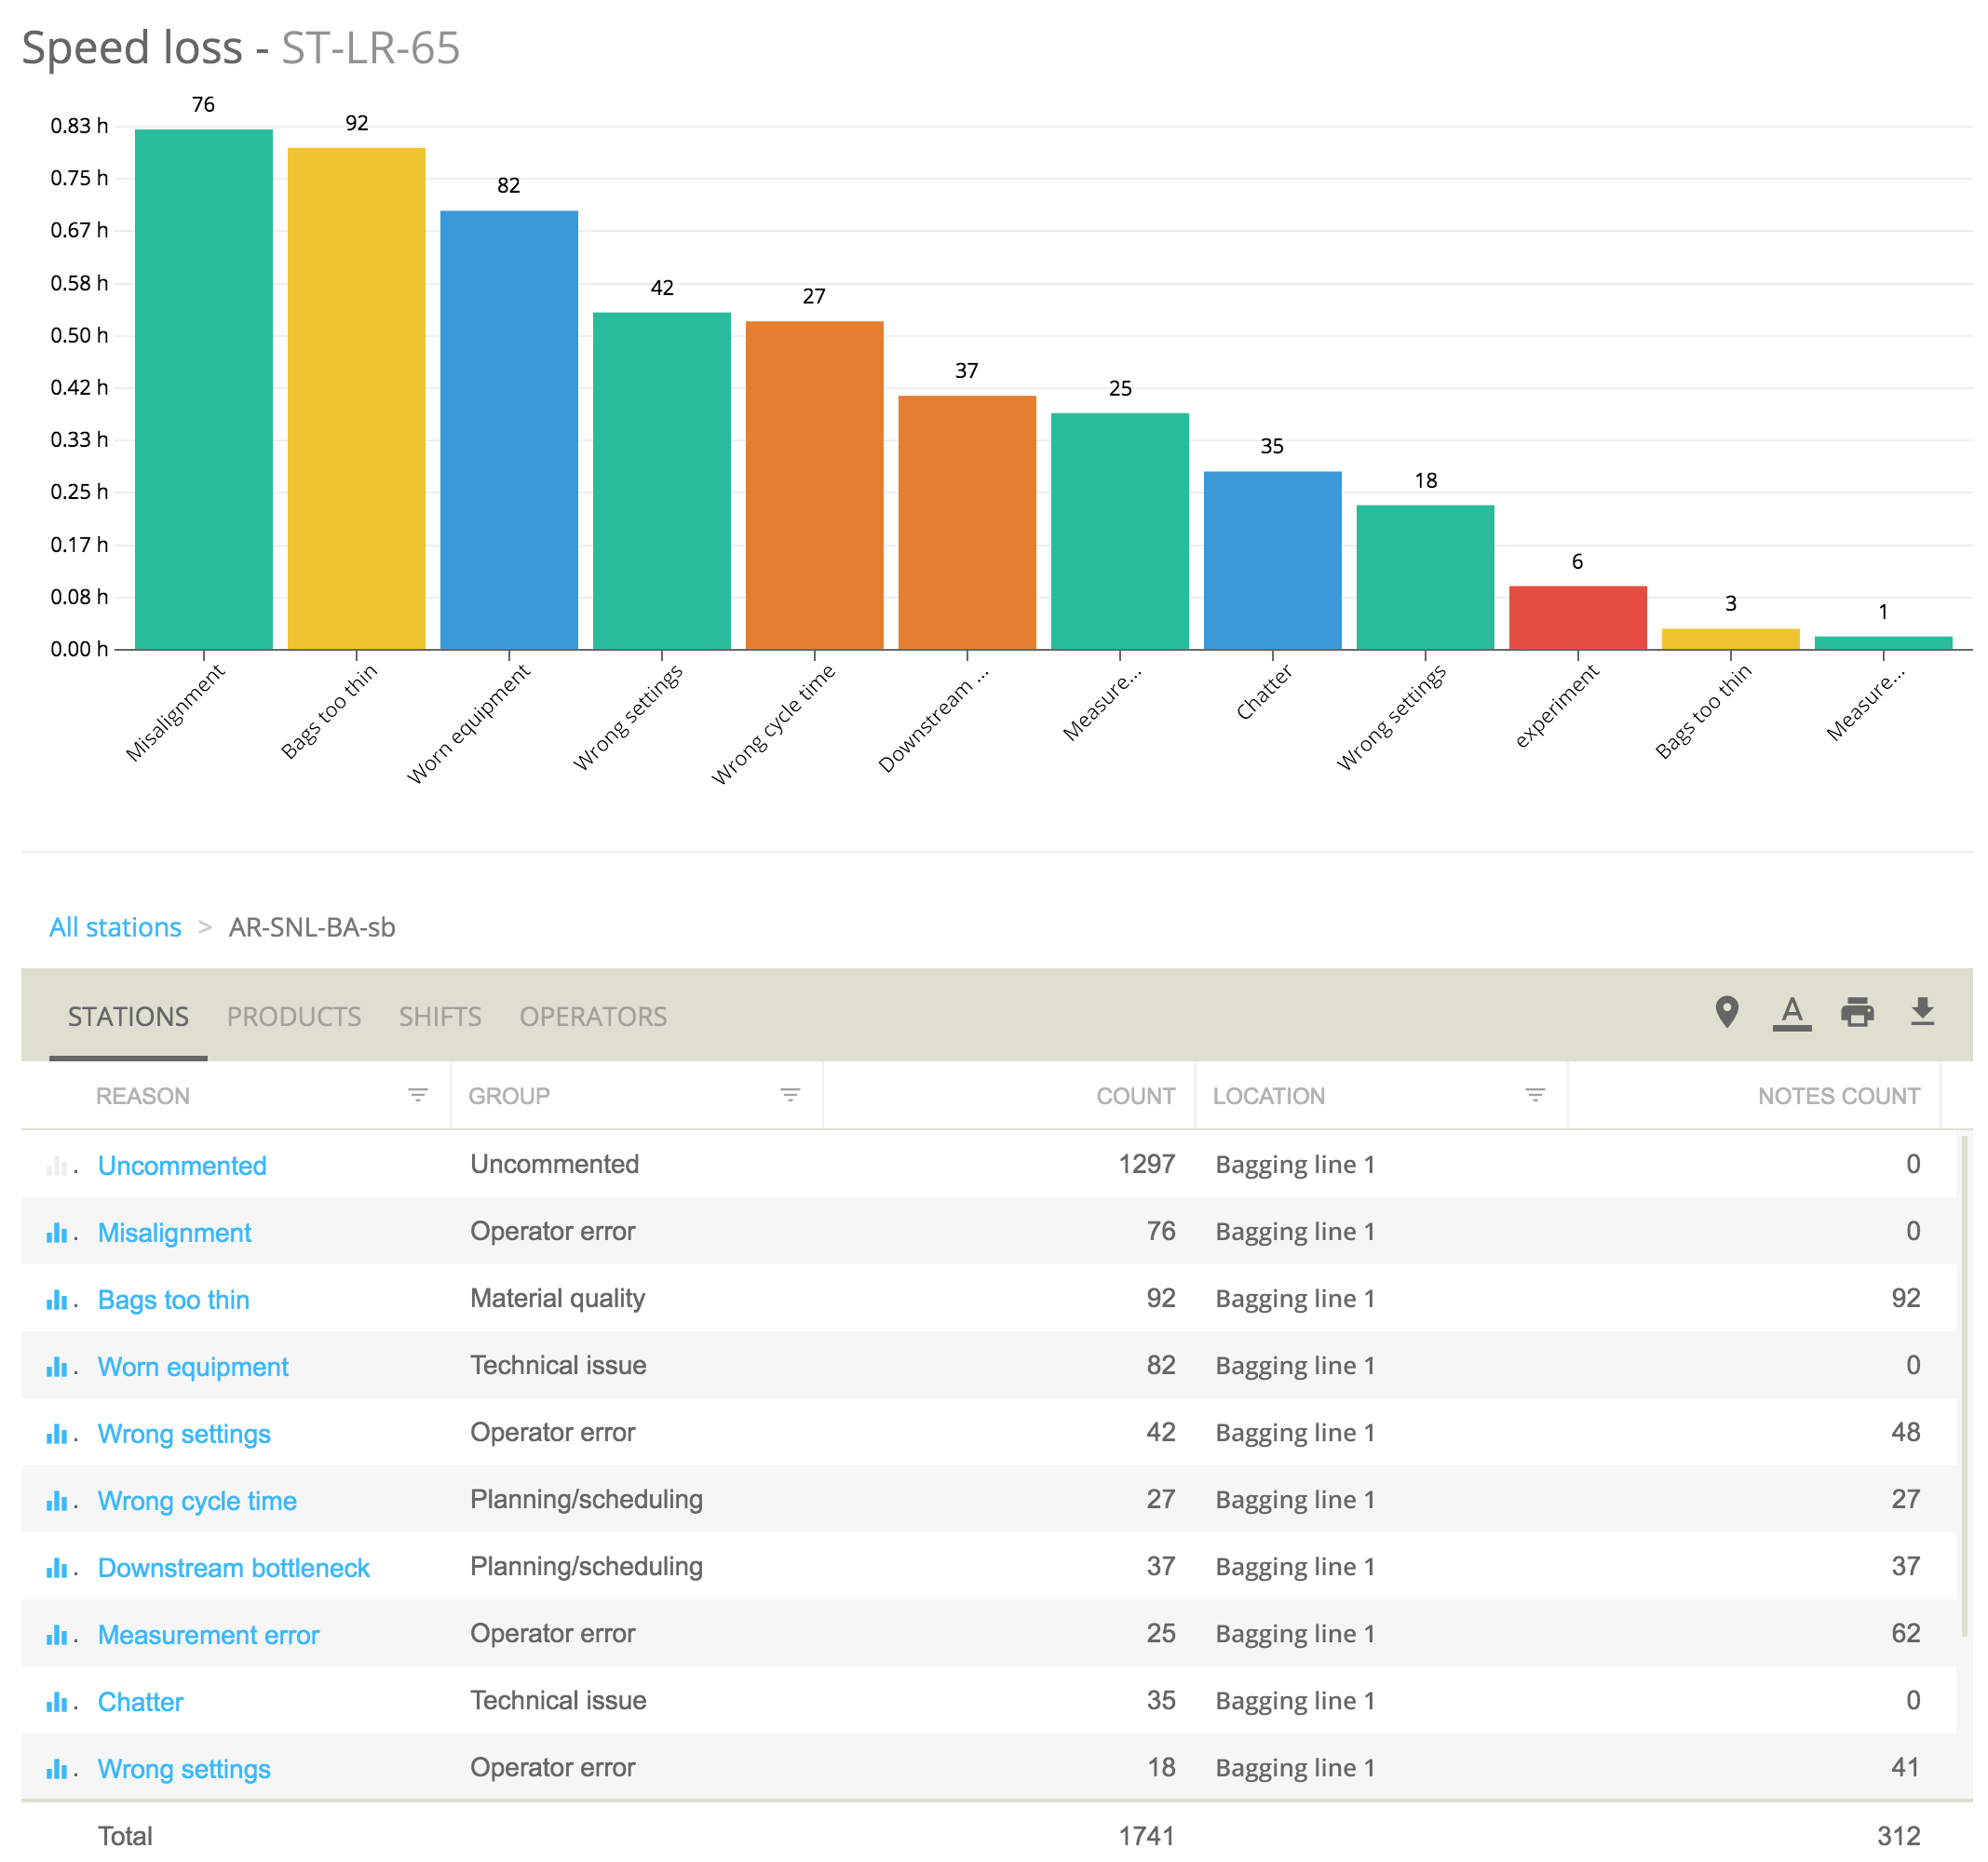
So, visualizing speed losses, as you see in the example above, can finally shed light on previously underestimated issues.