 Enterprise Package
  Integrations
  Security
  Hardware
 How Evocon Works
  OEE Monitoring
  Increasing Productivity
 OEE Calculator
  Evocon
  Join us
 Welcome to Evocons introduction to Lean Six Sigma (LSS) DMAIC project methodology. Here you can gain a basic familiarity with what LSS DMAIC projects are about, how they are structured and what tools and techniques are involved. If you’re new to Six Sigma (SS) or Lean Six Sigma (LSS), it is best to start with our Introduction to Six Sigma and Lean Six Sigma.
What is a Lean Six Sigma DMAIC project?
The LSS DMAIC is a process improvement methodology. The methodology itself functions as a structured problem-solving tool. DMAIC is an acronym for the names of the five-phases: Define, Measure, Analyze, Improve, and Control.
If you want to skip the theory, we suggest reading our DMAIC project example.
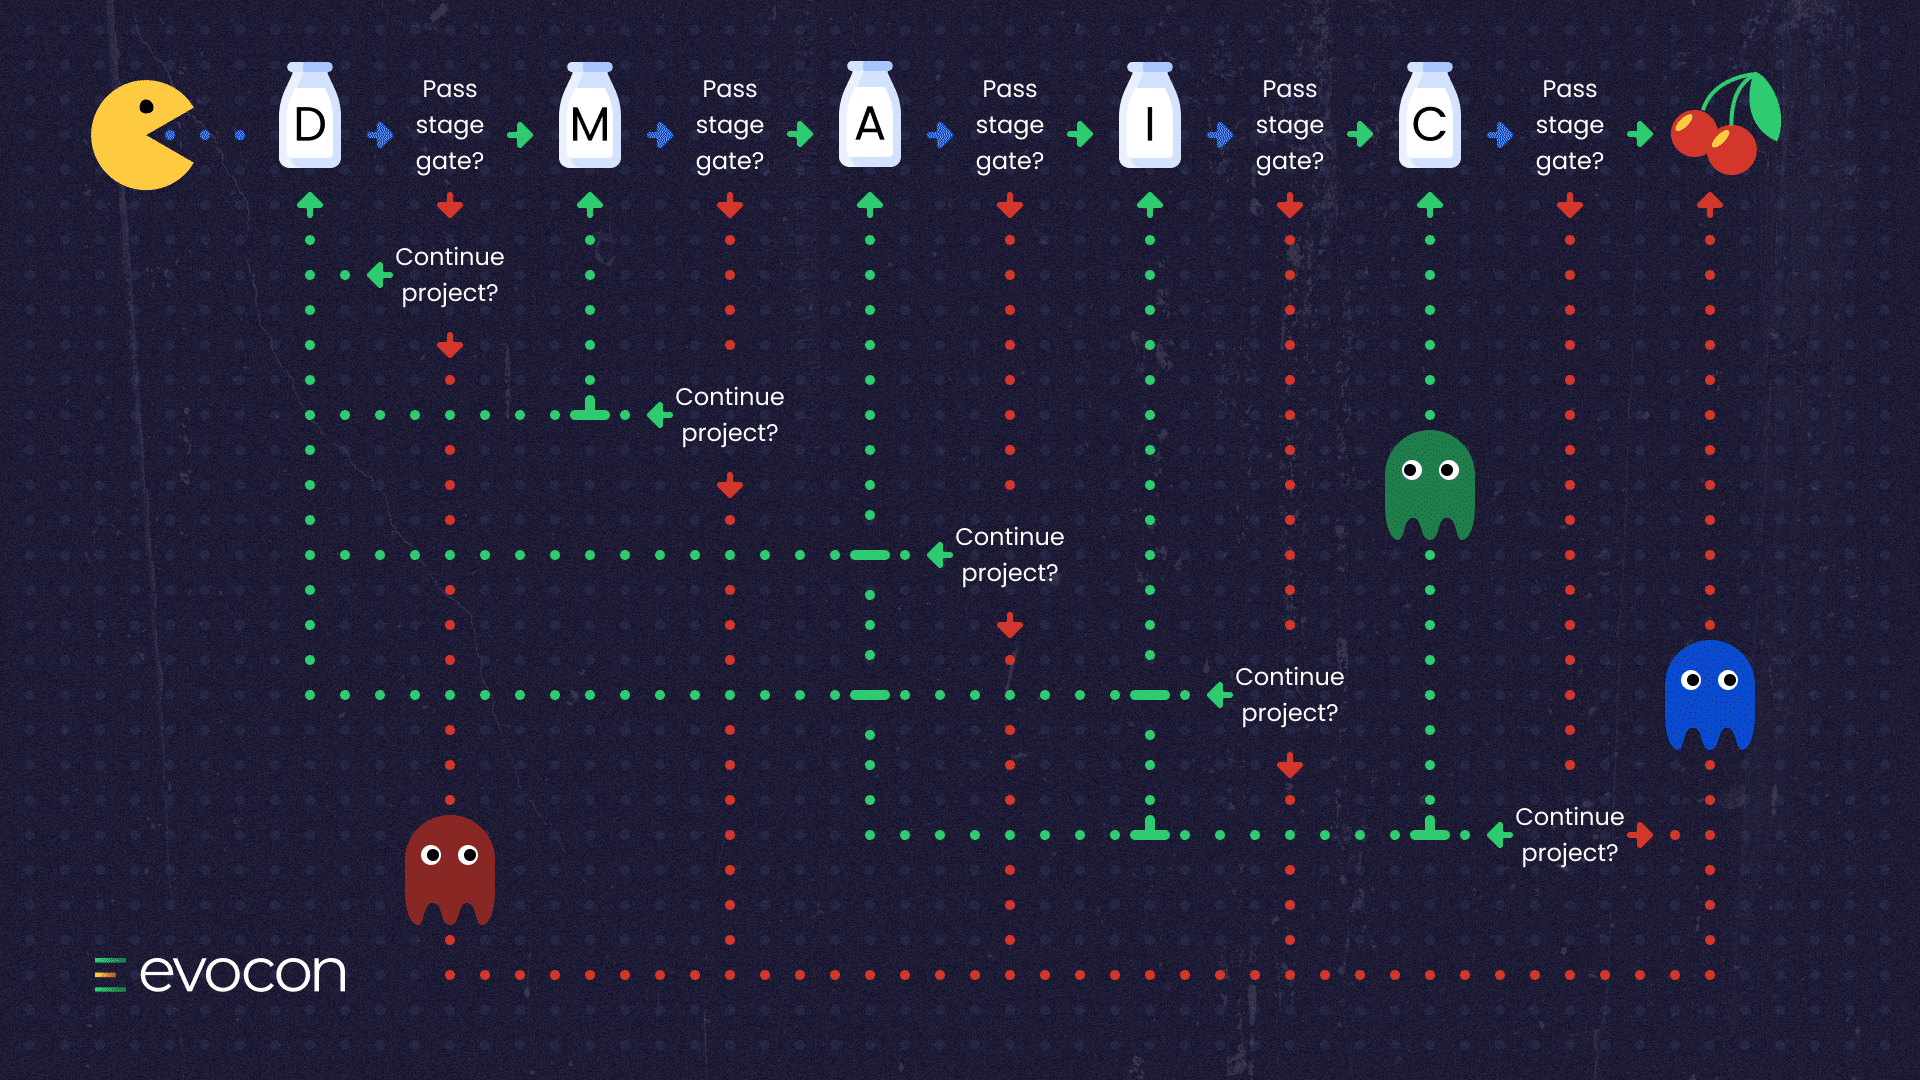
The Lean Six Sigma DMAIC process in an ideal world vs practice
We present the five phases in sequence with the acronym DMAIC. This is DMAIC in a perfect world.

In the real world, things are a bit more complicated. A project can move to the next phase, or it can return to a previous stage. It could even be abandoned altogether.
Evocons’ approach to DMAIC
Here is where we begin to learn the five phases of the LSS DMAIC methodology. At Evocon, our approach is to cover three critical areas for each of the phases.
- Primary purpose
- Common activities
- Useful tools
Phase I: Define
As the name implies, phase I defines a project’s:
- Purpose and scope
- Goals and deliverables.
The Define phase is primarily a data-gathering exercise. Accordingly, the common activities and tools below help teams to gather and organize data.
Common activities
- Identify the problem
- Agree on the project focus
- Form cross-functional team
- Document business case
- Gather voice of the customer data
- Develop Critical-to-Quality (CTQ)
- Map business process
- Create value stream map (VSM)
- Develop SIPOC chart
- Complete project charter form
The SIPOC Chart is a tool to guide teams to define the critical elements of a process. SIPOC is an acronym for Suppliers, Inputs, Process, Outputs, Customers, and Requirements.
Useful tools
- Pareto diagram
- VOC analysis
- CTQ’s
- Business case
- Kano analysis
- RACI
- Quad chart
- Project Charter
Each of these tools can contribute data for the development of the project charter (example below).
| Lean Six Sigma Project Charter | |
| Project Name: | Reduction of Operator Error Non-Conformance on Example Line |
| Gaps/Issues/Problem Statement: | This team is formed to reduce the occurrence of operator error in the example area. Operator error is the leading reason cited in all Non-conformance notifications that were submitted in the previous 12 months (50% of total). |
| Charter Objective/Goal: | Reduce operator by 30% by the end of August. |
| Scope: | The team’s focus is restricted to four types of operator area that when combined, represent 80% of all operator error NCNs. |
| Defect: | Operator error is defined in our example information system by the cause description: operator error – 005. |
| Measures/Deliverables: | 30% reduction in NCN caused by Operator Error as found in data extracted monthly from example information system. Cost of poor quality will be reduced by 0.05% |
| Milestones: | Define – 3/12/2020, Measure – 4/1/2020, Analyze – 5/1/2020, Improve – 5/20/2020, Control – 7/1/2020 |
| Project Sponsor/Champion: | Quality Assurance Manager and Master Black Belt |
| Date of Approval: | 3/12/2020 |
| Project Completion Date: | 7/28/2020 |
| Team Members: | Project Manager, Consultants, Production Supervisors, Production Operators, Manufacturing Engineering |
| Project Budget: | <$5,000 |
| Business Case: | A 30% reduction in operator error will yield a projected annual savings of $75,3K |
| Document Revisions: | 3/12/2020 – Original release, person making change – PM. 5/1/2020 – Added business case, person making change – PM. 5/1/2020 – Added operational definitions, persona making change – PM. |
Phase II: Measure
The primary purpose of the measure phase is to define the current state of the process. This begins by establishing a baseline for process performance, and that means the team needs data. Usually, the team will need to develop and implement a data collection plan to measure process performance.
If your facility has not implemented OEE software, the Measure phase can be time-consuming. How long?
According to a recent article in Modern Machine Shop when “recalling his time as a lean engineer… (he) would have been “100% more productive”… (with OEE software), because manually documenting “as-is” processes could take months.”
Common activities
- Identify key inputs
- Identify process & output metrics
- Define operational terms
- Collect process baseline data
- Determine process performance capability
- Validate business opportunity
- Validate the measurement system
Useful tools
- SIPOC Chart
- Statistical sampling
- Measurement system analysis
- Control charts
- Process capability study (Cp)
- Process capability index (Cpk)
- Gage R&R
- Failure Mode and Effects Analysis (FMEA)
After the measure phase, the team should have determined what needs to be fixed and be able to validate the business opportunity.
Phase III: Analyze
In the Analyze phase, the team breaks down the problem. The goal is to understand, define, and rank the importance of the most critical factors. The team will need to know how sources of variation lead to lower quality output in the form of defects.
The importance of data and data collection systems is also noticeable in the Analyze phase. If your plant is still manually collecting process data, we recommend reviewing the differences between manual and automated data collection efforts. In addition to improving the quality of data collected, OEE software can also reduce the amount of time spent in the Analyze phase.
Automate data collection with Evocon
Give your team all the OEE software tools they need to understand and improve the production process. Free for 30 days.
The primary purpose is to develop a comprehensive understanding of the sources of variation. And, to also determine their respective root causes.
Common activities
- Propose and prioritize critical X’s
- Root cause analysis (RCA) – critical X’s
- Quantify opportunity
- Prioritize root causes
- Validate critical X’s
- Estimate effect on critical Y’s
In the Define phase, the team will unofficially begin to think of the process as a mathematical function; Y=f(X).
Essentially, the output of the process ‘Y’, is a function of variables, ‘X’s’.
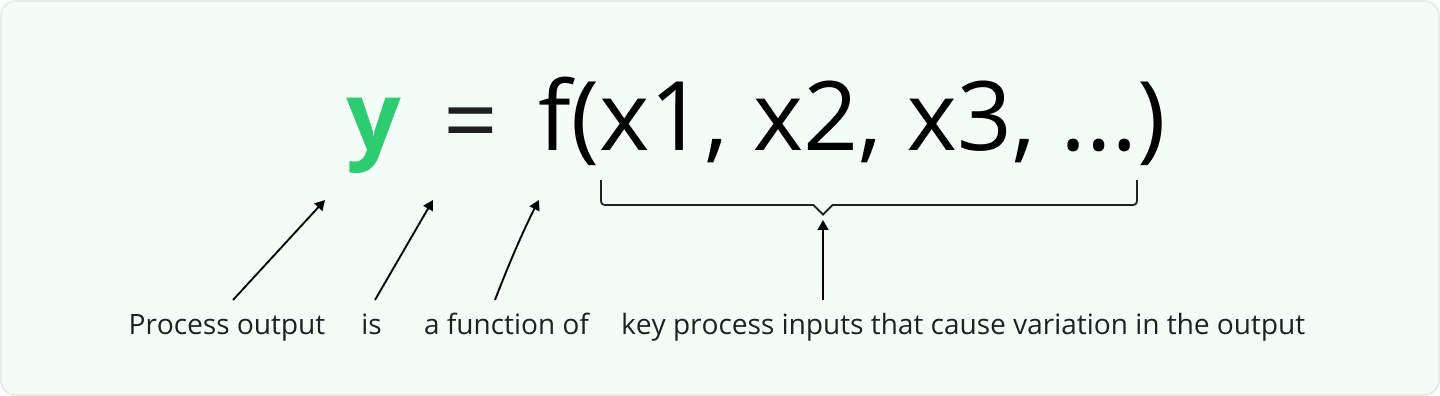
The critical X’s in this equation are variables that represent sources of process variation. These variables control the uniformity of the processes output; the critical Y.
In phase III, the team must identify and validate the critical X’s effect on the critical Y. Regression analysis (RA) is a popular method for this activity. RA is covered in more detail below.
Firstly, the team understands the sources of variation in the process. Secondly, the team works to understand the degree to which this variation influences the quality of output. Once they have this information, they can begin to devise methods to control and minimize the deviation.
Useful tools

- Pareto charts
- Histograms
- Brainstorming
- Analysis of variation (ANOVA)
- Future state process map
- Hypothesis testing
- Cause & Effect diagrams (Ishikawa/Fishbone)
- 5 Why analysis
- Regression analysis
Regression Analysis is a statistical method that allows the team to understand the relationship between an output variable ‘Y’ and a set of input variables ‘X’. The connection is defined mathematically. This allows the team to predict the value of ‘Y’ at specific values of ‘X’.
Exiting Phase III, the team should be able to quantify the performance gap. Moreover, they should also be able to list the benefits of closing the gap (improving the process).
Phase IV: Improve
The primary purpose of phase IV is for the team to develop, test, and implement solutions to improve the process. This phase relies heavily on the science of statistics. Both correlation and regression analysis may be necessary.
It’s worth recalling that improvement in Six Sigma relies on reducing variation. Specifically, in this step, the team will focus on reducing variation in the critical output variables caused by the most vital input variables.
Common activities
- Develop potential solutions
- Determine evaluation criteria
- Select the best solution
- Optimize solution
- Develop a high-level implementation plan
- Develop pilot/simulation plans
Useful tools
- Brainstorming
- Benchmarking
- FMEA
- Future state process maps
- Pilot, simulation
- Design of experiments (DOE)
Statistically designed experiments find use in phase IV. DOE helps the team to identify the vital factors which influence the critical output variables.
Phase V: Control
The control stage is focused on the implementation of changes proposed in the improvement phase. Moreover, process controls must be designed to sustain improvement. The latter requires the team to define the necessary actions that will be needed to maintain the benefits of change after the project ends.
First, the team will monitor the process to ensure stabilization. As the project winds down, it is common to discuss any other similar operations in the plant where the project may be recreated.
Finally, the team calculates the financial benefits of the project. The calculation uses data collected after the implementation of the solution. As a result, this step also validates the original business case in addition to providing the necessary financials.
Common activities
- Develop standard operating procedures (SOP)
- Design a training plan
- Detail process controls
- Implement process changes
- Implement process controls
- Monitor & stabilize the process
- Transition process to process owner
- Identify opportunities to replicate the project
- Calculate financial benefits
Useful tools
- Control charts
- SOP’s
- Training plan
- Communication plan
- Implementation plan
- Process control plan
- ROI analysis
Keep Learning
This article introduced the Lean Six Sigma DMAIC project methodology. You have learned the primary focus, common activities and useful tools of a DMAIC project team through each of the five phases.
LSS is a broad and expansive subject. Simply put, we have barely scraped the tip of the iceberg. If you want to learn more, we recommend exploring certification, though self-education will also work.
If you have questions or comments, feel free to reach out to a process improvement expert on our team. We enjoy any opportunity to talk shop and live to help manufacturers solve problems. We want to be apart of driving improvements in quality and production process performance at your plant.
Sources
- Brue, G. and Howes, R., 2006. The Mcgraw-Hill 36-Hour Course Six Sigma. New York: McGraw-Hill.
- Siebels, Don. The Quality Improvement Glossary. ASQ Quality Press, 2004.
- Kubiak, T. M. The ASQ Pocket Guide For The Certified Six Sigma Black Belt. ASQ Quality Press, 2014.
- Sigma, Six. “Six Sigma – Lean Manufacturing And Six Sigma Definitions”. Leansixsigmadefinition.Com, 2020. Accessed 2 Aug 2020.