 Enterprise Package
  Integrations
  Security
  Hardware
 How Evocon Works
  OEE Monitoring
  Increasing Productivity
 OEE Calculator
  Evocon
  Join us
 Fishbone diagrams are causal mapping diagrams that can be used to map the causes of a specific event to different categories. They were pioneered by Kaoru Ishikawa in Kawasaki shipyards quality management process. In this post, we discuss what Fishbone Diagrams are and how to put the method into use in discovering potential solutions to existing problems in manufacturing.
What Is a Fishbone Diagram?
The goal of Fishbone Diagrams is to help you move beyond symptoms to uncover the root cause of a problem. In manufacturing, the problem is usually linked to the Six Big Losses, which every manufacturer wants to eliminate.
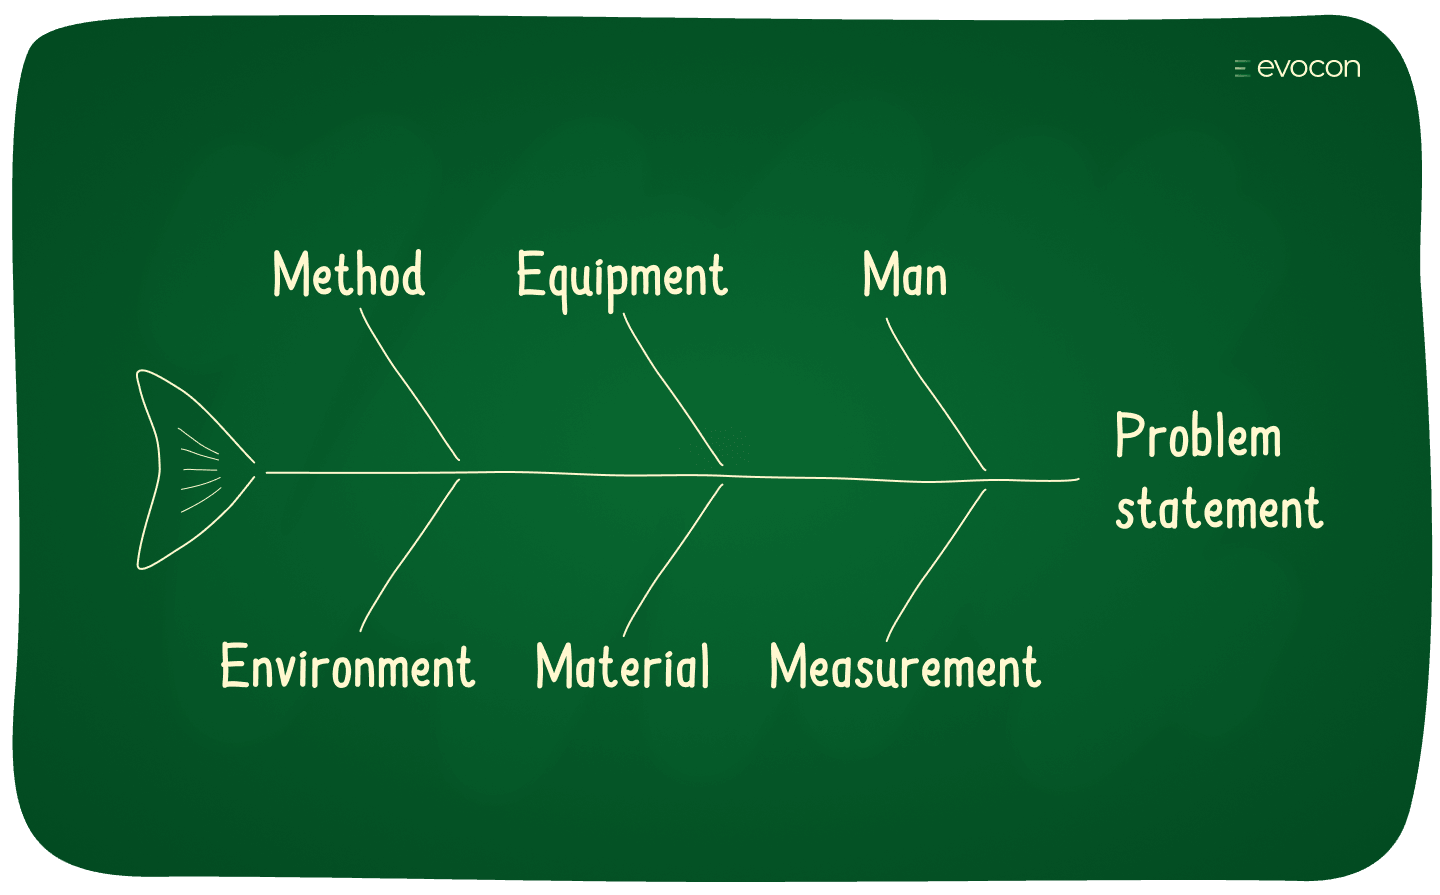
The Fishbone Diagram takes its name from its characteristic shape. You can easily understand this by a quick glance at the blank diagram below.

The problem is the fish’s head, with the causes extending to the left as fishbones. While the causes fall into 6 main categories:
- Method
- Equipment
- Man
- Environment
- Material
- Measurement
How to Use Fishbone Diagrams?
Now that you understand what a blank diagram looks like, let’s learn how to use one by working through a real-life example in a manufacturing environment.
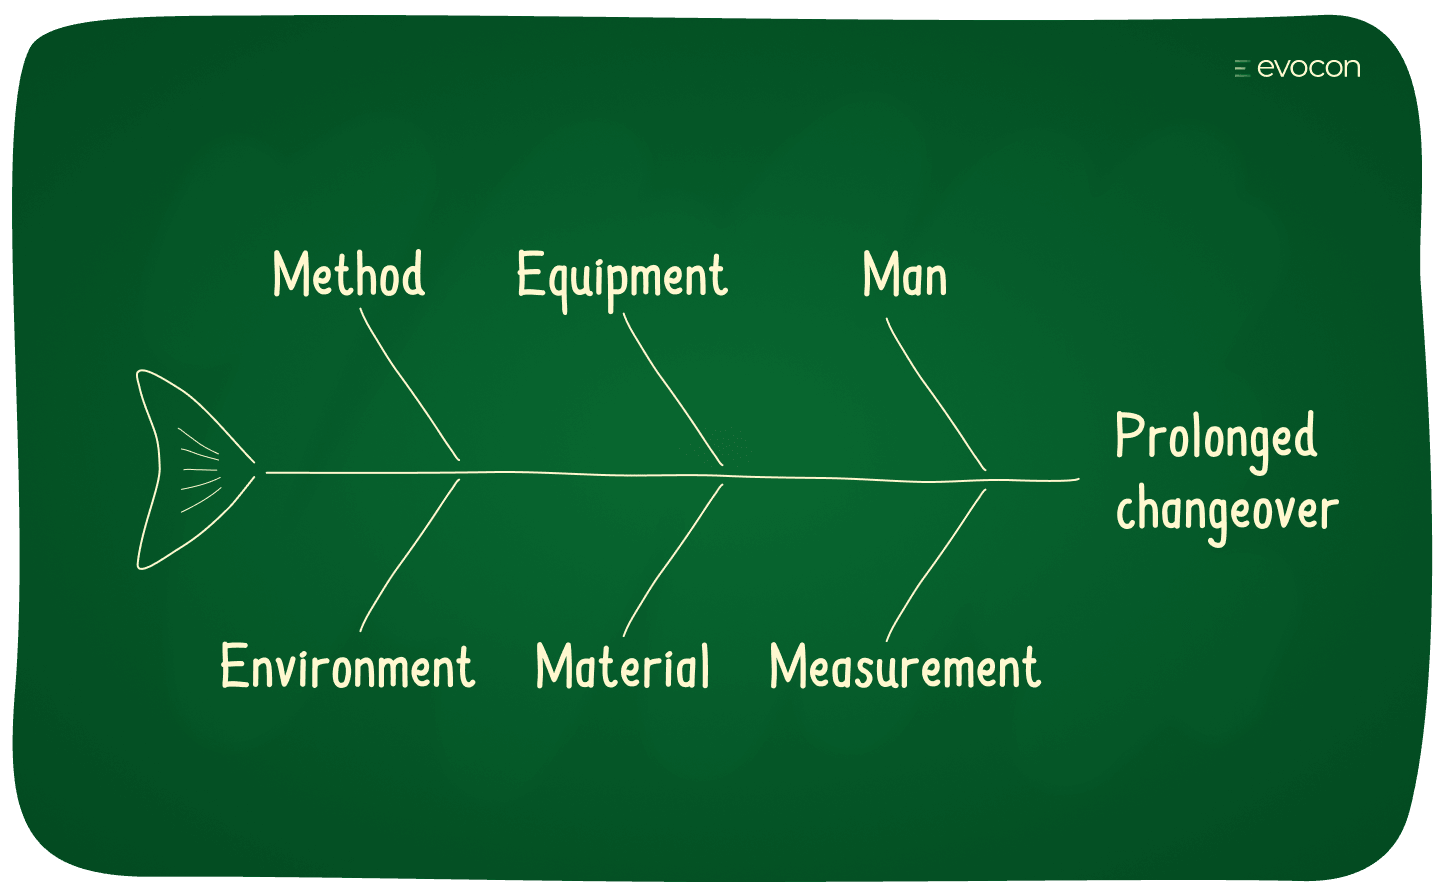
Step 1: Determine the problem statement
Let’s say that you experience prolonged changeovers when running a particular product. Thus, the specific event that we want to explore causes for is “prolonged changeover”. This is our problem statement and becomes the head of the fish, as shown below.
Step 2: Brainstorm potential causes for the problem statement
At this point, a brainstorming process with your team can begin. What you are aiming to do is to come up with as many different potential causes for the problem statement as possible. It helps to have whiteboards, post-it notes, etc. on hand while working through the brainstorming process.
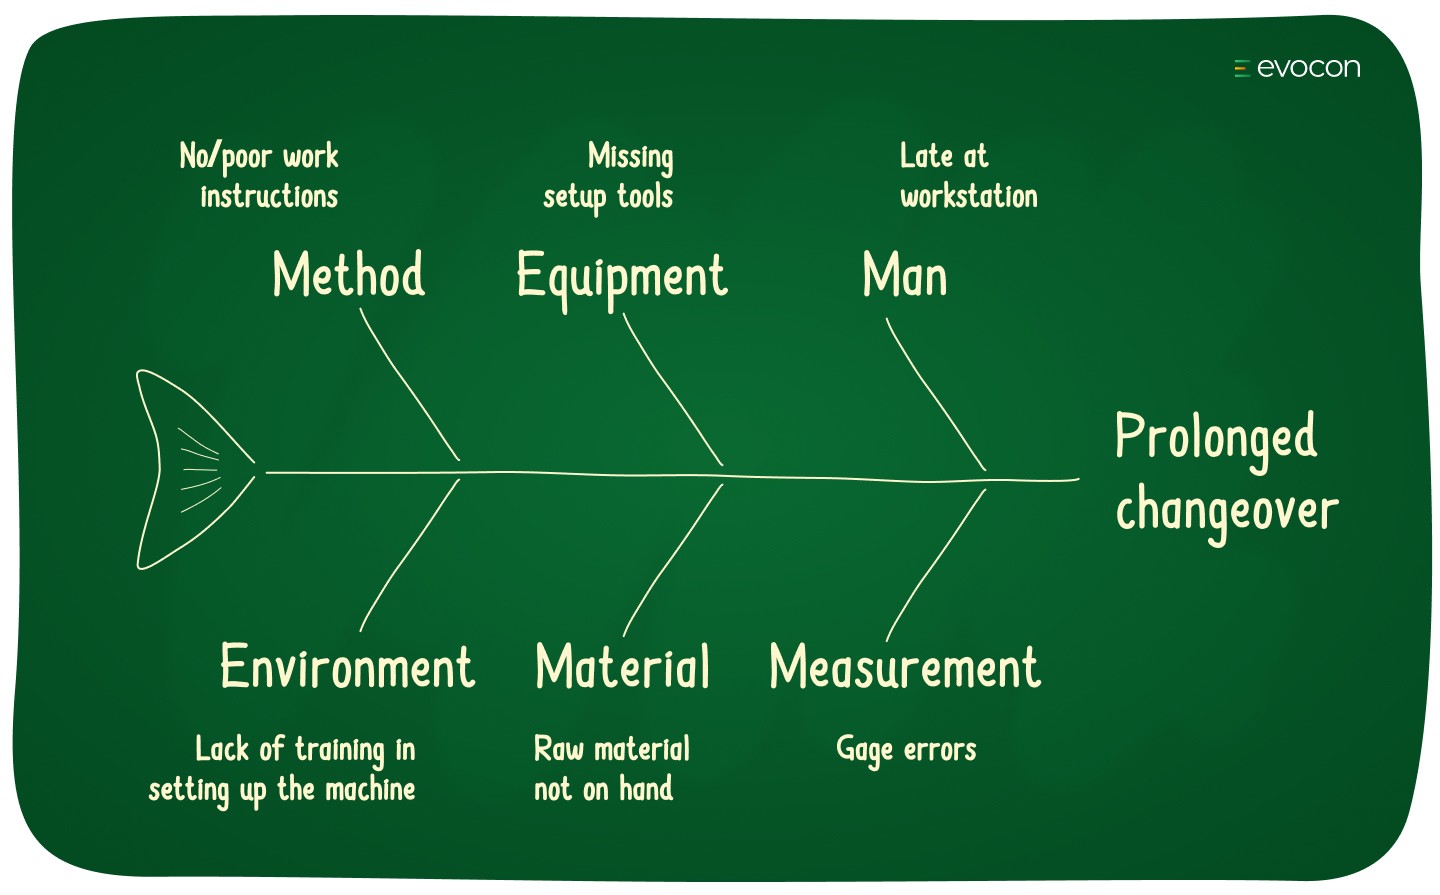
For our example, let’s say that you identified the following causes for the problem:
- No/poor work instructions
- Missing tools for setup
- Operators arrive late
- Lack of training in setting up the machine
- Raw material not on hand in a timely manner
- Gage errors
As your team works through the brainstorming exercise the fishbone diagram creates a framework for understanding the potential areas to explore in the search for causes.
Improve your processes
Get the data you need to understand what's really happening on the shop floor. Free for 30 days.
Step 3: Map the problems to the six categories of the Fishbone Diagram
Using the six categories, map the causes to the diagram. When placed on our blank fishbone diagram, it looks like this.
Now, in practice, the diagrams are far messier and larger. With probably more causes than six. And some of them being more important than others. Our point in this last step is simply to give a clear illustration of what a completed fishbone diagram looks like.
Tip: Once you have identified potential causes, a great next step is to use 5 Whys Analysis to dig deeper.
What next?
At this point, your team has brainstormed potential causes for the problem statement. You have considered each of the categories and feel that you have a complete list. Now it is time to use this input to move towards implementing a sustained solution.
Learn more: How to Perform Root Cause Analysis in 6 Steps
Main Takeaway
The Fishbone Diagram is an essential tool for all manufacturing teams who want to improve their production process. It provides an easy framework to further your understanding of problems in your production process.