 Enterprise Package
  Integrations
  Security
  Hardware
 How Evocon Works
  OEE Monitoring
  Increasing Productivity
 OEE Calculator
  Evocon
  Join us
 All of us involved in Production are constantly wondering if our performance is below, above, or at the same level as our industry. We would all like to have comparative data to perform benchmarking or comparative evaluation. This is a process where a business or an organization compares its processes, performance, or products with those of others – usually the best in the industry – to identify opportunities for improvement.
The questions we ask are:
- Where do I find performance data from companies in my industry?
- How do I know if the data I found is correct and reliable?
- How do I know if the production conditions of the data providers are similar to mine?
These questions, and many others, ultimately deter us from this process. Here, we will develop a method by which we can generate comparative data ourselves, with absolute confidence and objectivity, and use it immediately. How can this data form a secure basis for the continuous improvement process, and how will the entire organization benefit, including Production Planning, Maintenance, Costing, Investment Planning, and Sales?
OEE and The Trap of The Average
The secret is the commitment to monitoring OEE (Overall Equipment Effectiveness) in a modern, automated, and analytical way, in real time.
Imagine a factory with the following data:
- 5 production lines
- 15 operators
- 3 product families
- 100 products
It’s common practice that at the end of the month, we collect the data:
- OEE = Pieces Produced: 700,000 / Theoretical Production: 1,000,000 = 70%
- Cost/piece = Production Overhead Cost: 100,000 euros / Pieces Produced: 700,000 = €0.14/piece
Let’s call the above company Company A.
Many companies are operating in this way, which I would say is the “trap of the average.” The average concentrates all data into a single number, “smoothing out” the fluctuations. In doing so, the information about the distribution, the outliers, and the variability, which is always critically important, is lost.
The use of only the average brings the risk of:
- Ignoring critical problems (e.g., recurring failures on specific shifts).
- Misleading management regarding the overall health of production.
- Making wrong decisions based on “average” values that do not reflect reality.
- Losing the big picture in production analysis.
Now, let’s look at another company, Company B, which has exactly the same data, but one important difference: it monitors OEE in real time, down to the minute.
Having this wealth of data, Company B, after a brief analysis, can see that the OEE is not 70% for every product, every line, every shift, every operator, or every supplier, but that 70% is the average of these.
Real-time OEE Software
Discover the true potential of your factory. Free for 30 days.
Benchmarking with Granular Data
Below are some examples drawn from the Evocon application, which provides all production data per minute, but also offers the tools to perform analyses and comparisons. The graphs are real and come from a company using Evocon, with anonymized names, products, etc.
1. OEE by Product
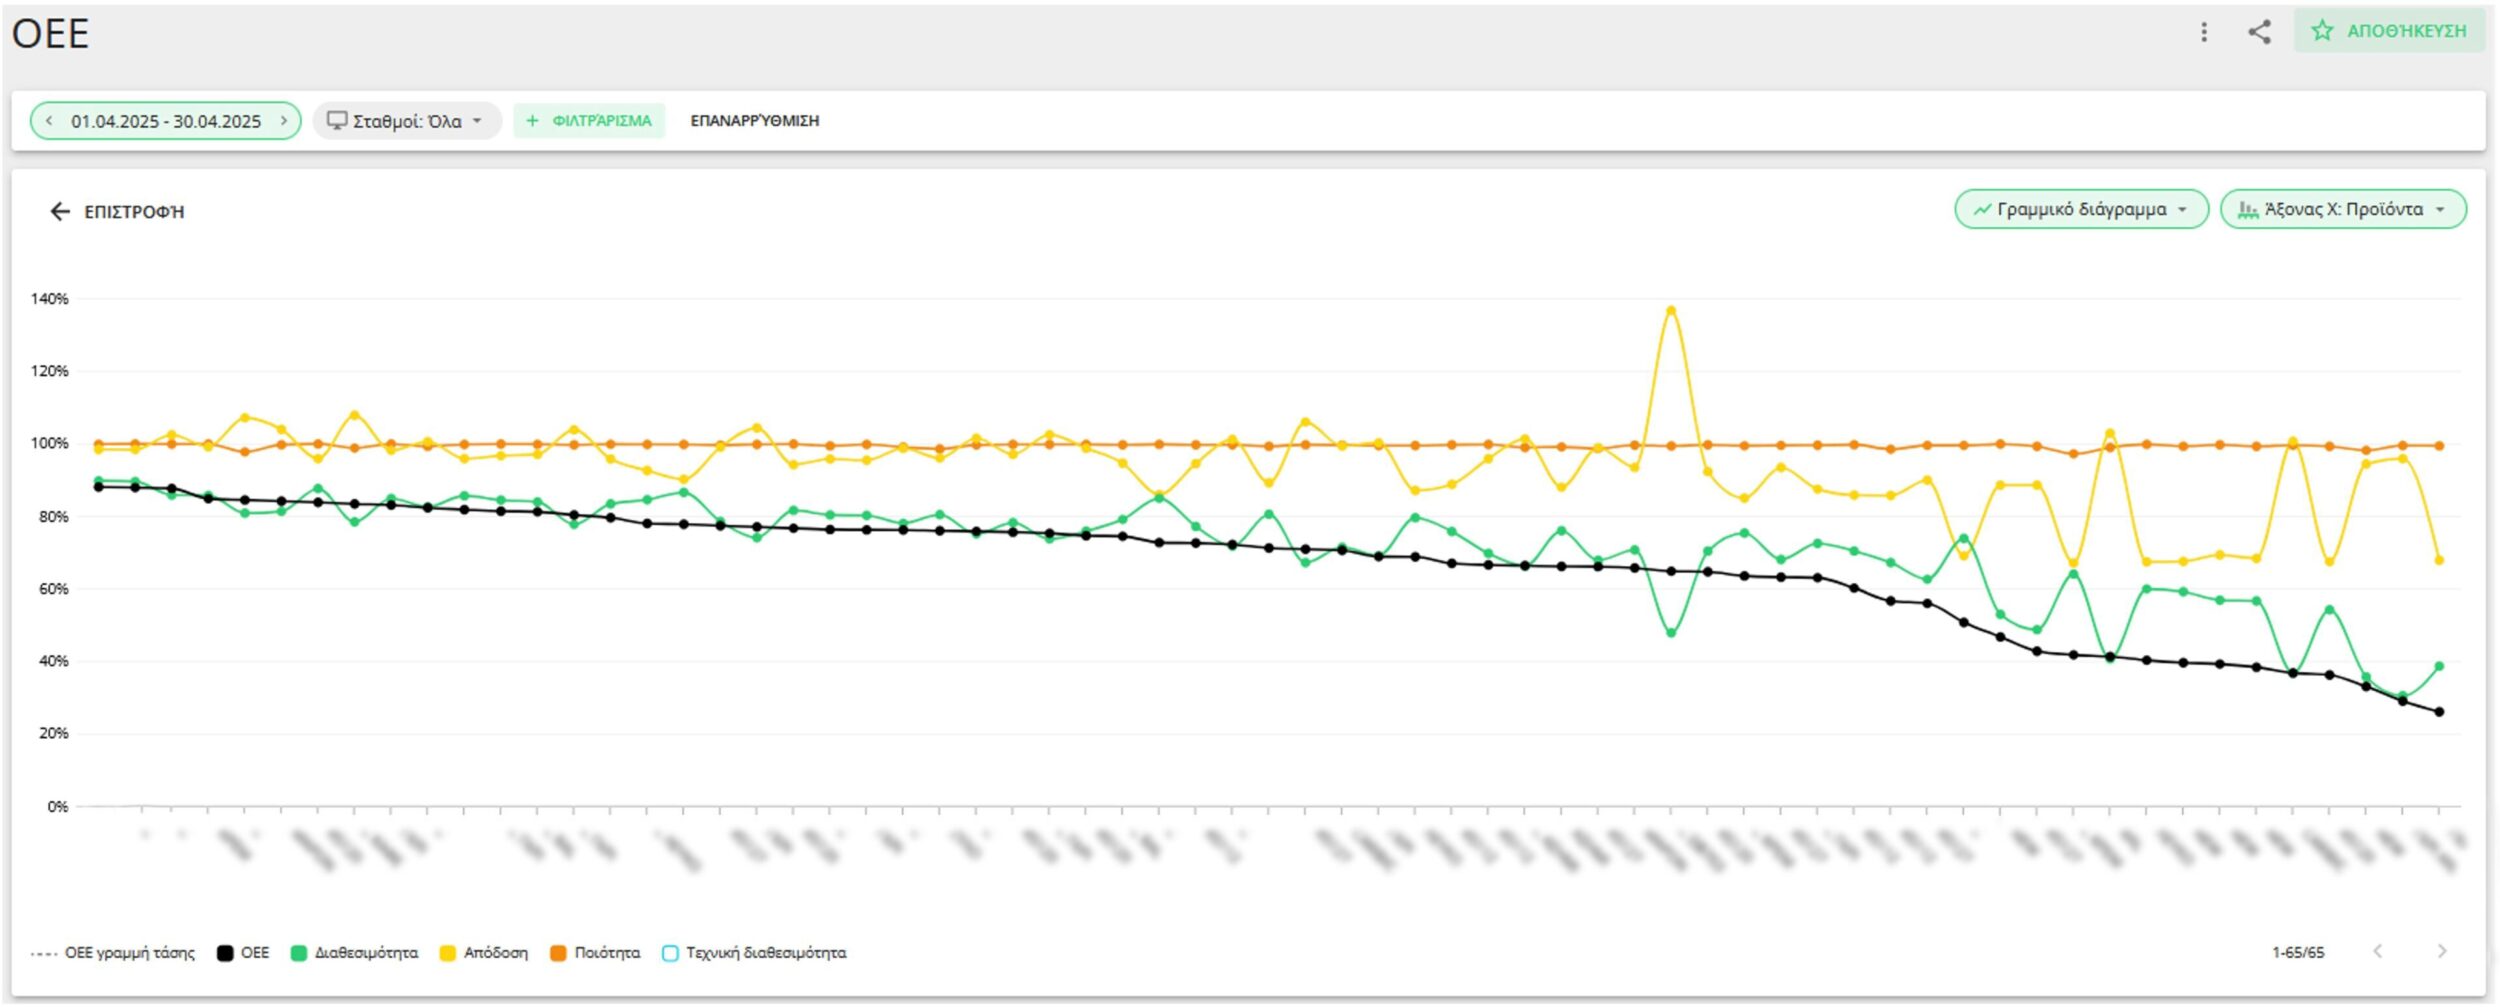
Of the 65 products produced last month, only 2 have an OEE of 70%. The rest have a large spread, ranging from 26% to 88%! And all of this with a different mix of Availability, Performance, and Quality.
If Costing calculates that the production cost of each product is €0.14, we say that for some products it is €0.11, while for others it is €0.48. This knowledge can give costing and commercial policy a significant boost.
2. Production Time by Product
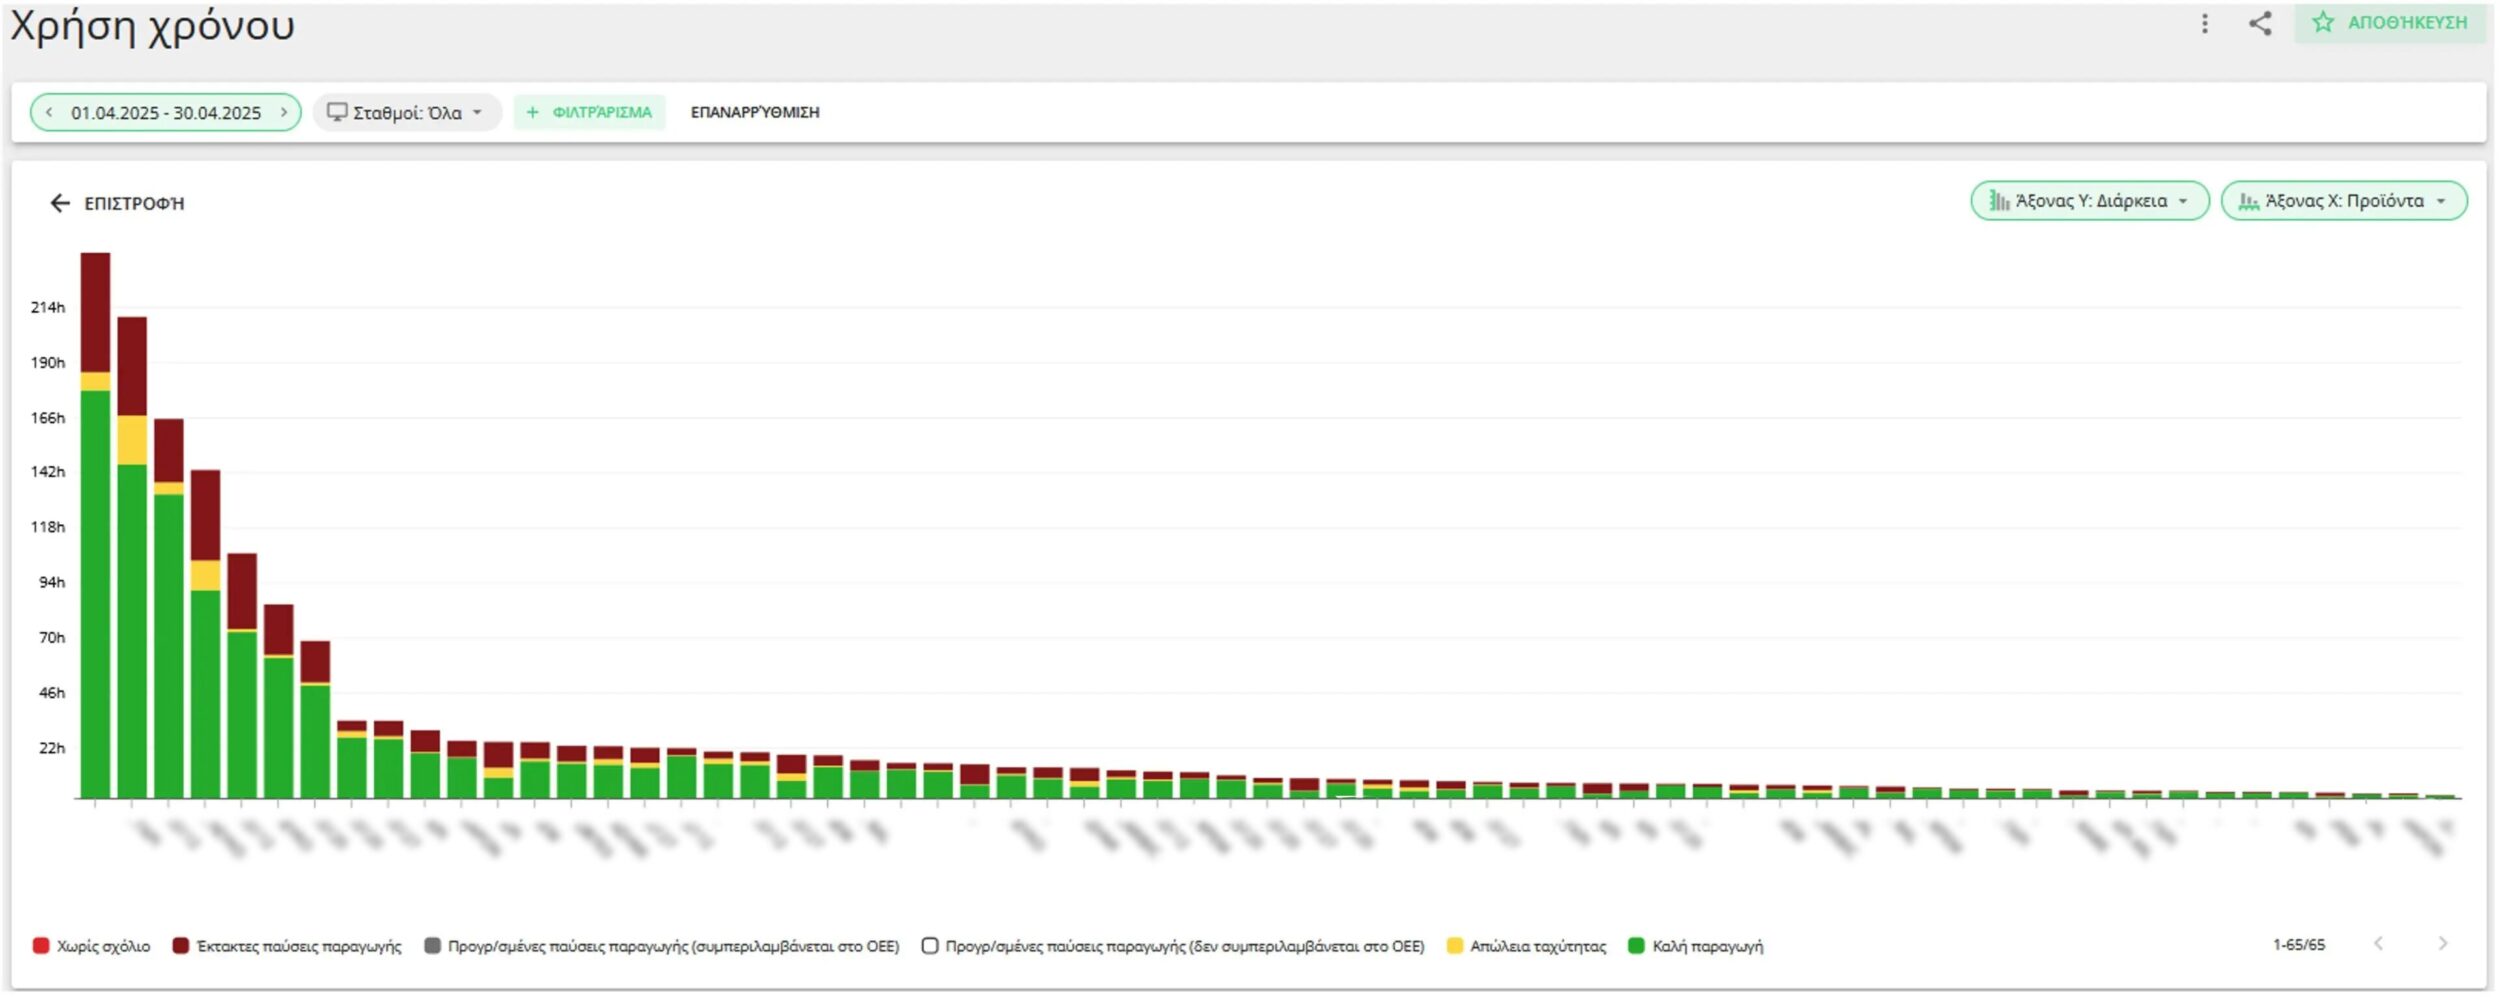
If Planning estimates that 1,800 pieces/hour are produced, it will obviously fail because some products are produced at a rate of 3,000 pieces/hour, while others are produced at a rate of 300 pieces/hour.
3. OEE by Production Line
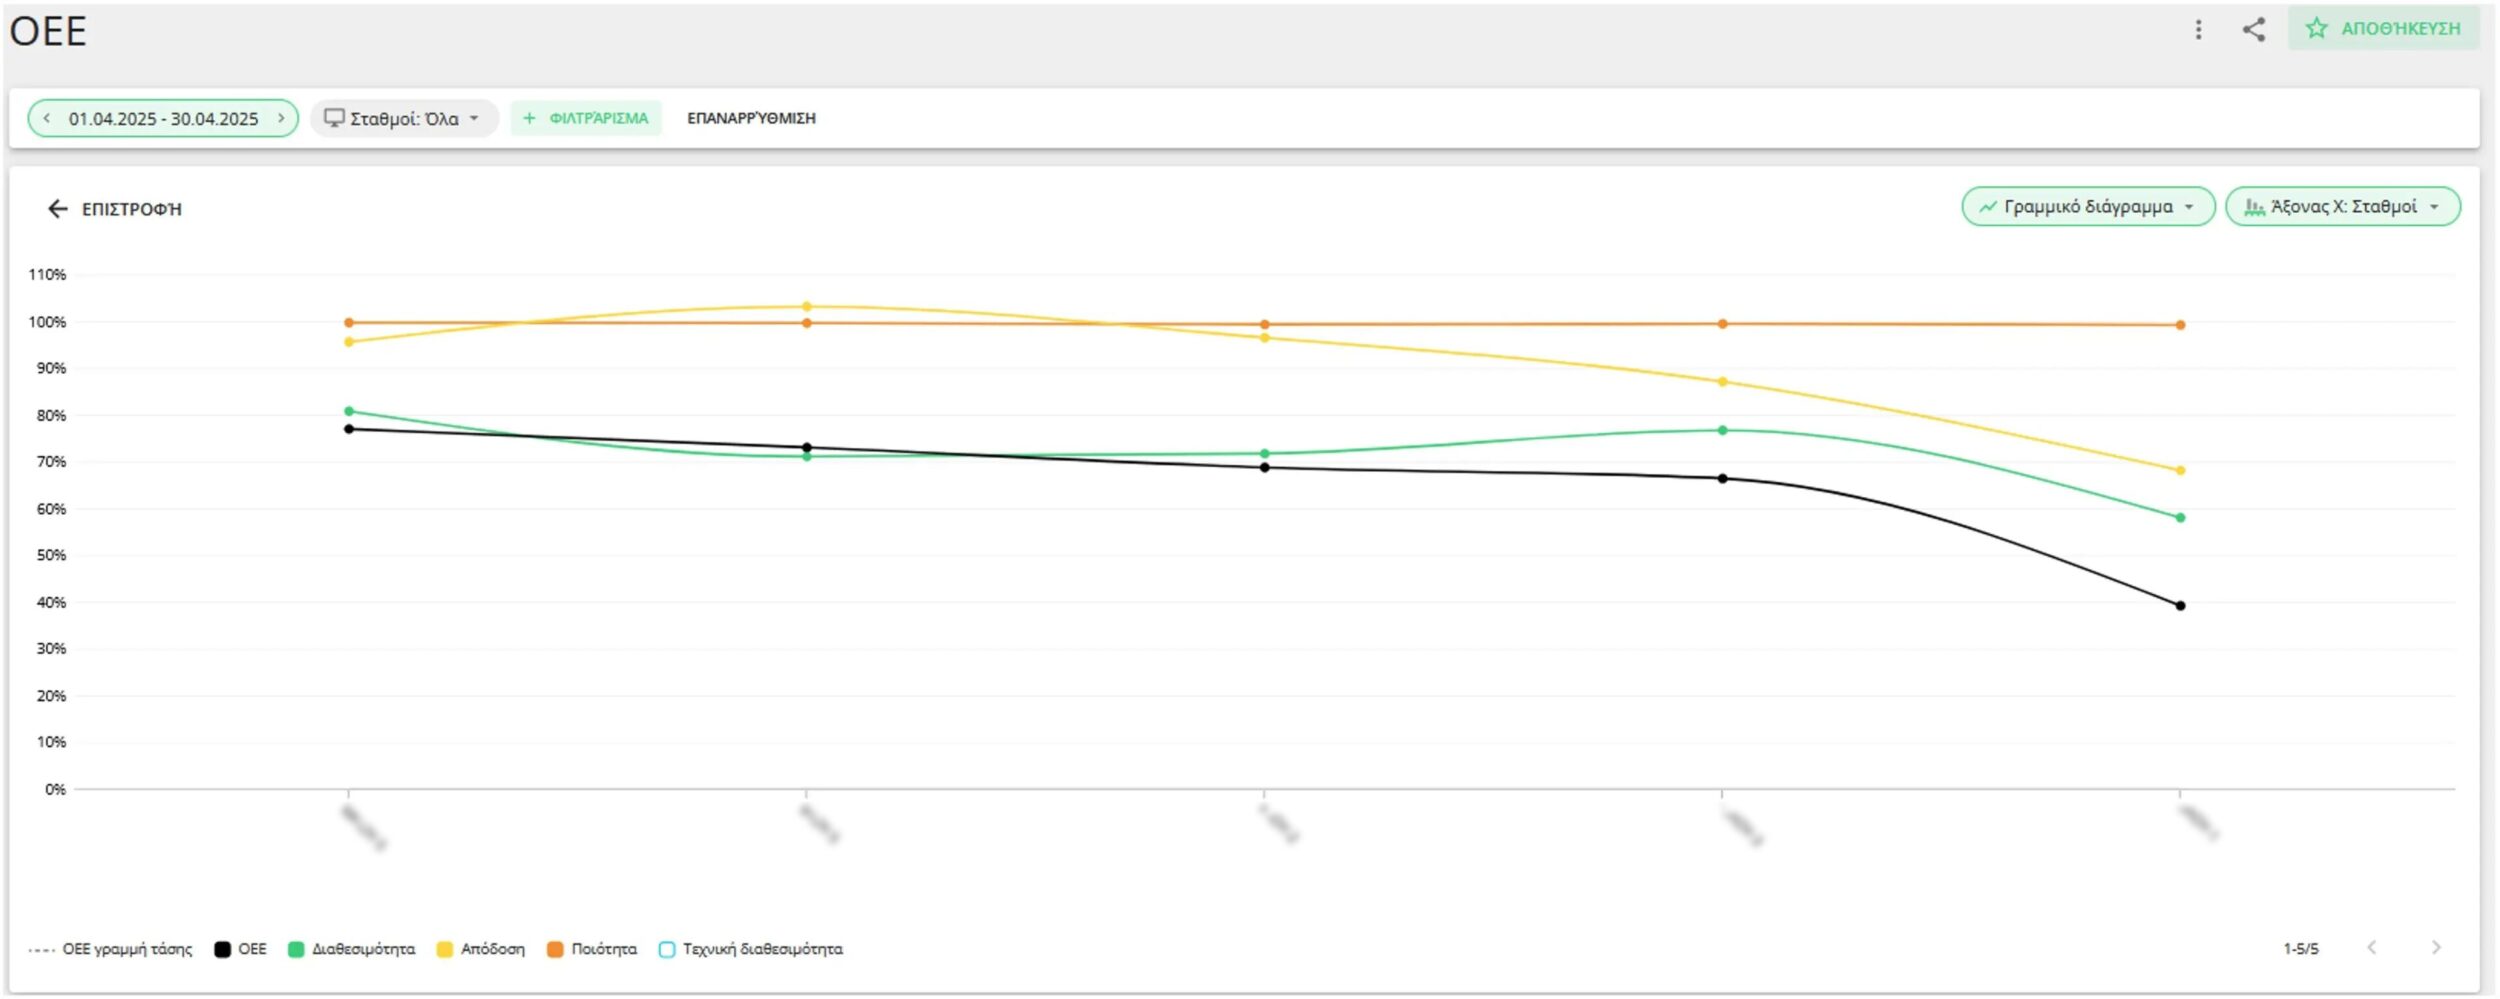
If the Production Manager believes that all his lines have an OEE of 70%, he is obviously mistaken. One line has an OEE of 77% and another 39%. This is a shining example of Benchmarking.
4. Mechanical Failures by Line
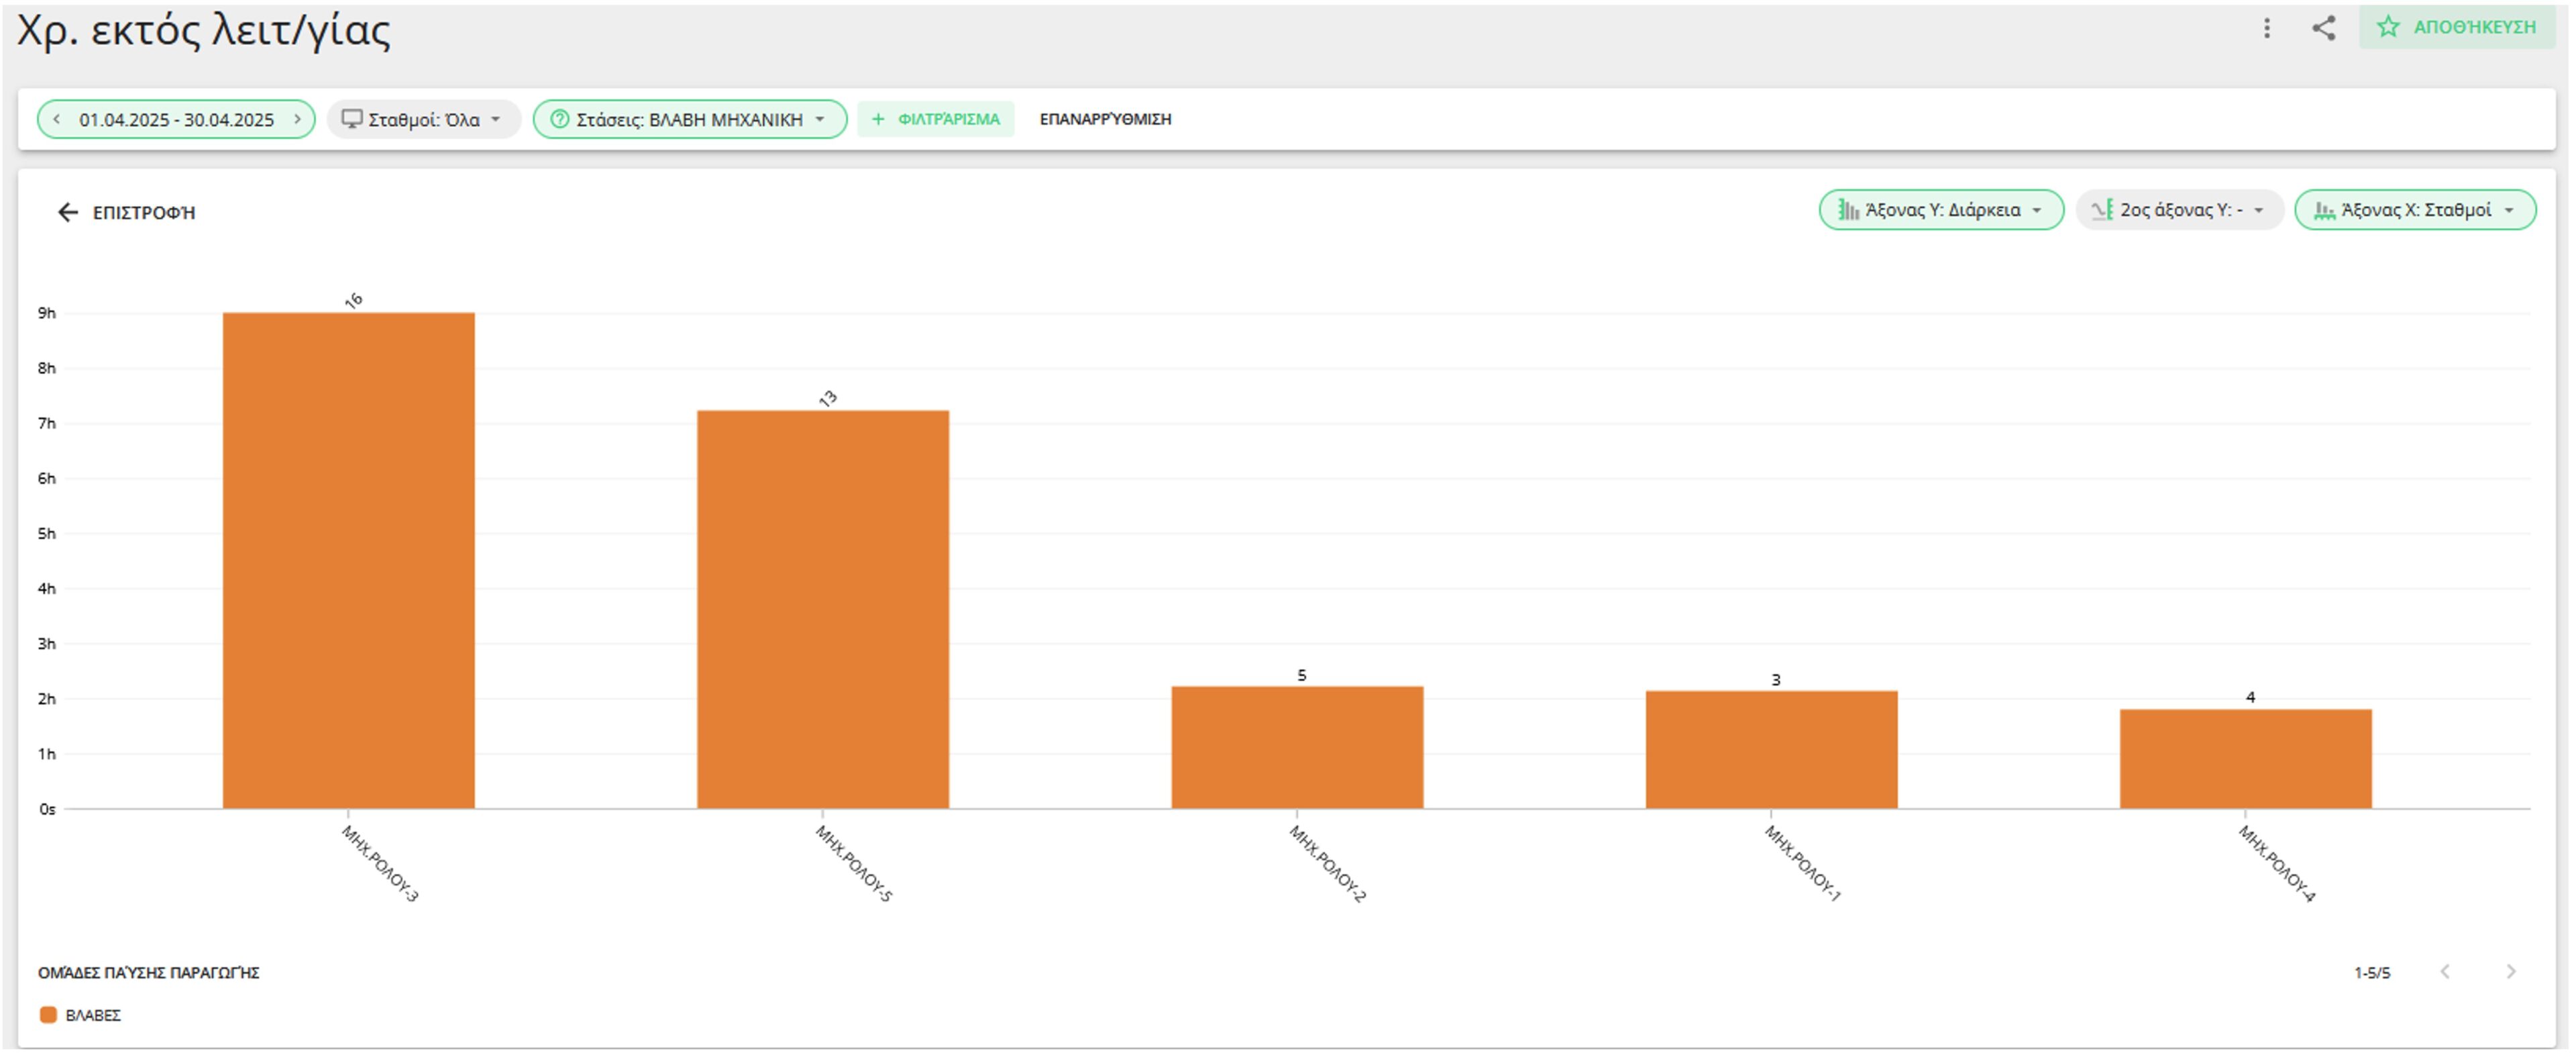
If the Technical Director knows that there were about 40 mechanical failures and the time loss was about 22 hours, the average says: 8 failures per machine with an average duration of 4.5 hours per machine. The reality is that one machine had 16 failures with a loss of 9 hours, while another machine had 4 failures with a 2-hour loss. Comparative evaluation between the two machines can provide the push for corrective actions.
5. Product Changeovers by Operator
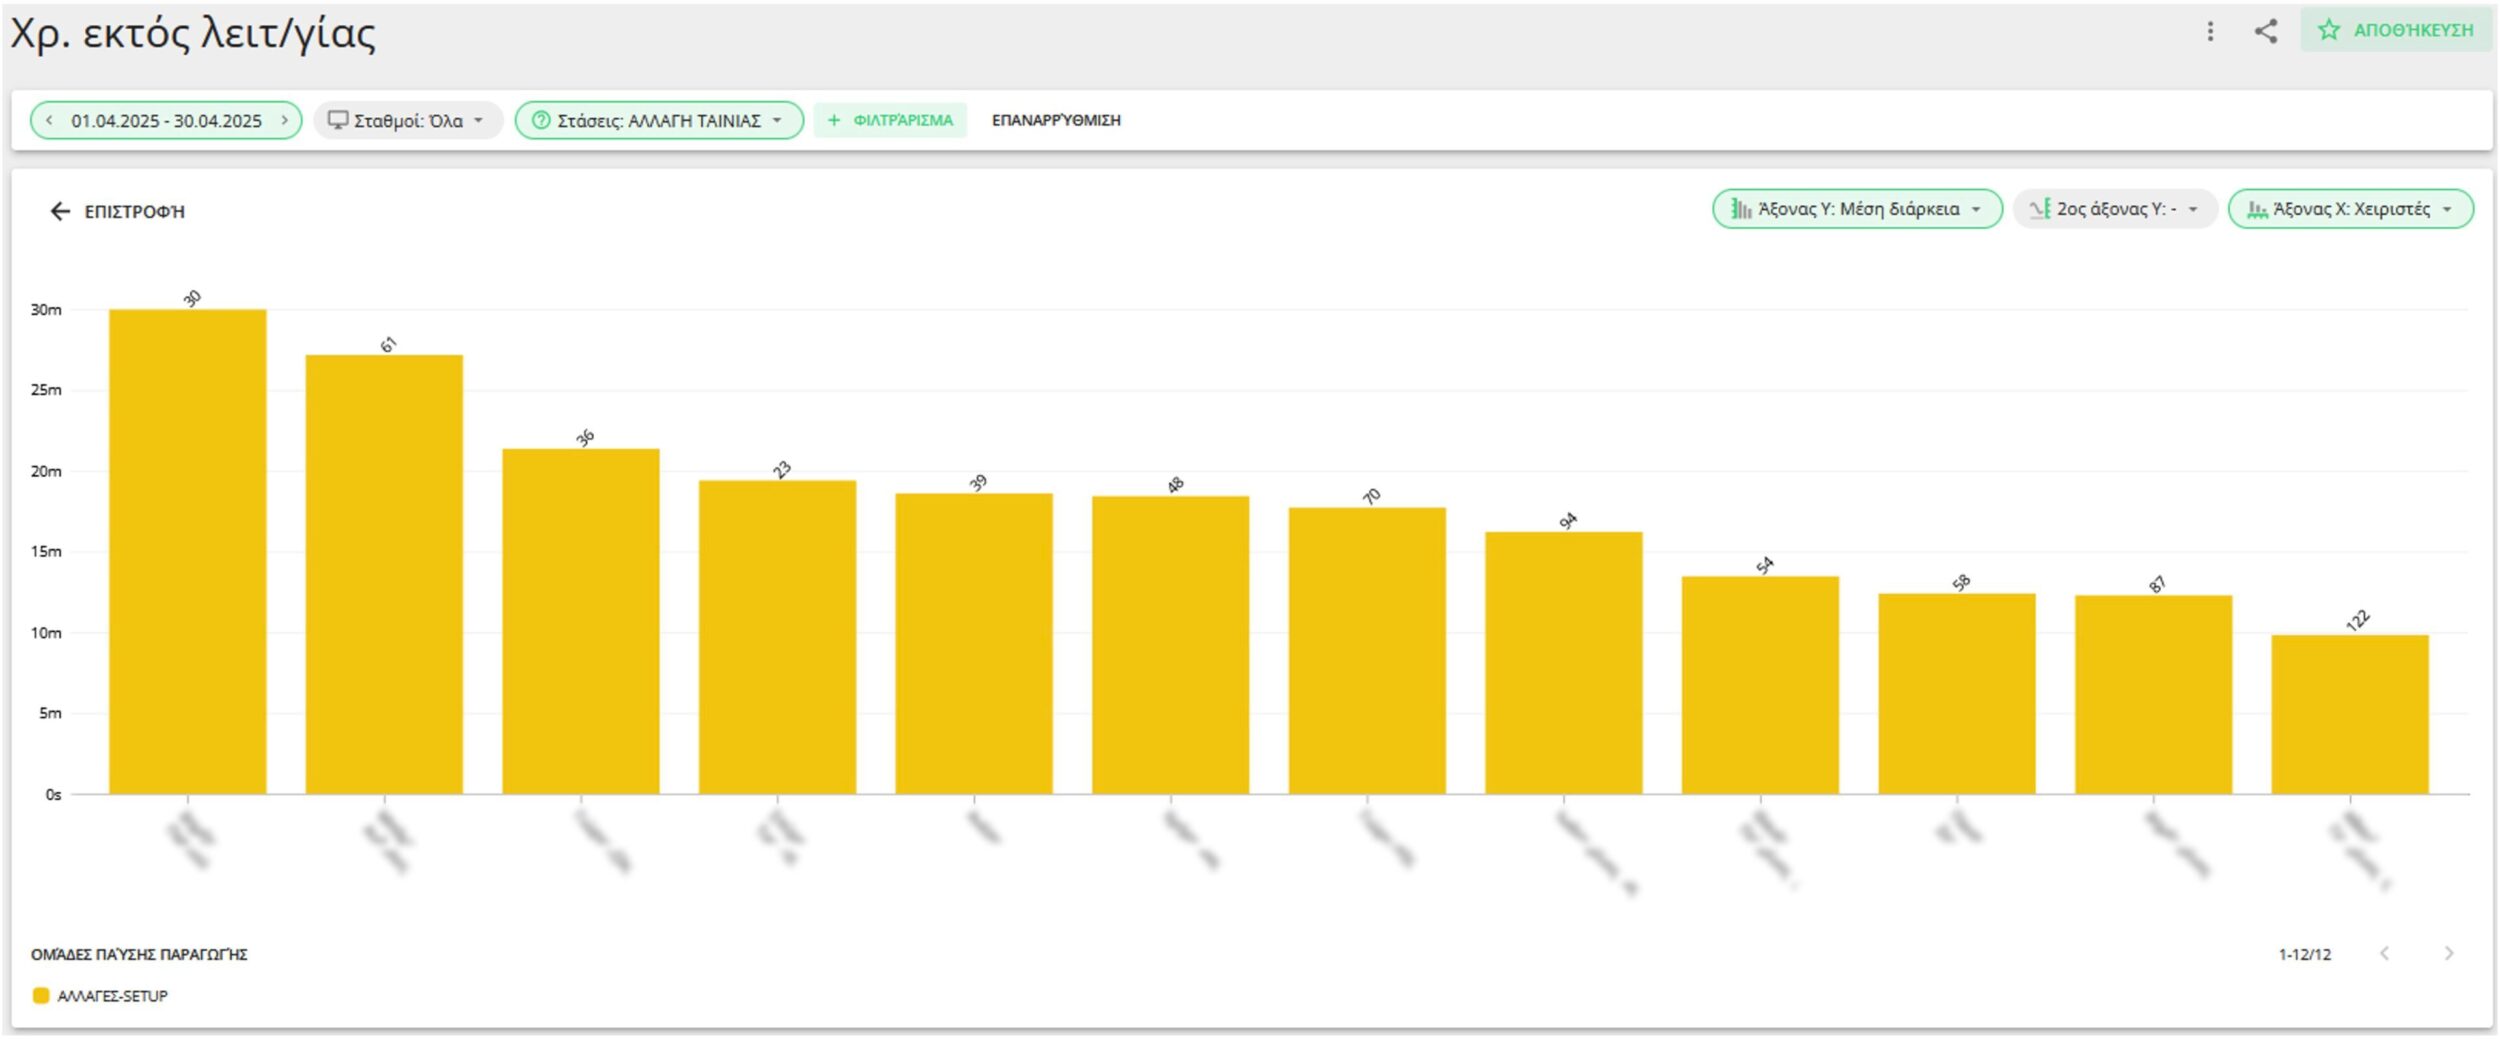
If the Continuous Improvement Manager knows that there were 722 product changeovers with a total duration of 198 hours, the average suggests 48.2 changeovers per operator with an average duration of 16 minutes. The reality is that one operator made 30 changeovers with an average duration of 30 minutes, while another operator made 122 changeovers with an average duration of 10 minutes! It is clear that the first operator requires training with an SMED (Single-Minute Exchange of Die) program that can significantly reduce stop time for changeovers.
6. Performance by Product
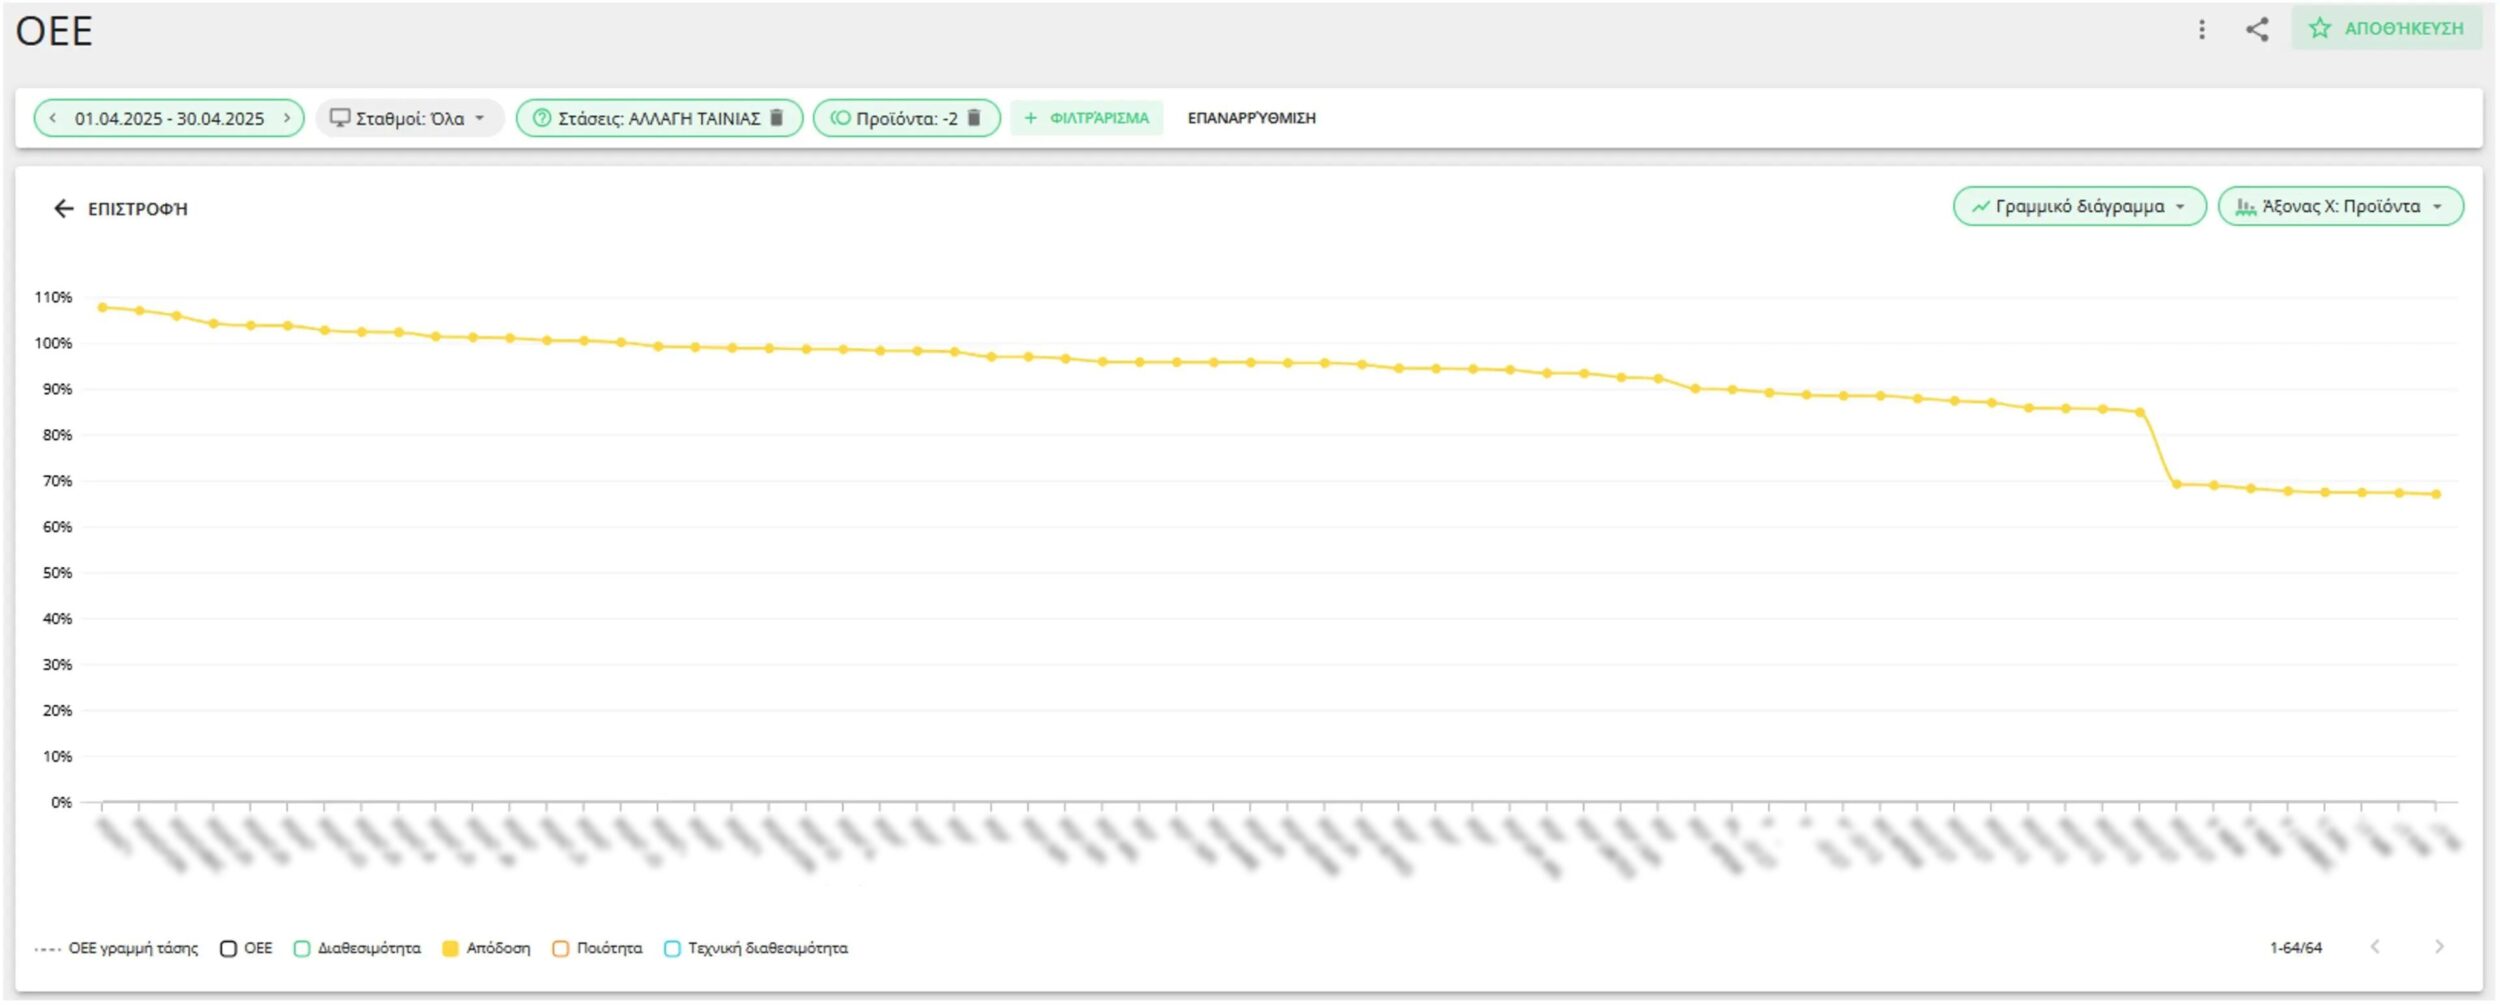
While the average performance is 94.2%, it appears that some products are produced with a performance close to 100%, while others are produced with a performance of 67%. If the entire Production team examines the reasons for the low performance of certain products, they will easily identify the steps for their improvement.
7. Quality by Product
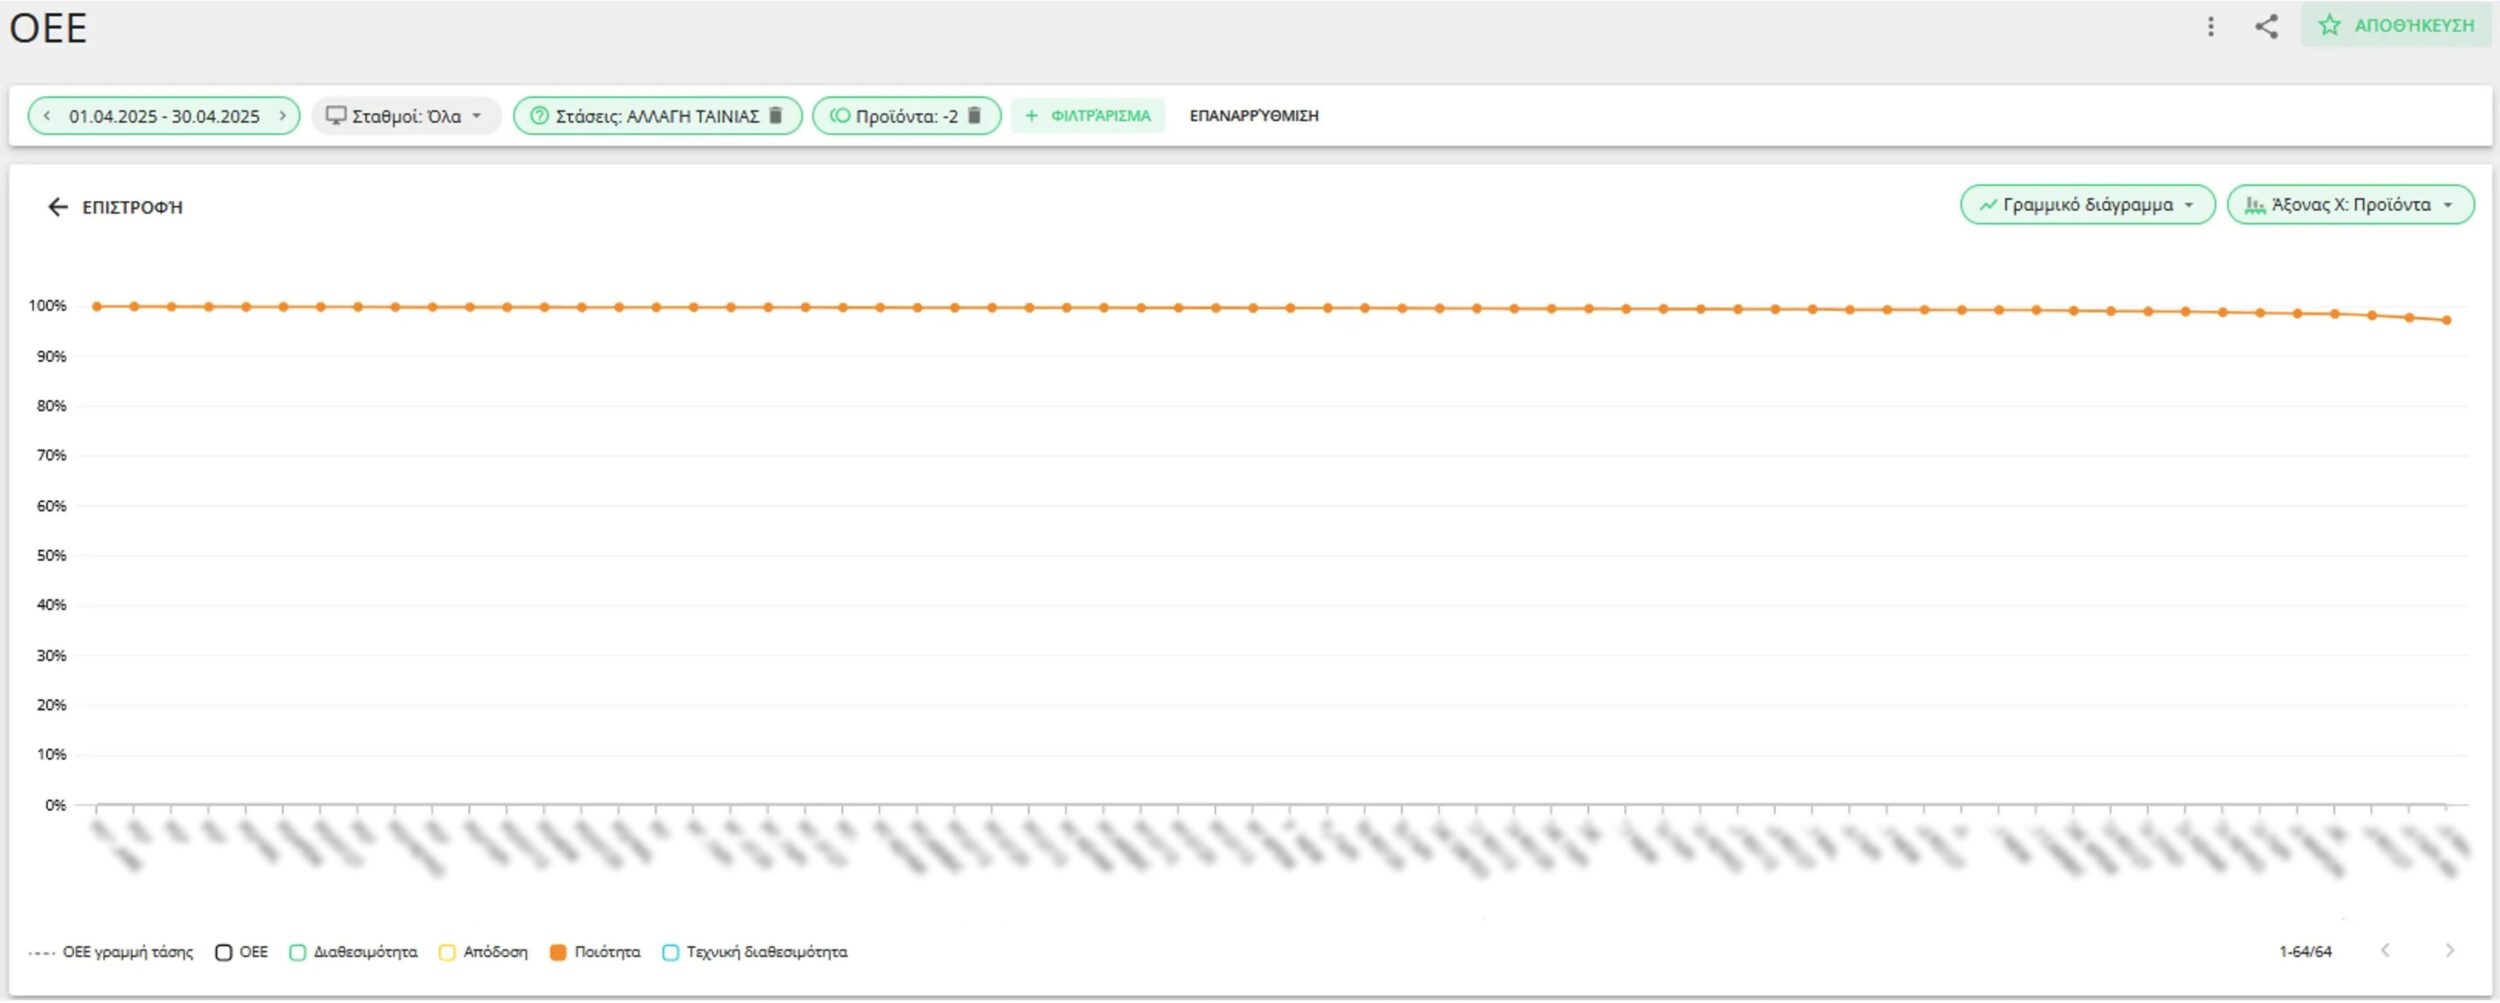
Quality Control may be satisfied with the average quality of 99.5%, which means 0.5% scrap. However, they may find that this average is composed of products with a yield of 99.9% and products with a yield of 97.1%. Since the production capabilities reach 99.9%, it will not be difficult to identify the reasons that lead to 97.1% and eliminate them.
Key Takeaways
The entire analysis above, given that it is conducted on our own data and not external data, includes the certainty that if there are specificities, for example, if one line is older, or one product requires an additional process, or an operator is new and untrained, they can be taken into account safely.
With what we have seen above, it has become clear that if we monitor our own production activity in the right way, we can utilize our own primary data for Benchmarking. We easily identify the most efficient production line, the most effective operator, and the easiest (and most difficult) product. Even if we have one production line and one operator, we can utilize the data per shift. We will find that our best shift had an OEE of, say, 80%, and we will set that as a goal. At the same time, by appropriately utilizing this data, we contribute to the improvement efforts of all departments. Finally, with the same data, we also evaluate the effectiveness of corrective actions.
Suppose the above seems like a “mountain” to you and you believe that reaching this level requires months for software installation and then expert scientists to analyze big data and use AI, along with significant investments. In that case, we can inform you that with the selection of the right application, it takes only a few minutes and minimal investment. Within the first few weeks, you can perform any analysis yourself without requiring specialized knowledge or complicated tools. We have seen it happen during the Evocon Free Trial! The entry into Industry 4.0 can be immediate!