 Enterprise Package
  Integrations
  Security
  Hardware
 How Evocon Works
  OEE Monitoring
  Increasing Productivity
 OEE Calculator
  Evocon
  Join us
 Overall Equipment Effectiveness (OEE) is one of the most popular metrics in manufacturing. It offers a straightforward formula to assess how well your manufacturing process is performing. But here’s the truth: OEE is also one of the most frequently manipulated metrics on the shop floor, sometimes intentionally, often unintentionally.
For many managers, performance bonuses are tied to OEE. Even when they’re not, a high OEE score creates a sense of success. That’s why there’s a strong incentive across the industry to inflate OEE figures — and why you should approach OEE scores, especially unusually high ones, with a healthy dose of skepticism.
In this article, we’ll explore three of the most common ways OEE gets manipulated and share the red flags to watch for so you can trust the numbers you’re seeing.
What Is OEE, Really?
OEE measures how effectively a piece of manufacturing equipment is used, based on three components:
- Availability: What percentage of the scheduled time is the equipment actually running?
- Performance: How fast is the equipment running compared to its maximum capable speed?
- Quality: What percentage of parts produced are good the first time?
OEE = Availability × Performance × Quality
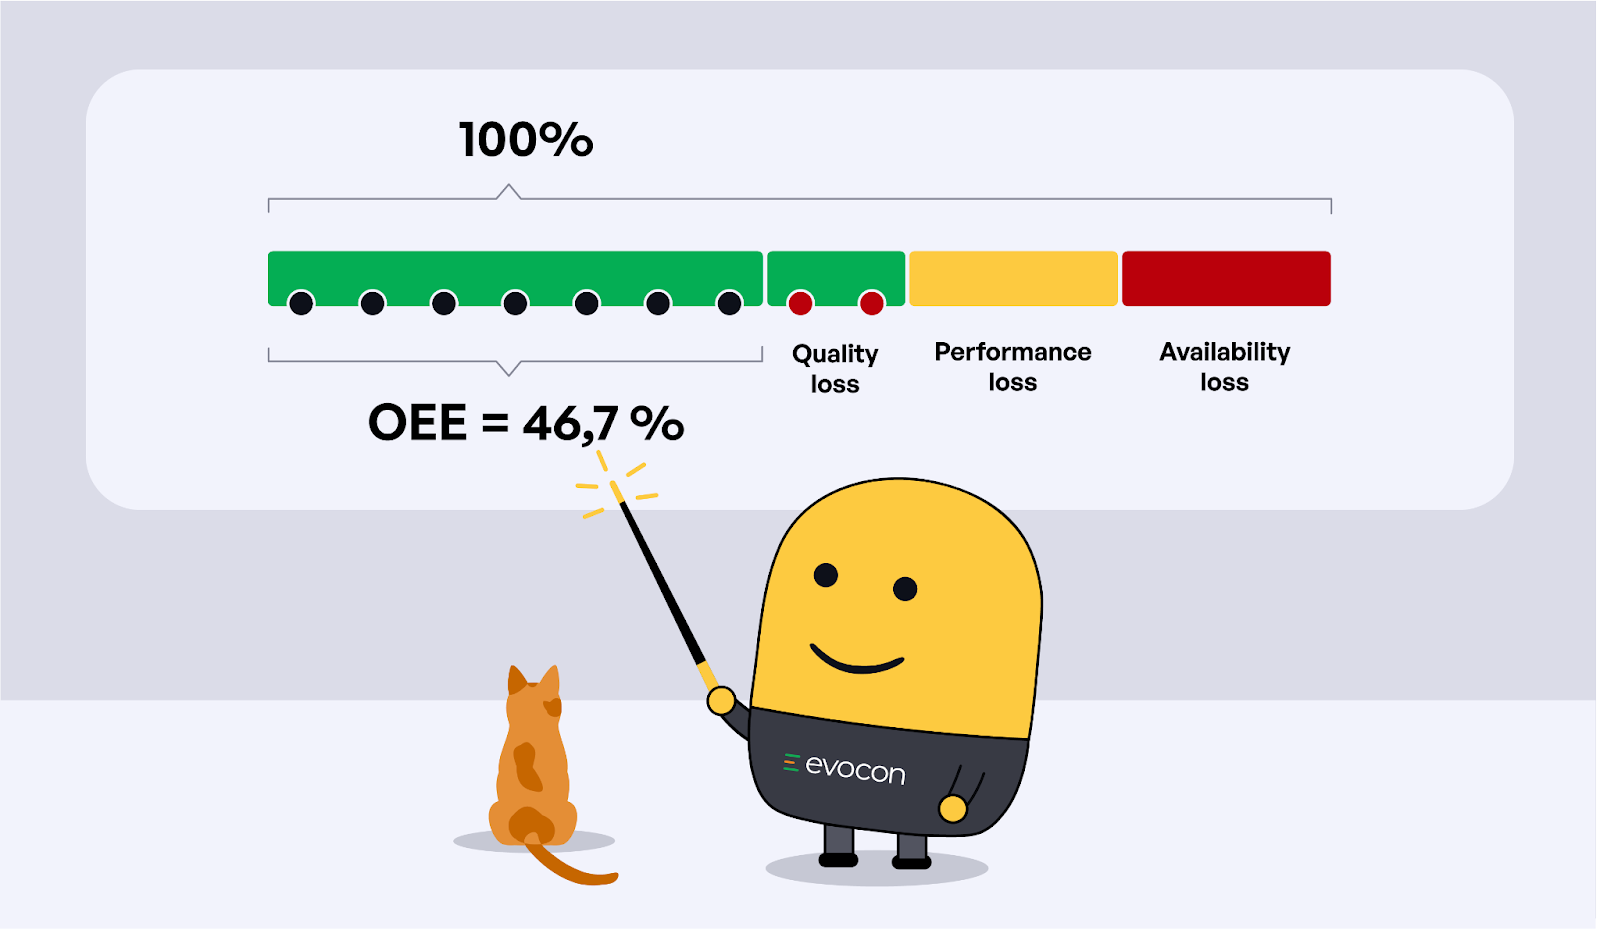
In simple terms, it tells you what portion of production time is being used to make good products, as quickly as possible, without interruptions.
Learn more: Watch a video on OEE: What It Is and How to Calculate It
1. Manipulating the Time Base
The time base is the starting point for calculating availability and it’s also the easiest place to manipulate. If you reduce the total “scheduled” time, even mediocre performance can look great.
Common manipulation tactics:
- Excluding scheduled maintenance from the available time
- Ignoring breaks, especially if production continues in some form
- Labeling unplanned stoppages as “scheduled downtime” to avoid counting them as losses
- Not including setup/changeover time
- Excluding overtime, even when machines keep running after a normal shift
Each of these tactics can inflate your OEE by 5–15% or more, without any real performance gains.
2. Manipulating the Speed Baseline
Performance is measured against the equipment’s “Maximum Demonstrated Rate” (MDR) — the highest reliably achieved speed. But this benchmark is highly susceptible to manipulation.
How the speed baseline gets skewed:
- Using the average speed of a “good day” as the MDR, even though it still includes losses
- Referring to outdated speed benchmarks, despite recent process improvements
- Underestimating operator capability, especially when performance targets are tied to bonuses
- Padding standard cycle times with built-in allowances for “unforeseen delays,” particularly when using predetermined motion systems like REFA or MTM
The result? You might see “performance” scores of 110% or more — a physical impossibility. That’s a sign your speed baseline has been artificially lowered.
3. Manipulating the Count of Good Products
Though it’s harder to fake production output, quality numbers still get manipulated. Tactics include:
- Falsifying production counts, especially when there’s no cross-check or system validation
- Assigning output to favored operators (“hero workers” or Stakhanovism) to boost personal metrics
- Failing to record rejects — or worse, counting bad parts as good
Quality issues are often the hardest to track accurately. But when they’re missed, OEE is significantly distorted.
Real-time OEE Software
Discover the true potential of your factory. Free for 30 days.
What Real OEE Looks Like?

When done right, OEE reveals the real story of your operations — strengths and weaknesses alike. The reality? Most factories are far from perfect.
Here’s what honest benchmarks typically look like:
| OEE Score | What It Really Means |
| 50–70% | Typical, real-world OEE in many industries |
| Up to 85–90% | World-class performance — rare, but possible |
| Over 90% | Red flag — likely the result of manipulation |
| >80% (some sectors) | Sectors like plastics may hit this legitimately |
Bottom line: Any score above 90% deserves serious scrutiny.
Why Transparency Matters
Manipulated OEE helps no one. It masks problems, builds false confidence, and blocks improvement. Yet, we regularly see factories reporting OEE scores of 90–100%, numbers that don’t hold up under scrutiny.
At every Evocon implementation we’ve done, using automated, real-time tracking of all three OEE components, we see the same pattern:
Real OEE is often up to 50% lower than what the factory had been reporting.
And the best part? Once leadership sees the true performance, they act. We’ve seen teams go from shock to improvement, raising true OEE by 30–80% within months, simply by working from accurate data.
Case Study: Papoutsanis Digitizes Production With Evocon and Increases OEE by 30%
Final Thought: If It Seems Too Good to Be True…
It probably is.
OEE is a powerful tool, but only when it’s honest. The moment you use it to look good rather than to getting better, it loses all value.
The most successful factories aren’t the ones with perfect numbers — they’re the ones with accurate numbers and the courage to improve from there.