Decades of technological development in manufacturing have made operations more complex and multi-layered. We must digest a striking amount of data, generated at all production levels. Workers and managers need tools to quickly identify key insights and spot opportunities for growth. It is in this context that production data visualization, as an approach to knowledge creation, can change the game and significantly improve OEE, productivity, and profitability.
Bringing Production Data Visualization to Manufacturing
With a design-savvy application of ICTs, we can make visual cues speak louder than tables, and to a wider audience. That is why Evocon deploys user-friendly visualization techniques with one goal in mind – enabling manufacturers to make the most out of their production process, from shop floor operators to top-level management.
But how does production data visualization improve workers’ engagement to boost knowledge creation?
The Long-Standing Quest for Meaning in Numbers and Data
For millennia, humans have sought the most diverse strategies to develop an understanding of the world around us. And as society and the economy became more elaborate, the main source of insights about the surrounding reality was deemed to be based on accurate information generation and collection. In this light, we should see data as a vocabulary that emerged and evolved rapidly throughout the past three centuries. But learning and spreading the use of such language is a whole different matter.
Visualization, indeed, is part of a wider mission – allowing more people to consciously report and understand information about the reality we live and work in. For example, today’s legacy in data (re)presentation has a lot to owe to the quest for sense-making of 18th-century statisticians and civil engineers.
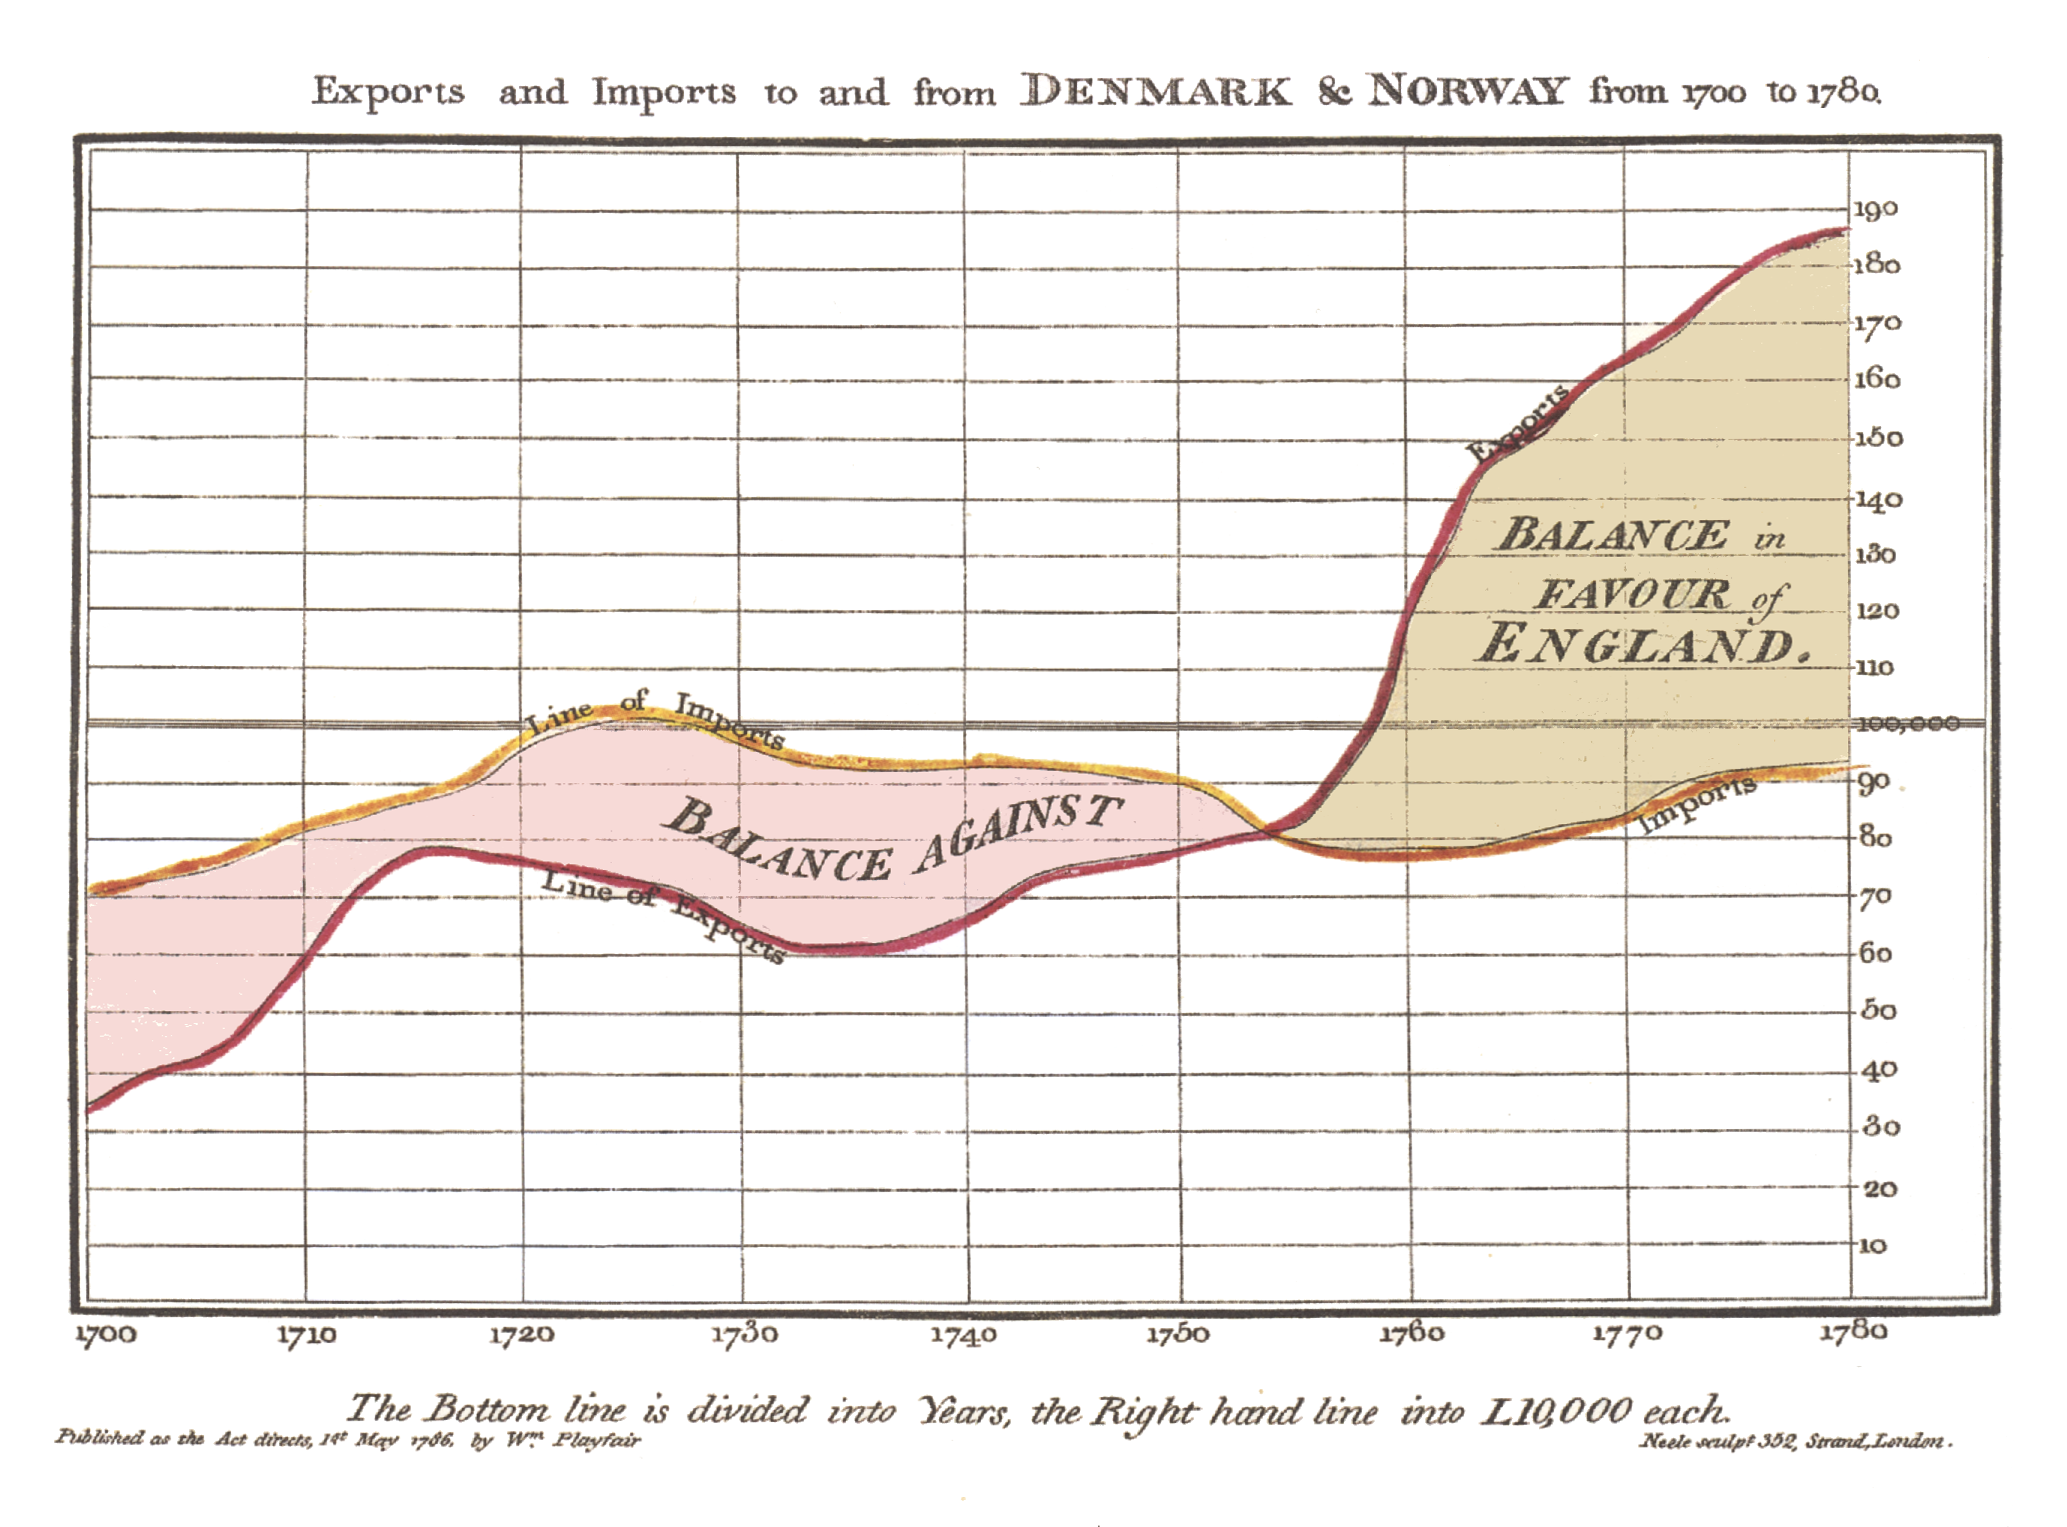
In the United Kingdom, William Playfair designed the first time series graphs on macroeconomic indicators under different ruling monarchs over 250 years of history.

In the following century, doctors Robert Baker and John Snow (GoT fans here? Common name, yes) visually mapped the spread of cholera across the districts of Leeds and London to understand how to tackle the disease. In France, Minard used bar graphs to chart the transportation of commercial goods along trade routes, or Napoleon’s losses after the campaign of Russia through colors and bandwidth.
They all pursued the same goal: making data speak to the eyes. They all flirted with the same idea we find so valuable today – that “every picture tells a story”. This is actually from Rod Stewart and his 1971 album, but we can leave this aside for now.
Don’t Underestimate the Power of Visualization
Two reasons tell us why data should be presented in the most user-friendly way possible. First, the scale of information to analyze, particularly in sensitive and core economic sectors such as manufacturing and industrial production. Furthermore, the need to provide efficient time-sensitive responses to performance issues or downtime is also crucial.
Ease of understanding and engagement
Production data visualization fosters ease of understanding and engagement, two core determinants of workers’ efficiency in industrial production. To this end, Evocon empowers manufacturers as an essential tool to improve OEE. It allows workers to actively participate in the production process as knowledge creators and reporters. Then, by having access to such detailed first-hand information, employers can take the required steps to maximize productivity and machine utilization.
Research shows that the collection, transformation, and presentation of data in visual forms help navigate the life stages of production more efficiently. Workers explore and understand information using interaction techniques, while managers have the necessary knowledge base for informed decision-making. Visualization activates natural visual and spatial abilities and improves engagement, supporting factory workers across all skill levels when evaluating complex sets of information.
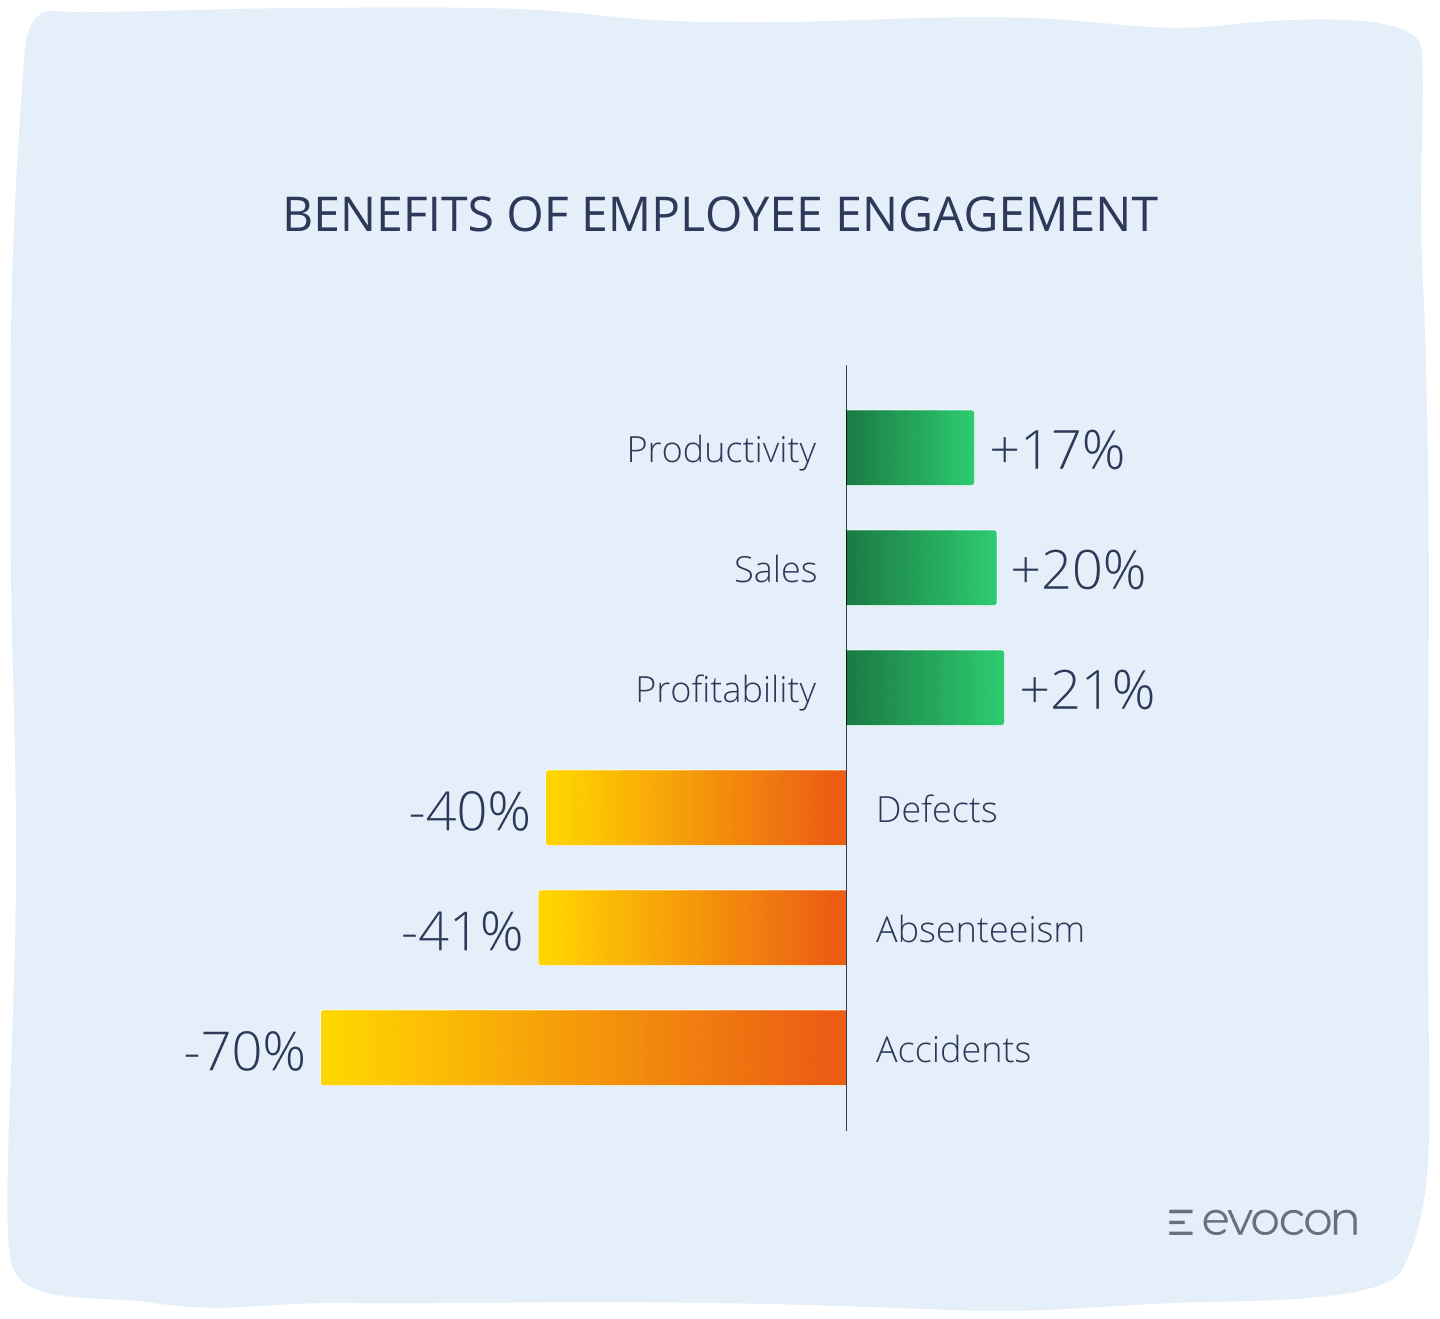
Evidence from the United States draws a clear picture of the matter. When companies manage to keep their employees engaged, gains in productivity (+17%), sales (+20%), and profitability (+21%) are impressive. Factory life satisfaction also increases, with fewer defects (-40%), lower absenteeism (-41%), and fewer safety accidents (-70%).

Within an OEE framework, this is music to the ears. Evocon helps you track and intervene in overall factory performance, reaping the benefits of an easy-to-use production data visualization tool for knowledge creation.
Visualize Your Production Data
Sign up for a free 30-day trial to discover how visualized production data can enhance your factory's performance.
Does Visual Cognition Really Work?
The same Gallup poll shows that only 33% of employees are engaged in their work, while the rest is either openly disenfranchised or unresponsive. With managers seeking to change this long-standing trend, many have turned to Evocon. Manufacturers want a tool that would automate the collection of production data and visualize it so that everyone in the company can understand it.
Understand downtime and improve OEE
Manufacturers deploying Evocon report improvements in OEE performance between 15% and 20% in just a few months. How did they achieve this? By mobilizing the power of knowledge and engagement, facilitated by Evocon. International industrial players such as Thermory, Yara, HKScan, and others highlight the user-friendliness and ease of understanding of Evocon’s design-centric approach.
“Core information about causes of losses and production stoppages is clearly presented and available to everyone in the company. As a result, workers have become actors in the problem-solving process, coming up with their own proposals for improvements,” customers say.
This way, managers can find solutions to bottlenecks faster and more effectively. All the while harvesting the benefits of making employees participative and involved.
Production data visualization – a basis for visual management
The advantages to operational efficiency coming from production data visualization, indeed, go all the way up to the top ranks of the business hierarchy.
“Without Evocon we would not have been able to realise the step-change in our continuous improvement program. Visual Management at its best.”
Aivar Künnapuu, VP Operations, Sales & Marketing, Yara International ASA
Company leaders see Evocon as “visual management at its best,” in the words of one of our clients. The intuitive and highly visual presentation of a dashboard tracking workflow, maintenance, and planning, improves internal communication across levels in the factory. Ultimately, our manufacturing data collection software becomes a valuable ally for managers to make informed decisions and boost production.
Information visualization does play a role, triggering a virtuous dynamic that leads to better industrial performance. By engaging employees at the shop floor level, factory owners place trust in their roles and skills. And when workers interact with the machine in simpler and more insightful ways, they decisively contribute to sense-building, gaining responsibility as management decision-support actors.

