OEE Calculator

1 100
1h 24h
1 7
0 100%
0 100%
0 100%

Value created per year (after expenses)

0

Profit from additional turnover (after expenses)

0

ROI year one

0
0

Return in days

0
0

How to Use the ROI Calculator?

In our ROI calculator for OEE Software and production monitoring, we look at two different scenarios.

Our first scenario (optimize cost) looks at the hourly running cost of a production machine or line and is suitable for most manufacturers to use. The second scenario (maximize output) looks at a situation where you have a high-demand product and are running at your current maximum output.

From the calculator, choose the scenario that applies best to your situation and calculate the expected ROI for your company using Evocon.

If you are unsure, look at the examples for both scenarios.

What are the variables?

The variables to enter into the calculator depend on the scenario you use to calculate ROI.

Below is an explanation of the variables in both scenarios.

  • Production days per week. How many days per week do you schedule your machines to work?
  • Working hours per day. How many hours per day do you schedule your machines to work?
  • The number of machines to monitor. How many machines are you looking to monitor? Learn more: How Evocon licenses work?
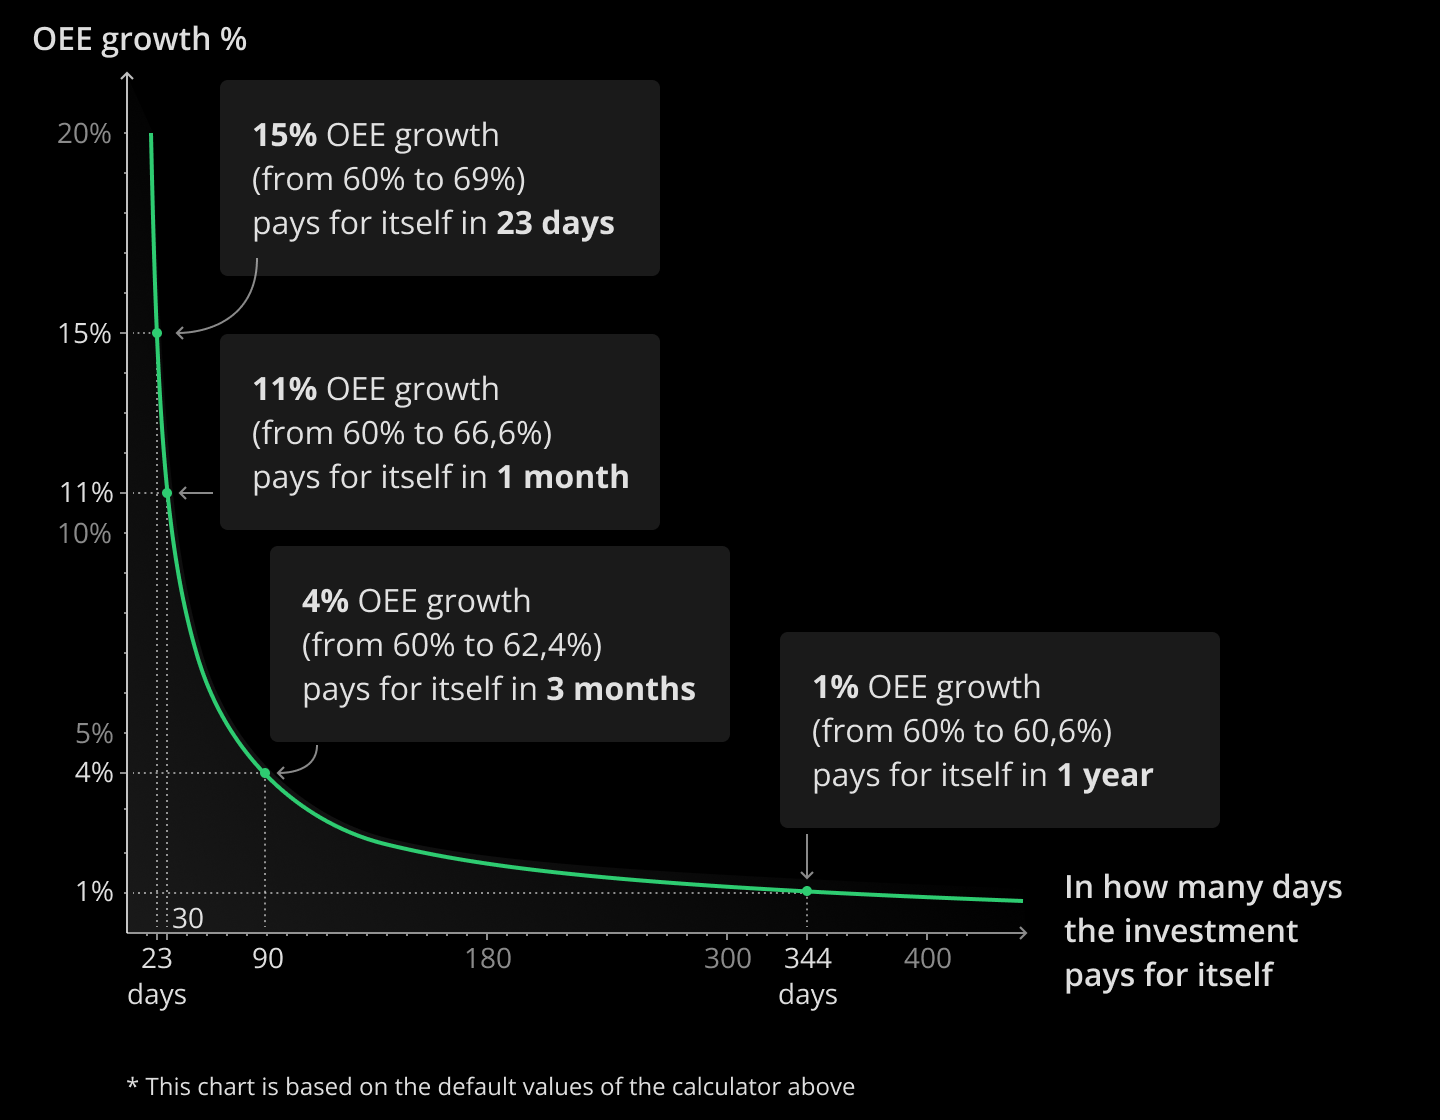
  • OEE growth %. By default, this is set at 15%. At Evocon, we have found that this is the minimum that new clients can expect on average. See below how we calculate this
  • Average hourly running cost of one machine (optimizing cost)
  • Yearly turnover (maximizing output)
  • Variable cost ratio % (maximizing output). By default, this is set at 55%. You can calculate your variable cost ratio by dividing variable costs with net sales.
  • Baseline OEE. For the sake of simplicity, the calculator sets the baseline OEE at 60%. If you know what your current OEE is, you can change this. Otherwise, you can use the default value.

What costs are used in the ROI calculation?

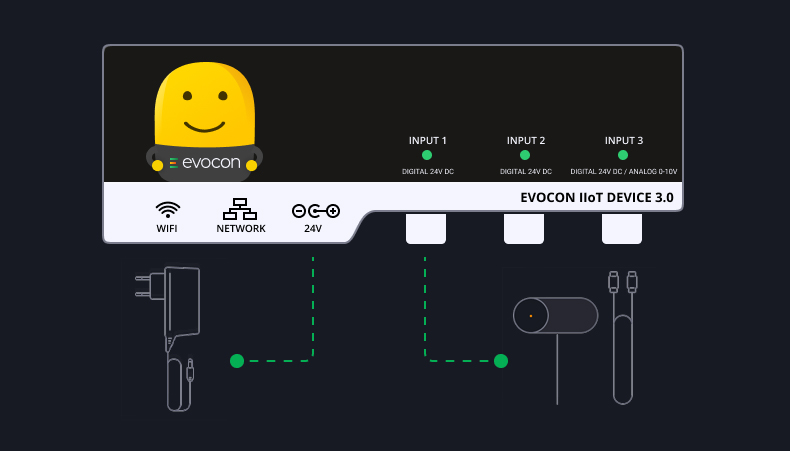
Our ROI calculator for OEE software takes into account the following costs related to implementing Evocon:

The calculation also includes investment into displays (e.g. iPad or PC) that the client sources based on their specific need.

The calculation does not consider the time invested in setting Evocon up in your factory.

Note: Maintenance and support fees are included in the monthly license fee of Evocon.

Hardware-free implementation

Implementing Evocon as a hardware-free solution is also possible, thus eliminating all hardware-related costs and increasing your ROI.

How to read the ROI calculator?

You get different outputs depending on the scenario you use to calculate the ROI of Evocon’s OEE software.

Here is a quick explanation to understand what is behind the numbers:

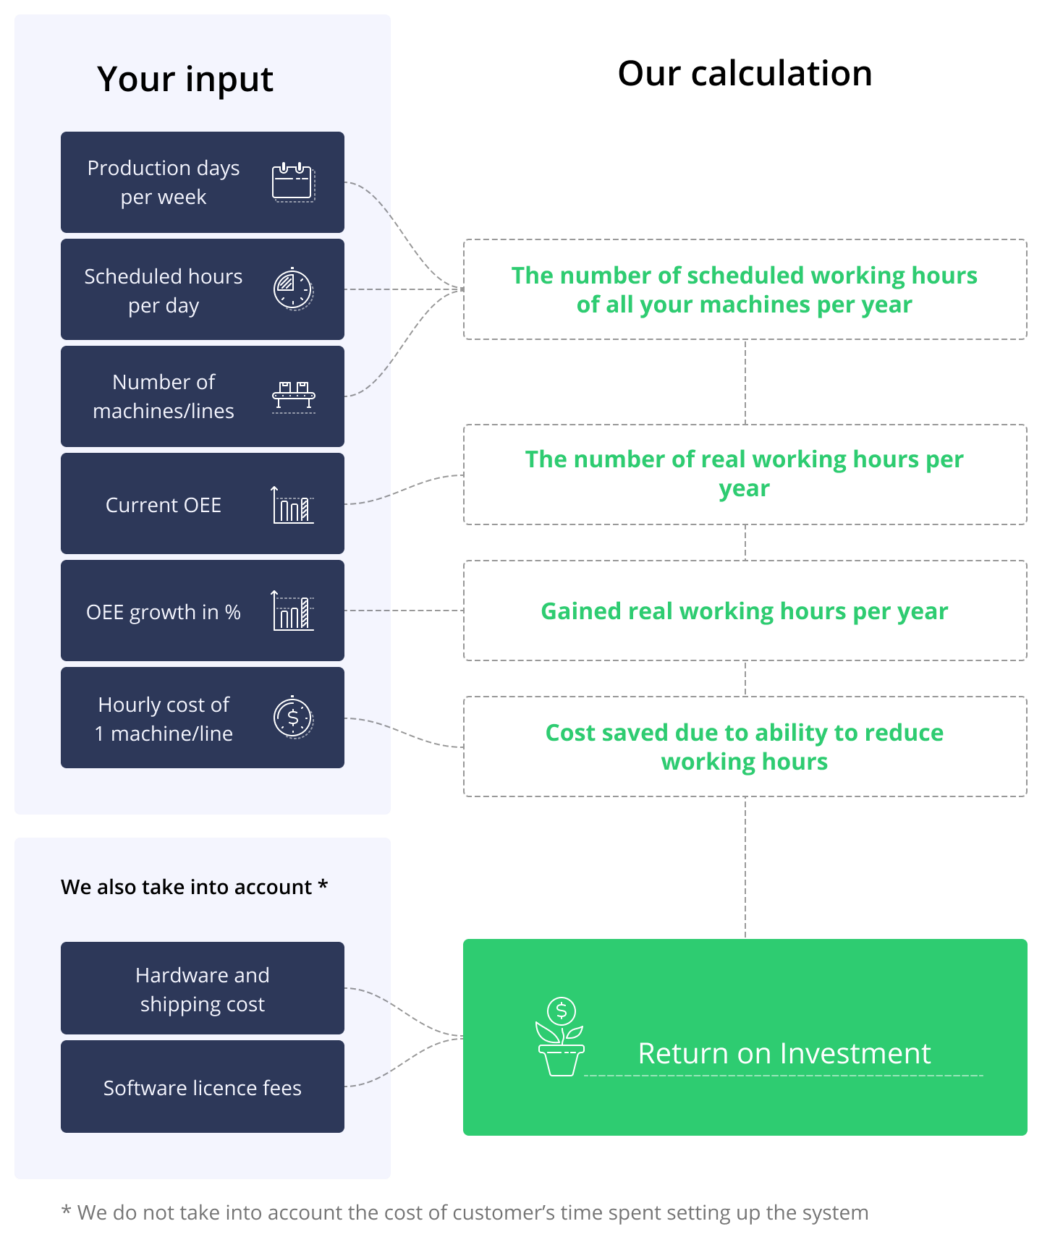
  • The value created per year (optimizing costs). In this case, we look at the costs of running your machines for a year. Then multiply it by the growth in OEE. This allows us to see what is the value created with the help of Evocon’s OEE software.
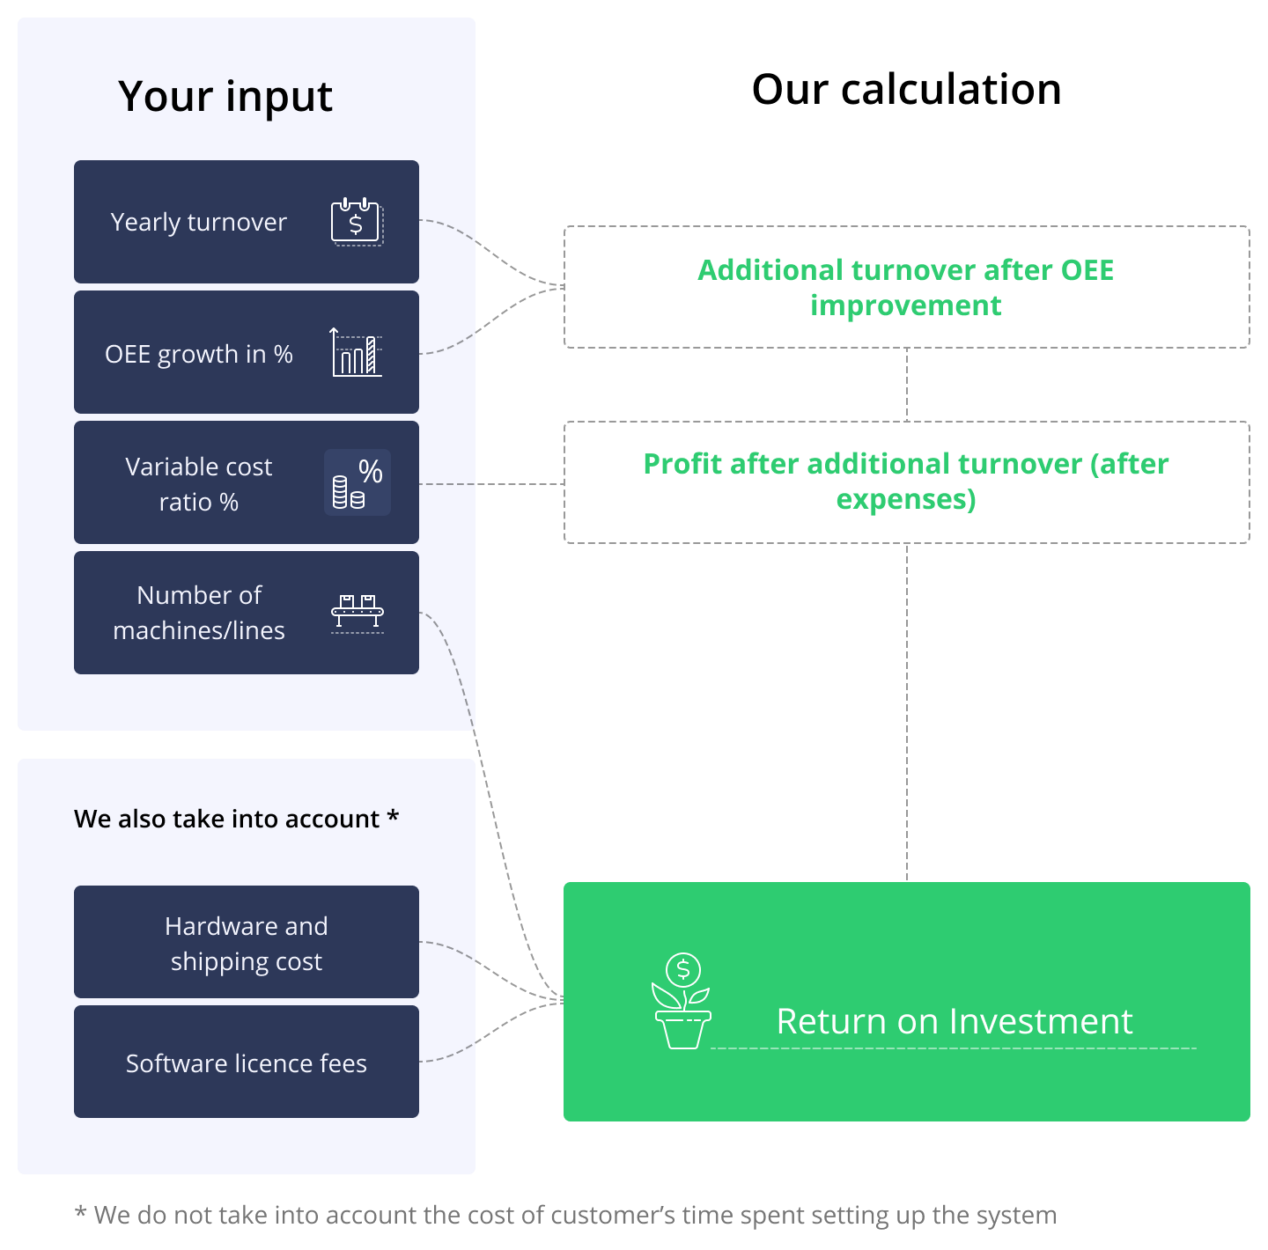
  • Profit from additional turnover (maximizing output). In this case, we look at the profit created by the additional turnover due to increased output.
  • ROI. For both scenarios, the ROI is calculated as seen below:

ROI = Value created – Investment in OEE system / Investment in OEE system* 100

  • Return in days. To calculate this, we look at expenses vs gains and divide it by the number of days in a year. Depending on the scenario, the calculation is:

Return in days = Expenses / ((Value created per year + Expenses) / 365)
Return in days = Expenses / ((Profit from additional turnover + Expenses) / 365)

ROI Calculation Examples

If you are unsure which scenario to use in our ROI calculator for OEE software or what values to enter, these two examples will give you an overview and help you make a choice.

Scenario 1: Optimizing cost – ROI of OEE software based on the hourly running cost of the production machines

In this scenario, we will look at a company that wants to optimize the hourly cost of running a production machine or line. We determine the input variables and look at how to calculate ROI based on these numbers.

How does the calculation work when optimizing cost?

Visual of the ROI calculation when looking to optimize cost.

Variables included in this scenario

  • Baseline OEE is 60%
  • We estimate that the growth of OEE is 15%
  • The number of machines to monitor is 1
  • The running cost of the machine is 95 EUR/hour
  • The machine is scheduled to run 16 hours per day and 7 days a week, which converts to 5 840 hours/year
  • Approx. hardware cost to implement Evocon – 969 EUR
  • Annual software license – 12 x 159 EUR/month = 1 908 EUR/year

Calculating the ROI

  • Valued operating time per year before 5840 x 60% = 3 504 hours.
  • Valued operating time per year after 5840 x 69% = 4 029,6 hours.
  • Gain operating time ->  525,6 hours/year.
  • Created yearly value per machine -> 525,6 h x 95 EUR = 49 932 EUR.
  • ROI for the first year = 49 932/(969+1 908)*100 = 1 735%.

In conclusion, if your OEE improves by 15% then your 2 877 EUR investment in the first year can turn into 47 055 EUR (49 932 – 2 877) of profit, which means that you achieve the same output as before by working 525,6h less during the year.

Scenario 2: Maximizing output – ROI of OEE software for production machine or line working at maximum output

Now let’s look at a company with a high demand for its products and working at maximum output with 7 machines. In this scenario, the growth in OEE can have a higher impact than just hourly running costs or the general profit margin applied to the extra volume.

How does the calculation work when maximizing output?

Visual of the ROI calculation when maximizing output.

Variables included in this scenario

  • Yearly turnover is 10 million EUR.
  • Estimated OEE growth is 15%
  • The variable cost ratio is 55% – material, energy, and machine maintenance cost per produced unit in proportion to net sales value of the unit.
  • Number of machines to monitor 7
  • Approx. hardware cost to implement Evocon – 5 406 EUR.
  • Annual software license – 7 x 159 x 12 = 13 356 EUR/year.

Calculating the ROI

  • By increasing OEE, we increase the output by 15% and generate additional sales of 1,5 million EUR.
  • Created value from increased sales is 0,675 million EUR.
    • 1,5 x 55% (variable cost ratio) = 0,825 million EUR
    • 1,5 – 0,825 = 0,675 million EUR of value created from additional turnover.
  • ROI for the first year = 675 000/(5 406 + 13 356)*100= 3 597%.

In conclusion, if OEE growth improves the output by 15% and the variable cost ratio is 55%, then in the case of 10 million EUR turnover, your 18 762 EUR investment generates an additional yearly profit of 675 000 – 18 762 = 656 238 EUR.

When we produce more with the same fixed costs (salaries, rent, insurance, etc.), we generate more profit per unit on the additional output because the fixed costs have already been offset, and every additional unit comes only with the price of variable cost.

Other considerations

Let’s consider your company’s alternatives if you choose not to invest in increasing OEE. In this case, your company will look at large capital investments to increase production output. These would typically include:

  • More space, land, and buildings,
  • New machinery,
  • More workers.

Thus, an investment in OEE software and production monitoring can also keep fixed costs lower.

A Common Mistake When Calculating ROI

We often see a tendency to misunderstand percentages when looking at the ROI of OEE software. This, in turn, leads to a misunderstanding in the change to the bottom line that OEE tracking and improvement brings.

To illustrate this, let’s look at an example of OEE change week over week and what it means to the business. The data is based on one of the Evocon free trials. 

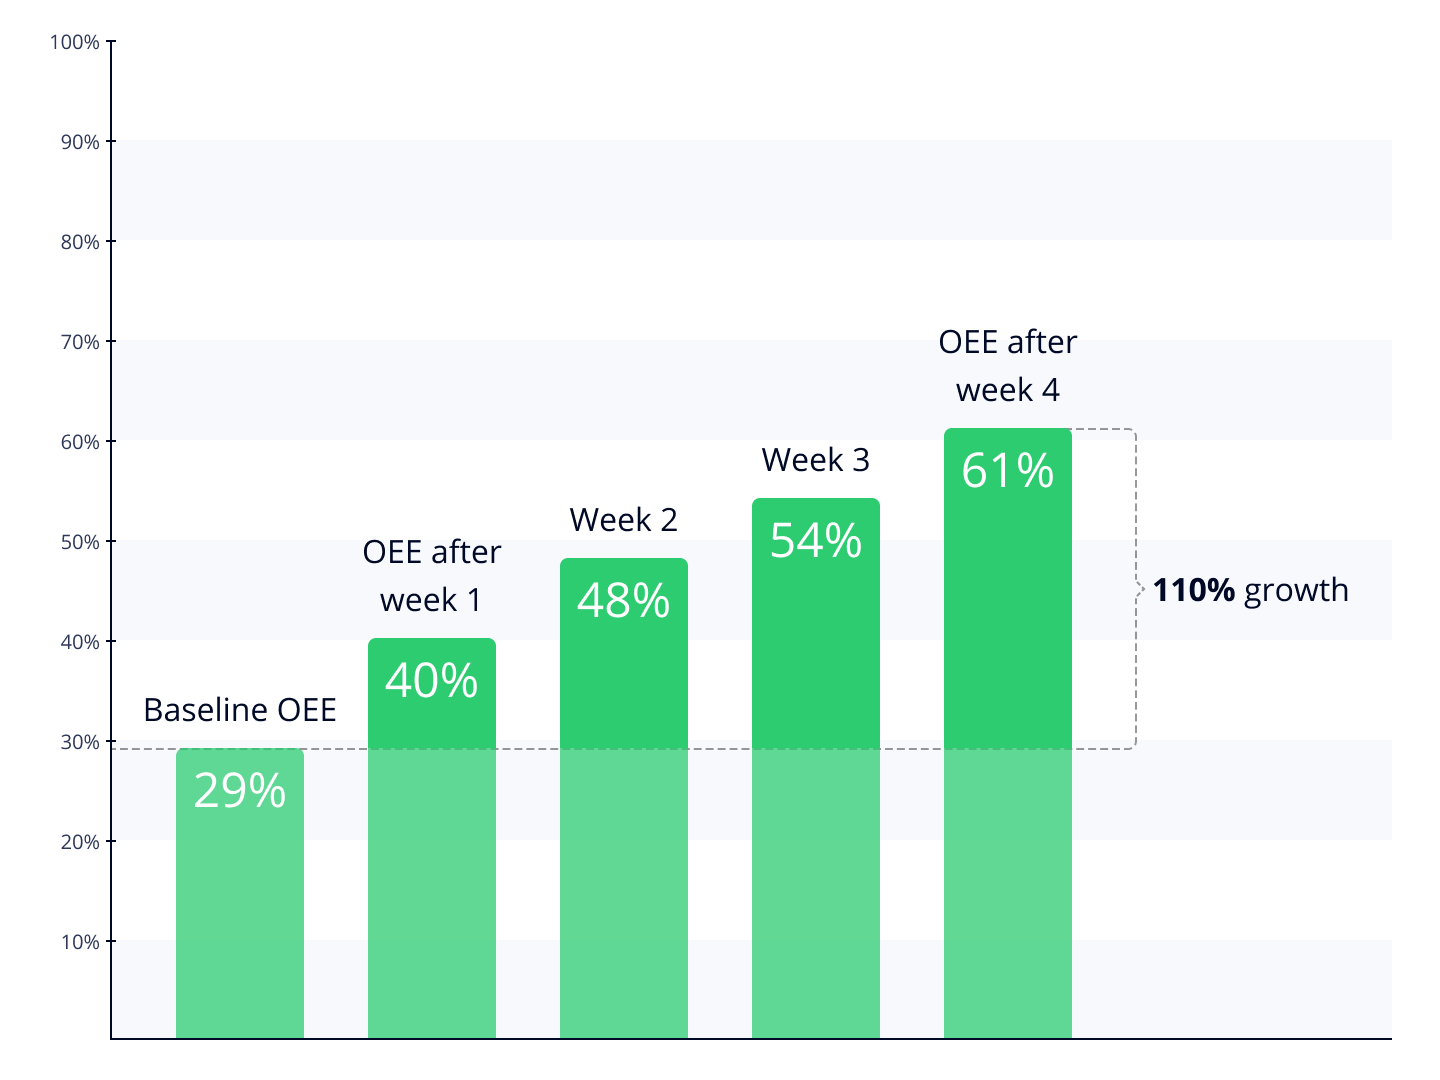
Example: OEE changes from 29% to 61%

In our example, the client started with a baseline OEE of 29%. At the end of Evocon’s free trial, the OEE reading for that machine was 61%.

So even though the OEE change in percentage points was 32%, the actual change in terms of OEE and output growth was 110,3%. When calculating ROI, this is a very big difference and something that company managers and owners must keep in mind.

Bar graph showing 110% OEE growth.

Why look at OEE growth as a metric? 

When using our ROI calculator for OEE software, you should look at your baseline OEE and the increase compared to baseline instead of the change in percentage points.

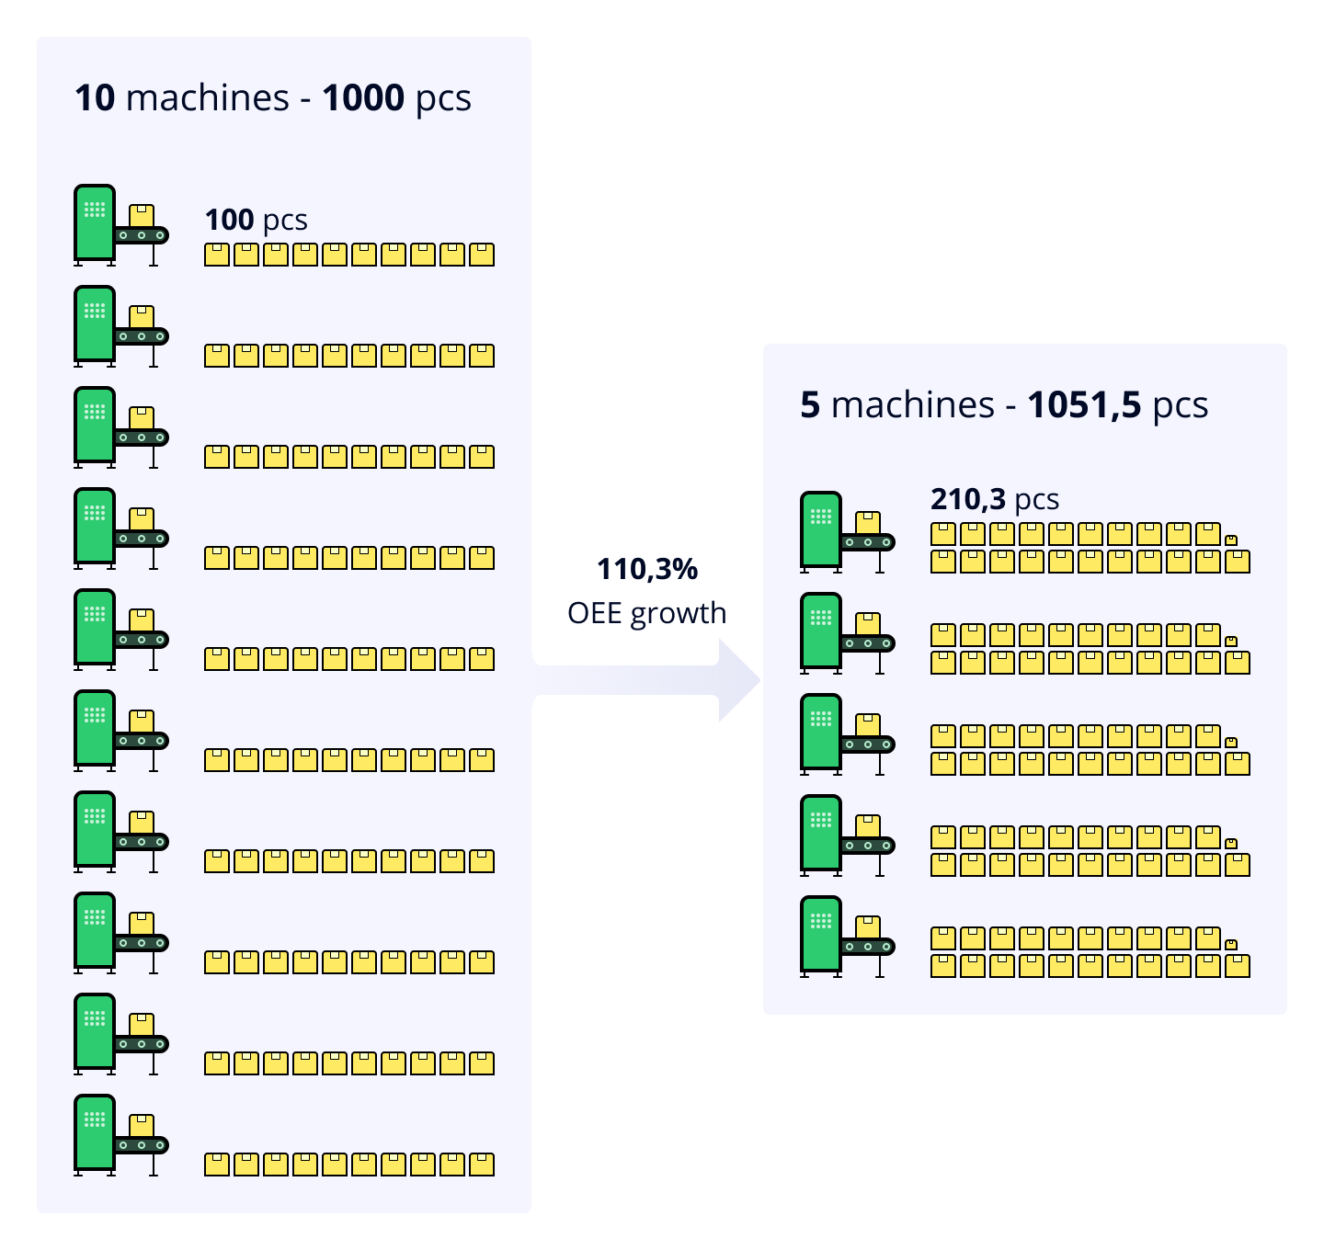
If, at baseline, you use 10 machines to produce 1 000 products (100pcs/machine), then after an OEE growth of 110,3%, you can produce 2103 products with the existing resources.

Or, to put that into another perspective, you can produce 210,3 pcs/machine after the increase in OEE. In effect, using only 5 machines to reach the same output as previously.

OEE growth visualised with machines.

So always look at the big picture when you are tracking OEE and improving your production efficiency because a change in OEE from 45% to 55% can have tremendous effects on your bottom line.

Learn more: How to Calculate OEE – Formulas & Examples

Qualitative Factors to Consider When Calculating ROI of OEE Software

While ROI is a quantifiable metric, other qualitative factors can be considered regarding the benefits of investing in OEE software and production monitoring.

These benefits include:

  • Providing a means of communicating with operators based on facts.
  • Engaging operators and creating ownership.
  • Driving understanding of the importance of efficiency on the shop floor.
  • Identifying improvement projects and maintenance issues.

Other Benefits

Other benefits of investing in OEE software include a reduction of paperwork thanks to data automation and time gained thanks to automated reports that simplify production data analysis.

Overall this means that teams can get straight to the business of finding and implementing solutions. But this only scratches the surface.

Learn more: 10 Evocon Benefits for Manufacturers

Conclusion

With our ROI calculator for OEE software and production monitoring, we have presented you with two scenarios to understand and calculate ROI. We have also presented you with several qualitative measures to account for as you consider a potential investment in production monitoring and live OEE tracking.

It is important to remember that each company will be different and that the calculators are conservative in their approach.

For example, while our experience shows that clients can expect an average of 15% OEE improvement, the result can be much higher depending on various factors.

Implement OEE monitoring with Evocon

And get a quick return on your investment.

Get started