 Enterprise Package
  Integrations
  Security
  Hardware
 How Evocon Works
  OEE Monitoring
  Increasing Productivity
 OEE Calculator
  Evocon
  Join us
 In the modern manufacturing industry, achieving maximum efficiency and productivity is crucial. Overall Equipment Effectiveness (OEE) is an essential metric that helps organizations understand and improve the performance of their production equipment. By breaking down production into three core components — Availability, Performance, and Quality — OEE identifies exactly where your process is losing time and money.
In this guide, we provide a step-by-step breakdown of the OEE formula, practical calculation examples, and industry benchmarks to help you identify bottlenecks and drive operational excellence.
Quick Overview: How to Calculate OEE in 6 Minutes
Watch the video below to learn the basics of Overall Equipment Effectiveness, why it matters, and how to calculate OEE and each of its components: Availability, Performance, and Quality.
How to Calculate OEE: The Core Formula
To accurately calculate OEE, you need to multiply its three core components. This method provides a granular view of where production losses occur.
The OEE Formula:
OEE = Availability x Performance x Quality
Breaking Down the 3 Components
To solve the core formula above, you must first calculate each component. Each one represents a specific category of manufacturing productivity:
- Availability
Availability is the proportion of planned running time that is available for production.
Formula: Availability = Run Time / Planned Production Time
☝️Note: Run Time is Planned Production Time minus any Planned or Unplanned Downtime. - Performance
Performance is the actual throughput of the plant during the time it ran, compared to the maximum throughput that it could have achieved running at the “Maximum Demonstrated Rate” (MDR) or Ideal Cycle Time.
Formula: Performance = (Ideal Cycle Time x Total Count) / Run Time - Quality
Quality is the proportion of actual production throughput that meets the customer specification exactly and is right the first time.
Formula: Quality = Good Count / Total Count
Use the tool below to see how these three components interact. Notice how even a small dip in one factor can significantly lower your total OEE.
 This graph is interactive! (drag the dashed --- lines)
Understanding the “Why” Behind the Numbers
Calculating your OEE score is only the first step. To improve it, you need to identify the specific root causes of your productivity gaps.
Most OEE losses fall into categories known as the Six Big Losses — ranging from equipment breakdowns and setup time to micro-stops and slow cycles.
Step-by-Step OEE Calculation Example
To understand how OEE works in a real-world scenario, let’s look at a sample production period of 252 hours.
1. Calculating Availability
Machine availability is the time your machines are actually running compared to when they were scheduled to run.
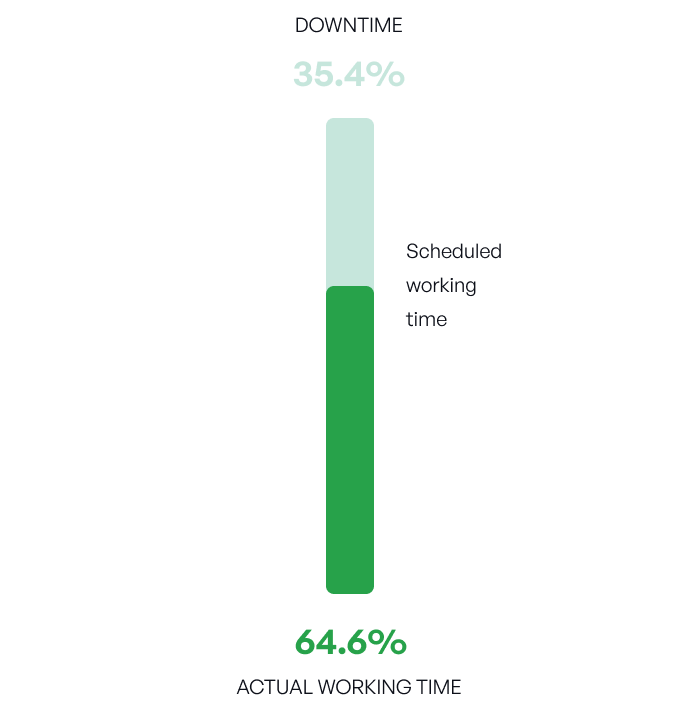
- The Data: Your total Scheduled Working Time is 252 hours.
- The Goal: You need to determine the Actual Working Time (Run Time) by subtracting downtime from the schedule.
- The Result: In this example, the actual working time was 162.75 hours.

2. Calculating Performance
To calculate performance, you need to find out how many products you produce, and how it compares to the number of products that you could produce at maximum speed during your actual (not all scheduled) working time.
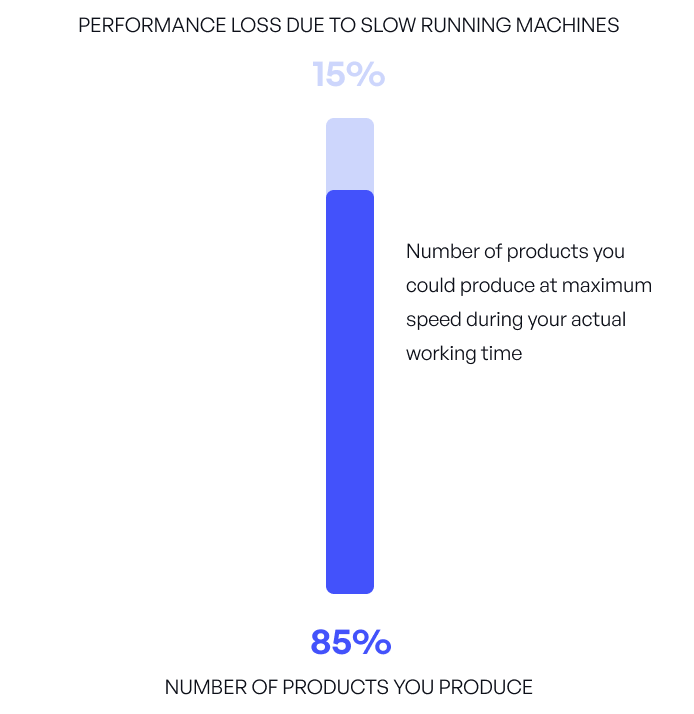
- The Data: In this example, you produced 8,300 total pieces (including any scrap).
- The Goal: Compare that to the 9,765 pieces you could have produced if the machine ran at its maximum speed during that actual working time.
- The Result: A performance score of 85%.

How do you find out your maximum production speed?
Sometimes, the manufacturer of the machine specifies it (it might also be called “nameplate” or “ideal cycle time”). If not, you can identify the fastest recorded time. Firstly, look at the machines’ performance history. Next, calculate how many products you would make if your machine ran at that speed.
If you don’t have this data, implement OEE monitoring software that does these calculations for you and gives you the data you need to manage and improve OEE.
Real-time OEE Software
Track and analyze the performance of all your production shifts across different dates, stations, factories, and countries. Free for 30 days.
3. Calculating Quality
Quality focuses on the percentage of total units produced that meet your standards. It accounts for Quality loss, which includes defects, scrap, and items that require rework.
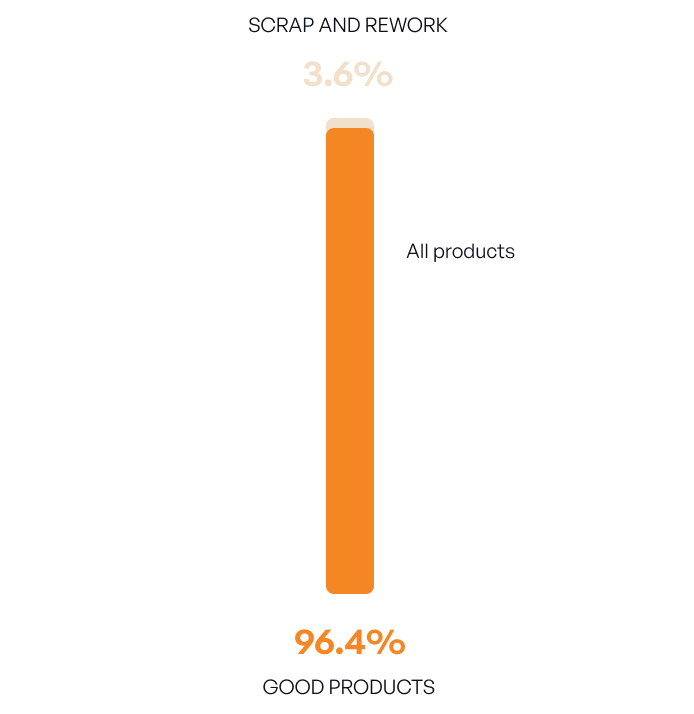
- The Data: Out of the total production run, you produced 8,000 good pieces.
- The Goal: Your “all products” count (good products + scrap + reworkable items) was 8,300 pieces.
- The Result: A Quality score of 96.4%.

4. The Final OEE Result
The power of OEE lies in how these three factors interact. When we combine the results from our example, we see the true effectiveness of the production period:
- Availability: 64.6%
- Performance: 85%
- Quality: 96.4%
Final OEE Calculation:

Note: Once you have your Availabilty, Performance, and Quality data, you can use our OEE Calculator to quickly calculate your OEE score.
OEE Calculator
Discover your hidden factory! Try our free OEE calculator to estimate your OEE and calculate its components.
Going Further: How to Implement OEE Effectively
Calculating your score is the first step; the second is using that data to drive change. To move from manual math to manufacturing excellence, follow this systematic approach:
- Define your ‘Why’. What is the core problem you’re facing that OEE aims to address?
- Nominate a dedicated OEE ‘champion’ who takes ownership of the implementation from start to finish.
- Create a pilot project monitoring a specific machine or production line. Set clear, accessible goals. Always think about how to optimize resources and improve the bottom line.
For a detailed guide, consider reading the Modern Manufacturer’s OEE Implementation Guide.
Key Takeaways
Mastering Overall Equipment Effectiveness is the first step toward a leaner, more profitable factory floor. Here is a quick summary of what we covered in this guide:
- The core formula: OEE is calculated by multiplying Availability, Performance, and Quality.
- Identify hidden losses: Breaking OEE into its three pillars allows you to pinpoint exactly where you are losing time, speed, or product quality.
- Data-driven decisions: Accurate OEE calculations provide the data needed to reduce downtime and eliminate bottlenecks.
- Continuous improvement: Regular OEE monitoring is not a one-time task but a continuous cycle that drives long-term manufacturing excellence and better business outcomes.
While understanding the math is the foundation, the true value of OEE is found in the daily insights it provides on your shop floor. Don’t let manual data entry or complex spreadsheets slow your continuous improvement journey. Whether you are just starting out or looking to refine an existing process, the right tools can turn these formulas into a competitive advantage for your business.