Machine utilization is a crucial performance indicator in manufacturing. This indicator is a ratio that measures the effective active time of a machine compared to the amount of time it should be working. Not measuring this variable can be a critical mistake for companies. After all, if your machines aren’t operating at their full potential, your factories are inefficient and losing money.
Here we will provide examples, formulas, and advice on measuring machine utilization and other critical KPIs. You’ll also find a handy checklist for optimizing machine utilization-related performance indicators.
What is Machine Utilization?
In simple terms, machine utilization is a performance indicator of how well your equipment is working.
To illustrate, let’s assume we have a fully automated bottling line capable of producing 108,000 bottles of juice daily. With the line and its machines (filler, capper, labeler, palletizer, etc.) working 24 hours per day, it means we would be producing 4,500 bottles per hour.
This 108,000-bottle threshold is our ideal estimation, and it is only valid if the line works at full capacity all the time. The reality is often different. Equipment can be off for many different reasons: training, coffee breaks, poor planning, defective materials, or internal logistics issues. These issues (whether foreseen or unforeseen) can and will limit the line’s output.
Realistically, we can expect the line to make 90,000 bottles of juice per day, running for 20 hours due to different losses. In our example, the machine utilization then is 83.3 percent for that day. To get the utilization for any other period, all you have to do is use the same principles for the time period that you are interested in. But how did we get this number?
How does your machine utilization compare to others in your industry?
How to Calculate Machine Utilization
Here we have a simple machine utilization formula:

We need to know how many available hours machines are supposed to work. For our bottling line, this number is 24. What is the machine utilization if our line runs for 20 hours a day?
(20/24) *100% = 83.3%
You can run the same machine utilization calculation with your ideal and actual output/input quantities.

(90000/108000) *100% = 83.3%
Understanding the reasons for this 16.7% gap (losses) is crucial. The above formulas simplify a multifaceted problem in which you must consider your different machines, planned downtime, unplanned downtime, and operational inefficiencies. Below, we discuss machine utilization-related performance indicators.
How is machine utilization connected to OEE?
The connection between machine utilization and OEE is direct, and in our experience when manufacturers talk about utilization, they talk about OEE but in a simplified way. What do we mean by this?
First, we must outline that machine utilization (or asset utilization) as a KPI aims to show the gap between what you are producing and what you could be producing, in other words, the potential of your machines. Or as we stated in the beginning – how well your equipment is working. The goal of OEE is to do the same. So, both KPIs have the same goal, but where they differ is the detail level of the calculations.
If we take our example above, the line that is producing juices, then all that the utilization formula gives us is what was produced and could have been produced. At the end of the day, we know that we lost 4h of production or 18 000 bottles. That is our potential. But the formula does not give us insight into what areas caused the losses so that we’d know what actions to take.
With OEE, we first determine what percentage of the 4h lost was due to different types of downtime (availability), then what percentage of the 4h was last due to slow speed or micro stops (performance), and finally, we determine what percentage of losses was due to defects (quality). The result is the same—you know that your extra potential is 18,000 bottles. But you are better equipped to make informed decisions on where to improve to actually reach that potential.
For most manufacturers, their most significant losses are related to downtime, and that is where the majority of them focus in the beginning. That’s also why, in our experience, many manufacturers, when they talk about utilization, actually refer to the availability part of OEE – the time my machines were producing compared to the time they should have been producing. Performance losses are very hard to track without an automated solution, and scrap is something that manufacturers start focusing on later in their monitoring journey.
So, if you are already tracking OEE, you know your machine utilization rate. However, one more caveat complicates things and throws confusion around the topic of utilization.
What time should I take as a basis to calculate my utilization?
No matter whether you are calculating machine utilization or OEE, you need to decide what time you consider your maximum potential.
If your factory must be producing 24/7, or if that is your goal, then all calendar time is available for production and, in effect, is your scheduled machine hours.
However, if your factory is meant to work 5 days a week and 24 hours each day, then that is your full potential. If you subtract holidays and other planned shutdowns or no-demand times from your schedule, then you further reduce your scheduled machine hours and then that becomes your ideal potential.
The point is to choose the time that best reflects your factory and process. There is no reason to use all calendar time to calculate your utilization (or OEE) if that is not realistic. Make a choice that best reflects your production process and helps you unlock your factory’s potential.
Start tracking your machine utilization
Improve your machine utilization with Evocon's 30-day free trial.
World-Class Benchmark and Ways to Improve Machine Utilization
What is a good machine utilization rate?
Perfection is almost impossible to reach in manufacturing. Often, efficiency is more about ‘good enough’ than ‘absolutely perfect.’ Machine utilization is no different than any other KPI. Acknowledging that 100% machine utilization is virtually impossible, a utilization rate above 70% indicates smooth operations and good margins.
How to improve machine utilization
Like any other KPI, there are ways to improve machine utilization. To do so, factory managers must know what happens with their machinery and act accordingly. Here is a basic checklist of actions to undertake to improve machine utilization.
- Establish a baseline
The first step in improving machine utilization and production quality in manufacturing is to know your current machine utilization rates. Once you have gathered the necessary information, you know your machines’ performance during productive hours against scheduled hours. The data you collect will give you a baseline to inform future decisions. - Collect data using the right tools
In many companies, manual tracking and paper-based records are time-consuming and prone to mistakes. In addition to taking time, individuals can’t detect minor problems in production or issues within the machine.
In a previous case study with HKScan, one of the biggest manufacturers of meat and food products in Scandinavia, we went through how using the right manufacturing data collection software was exactly what was needed to maximize machine utilization.
Automated systems designed for machine utilization tracking ensure data accuracy and transparency through features such as live OEE data. Tracking OEE can determine how well you are utilizing your manufacturing equipment and identify areas that require improvement. - Leverage modern machines
Modern and well-maintained machines will likely have fewer downtimes due to repairs, replacements, or other issues. Such machinery will boost productivity, as it can work longer with minimal human intervention. Furthermore, modern machines have the capability to record their downtime and the main reasons. You can collect this data in the production monitoring software of your choice making it easier to analyze the data. - Minimize unscheduled maintenance
Unplanned maintenance is one of the limiting factors of optimum machine utilization. Unfortunately, unscheduled maintenance is common when you rely only on operators and supervisors to track production. The good news is that if you acted as per points 1 and 2 of this checklist, you wouldn’t need to worry about it: an automated system can help prevent unplanned maintenance times easily and avoid under- or over-maintenance. This way, you can factor in maintenance when scheduling productive machine hours.
How to Use Evocon to Get Started With Machine Utilization
If you’re already using Evocon, you can begin understanding your machine utilization by looking at availability. As availability is automatically tracked with our OEE tracking system, you have your basic machine utilization data at hand.
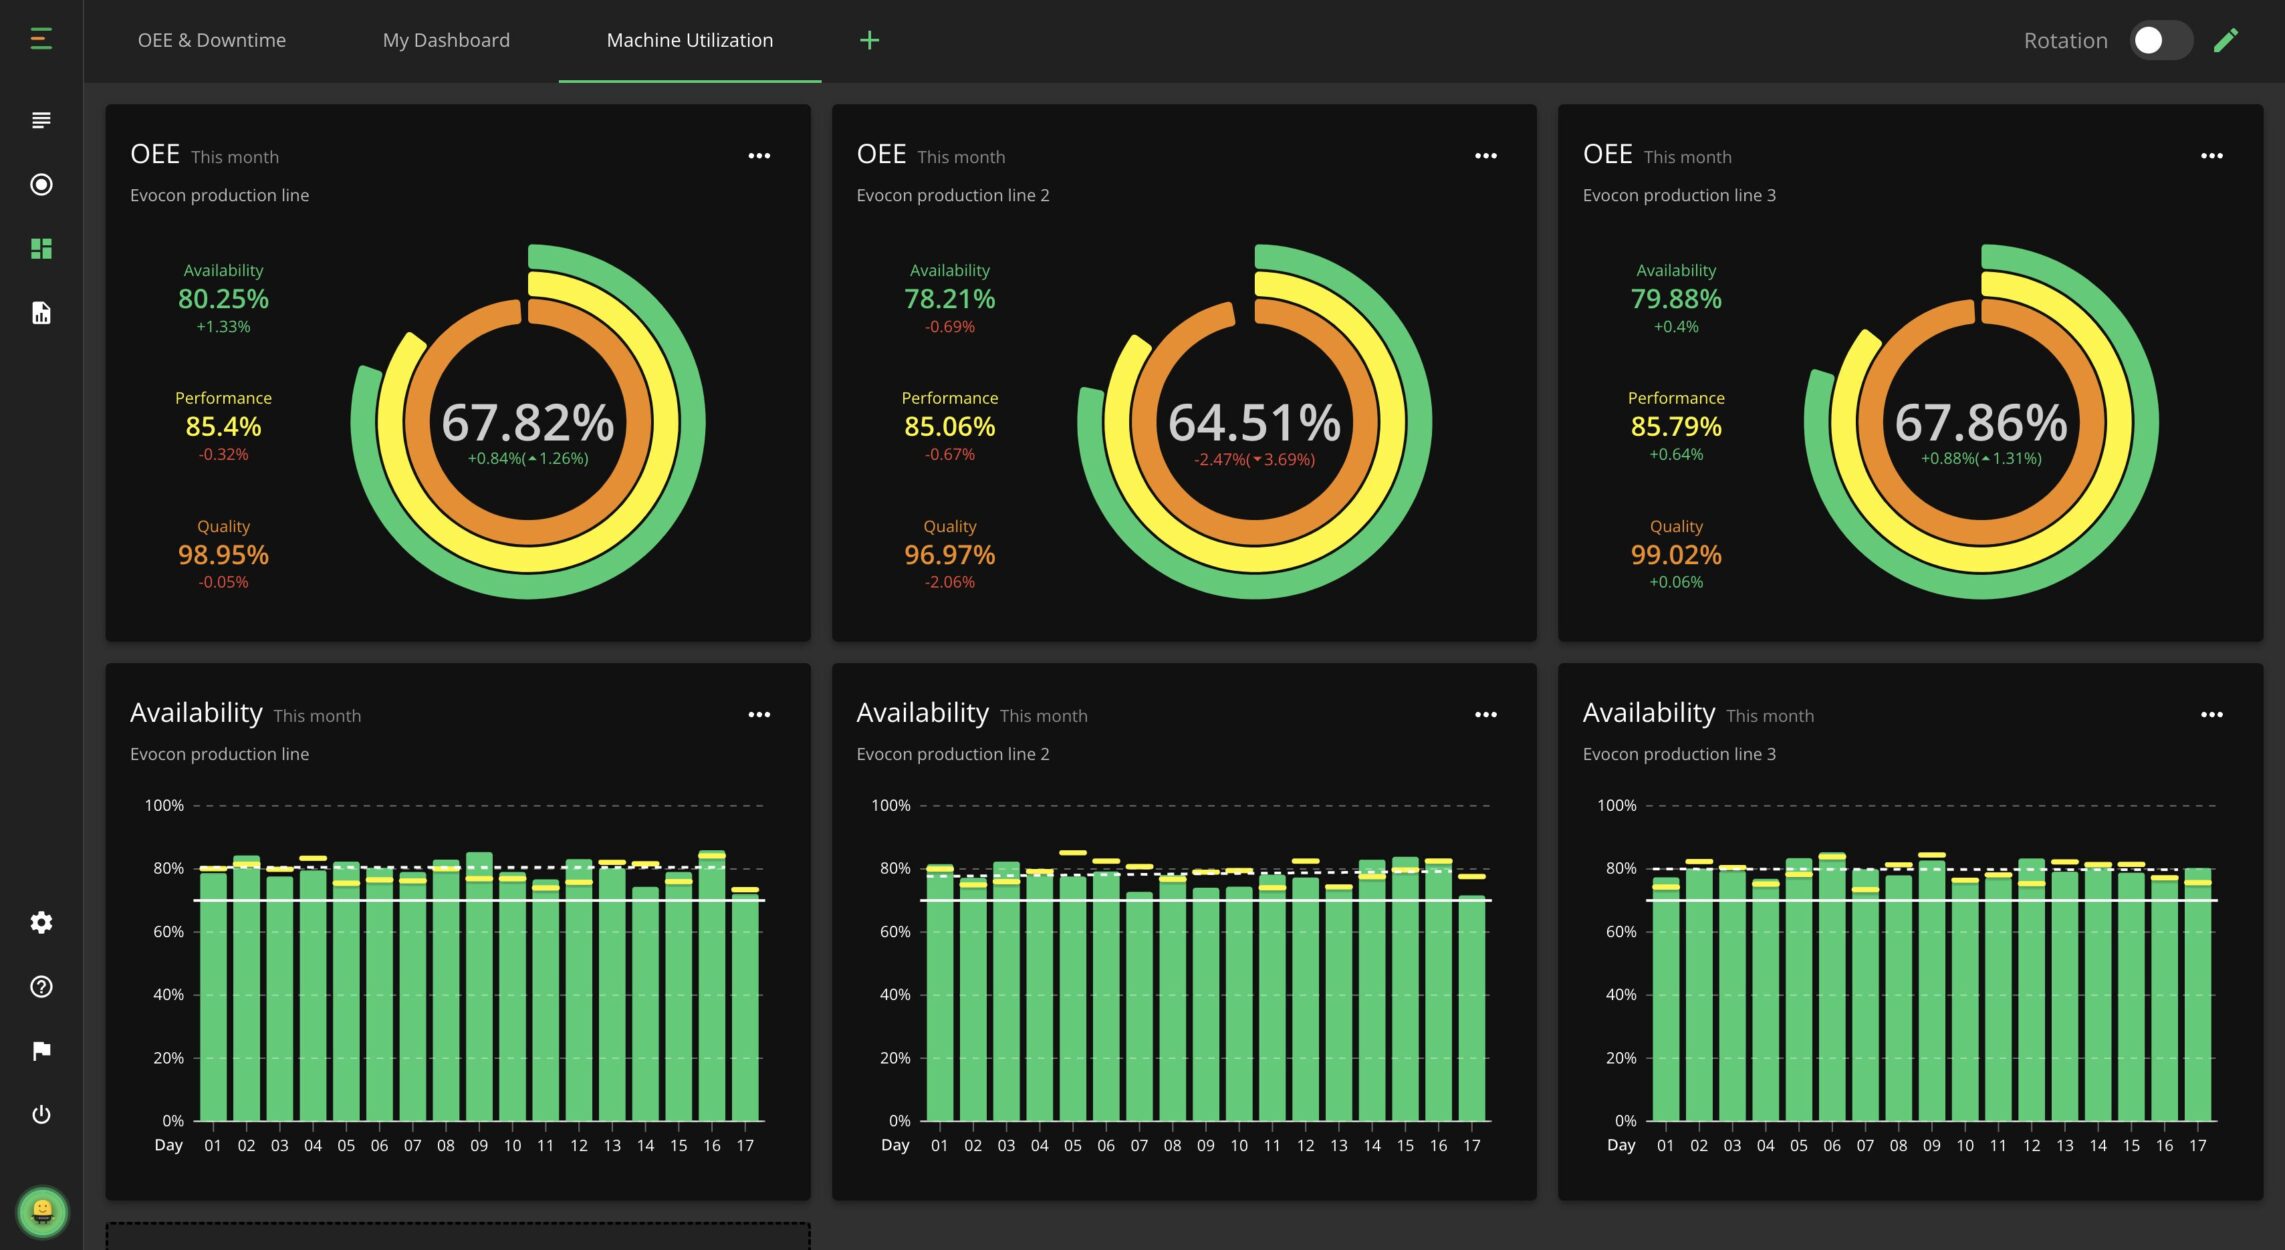
One of the easiest ways to understand your machine utilization in Evocon is to go to your OEE Dashboard. Here, you can create a widget for availability, which instantly displays the percentage. You can also set your availability targets, making tracking your performance from the dashboard easier.
You can also create widgets to display your OEE, where your availability score is visible, and add a technical availability widget to give you even more information.
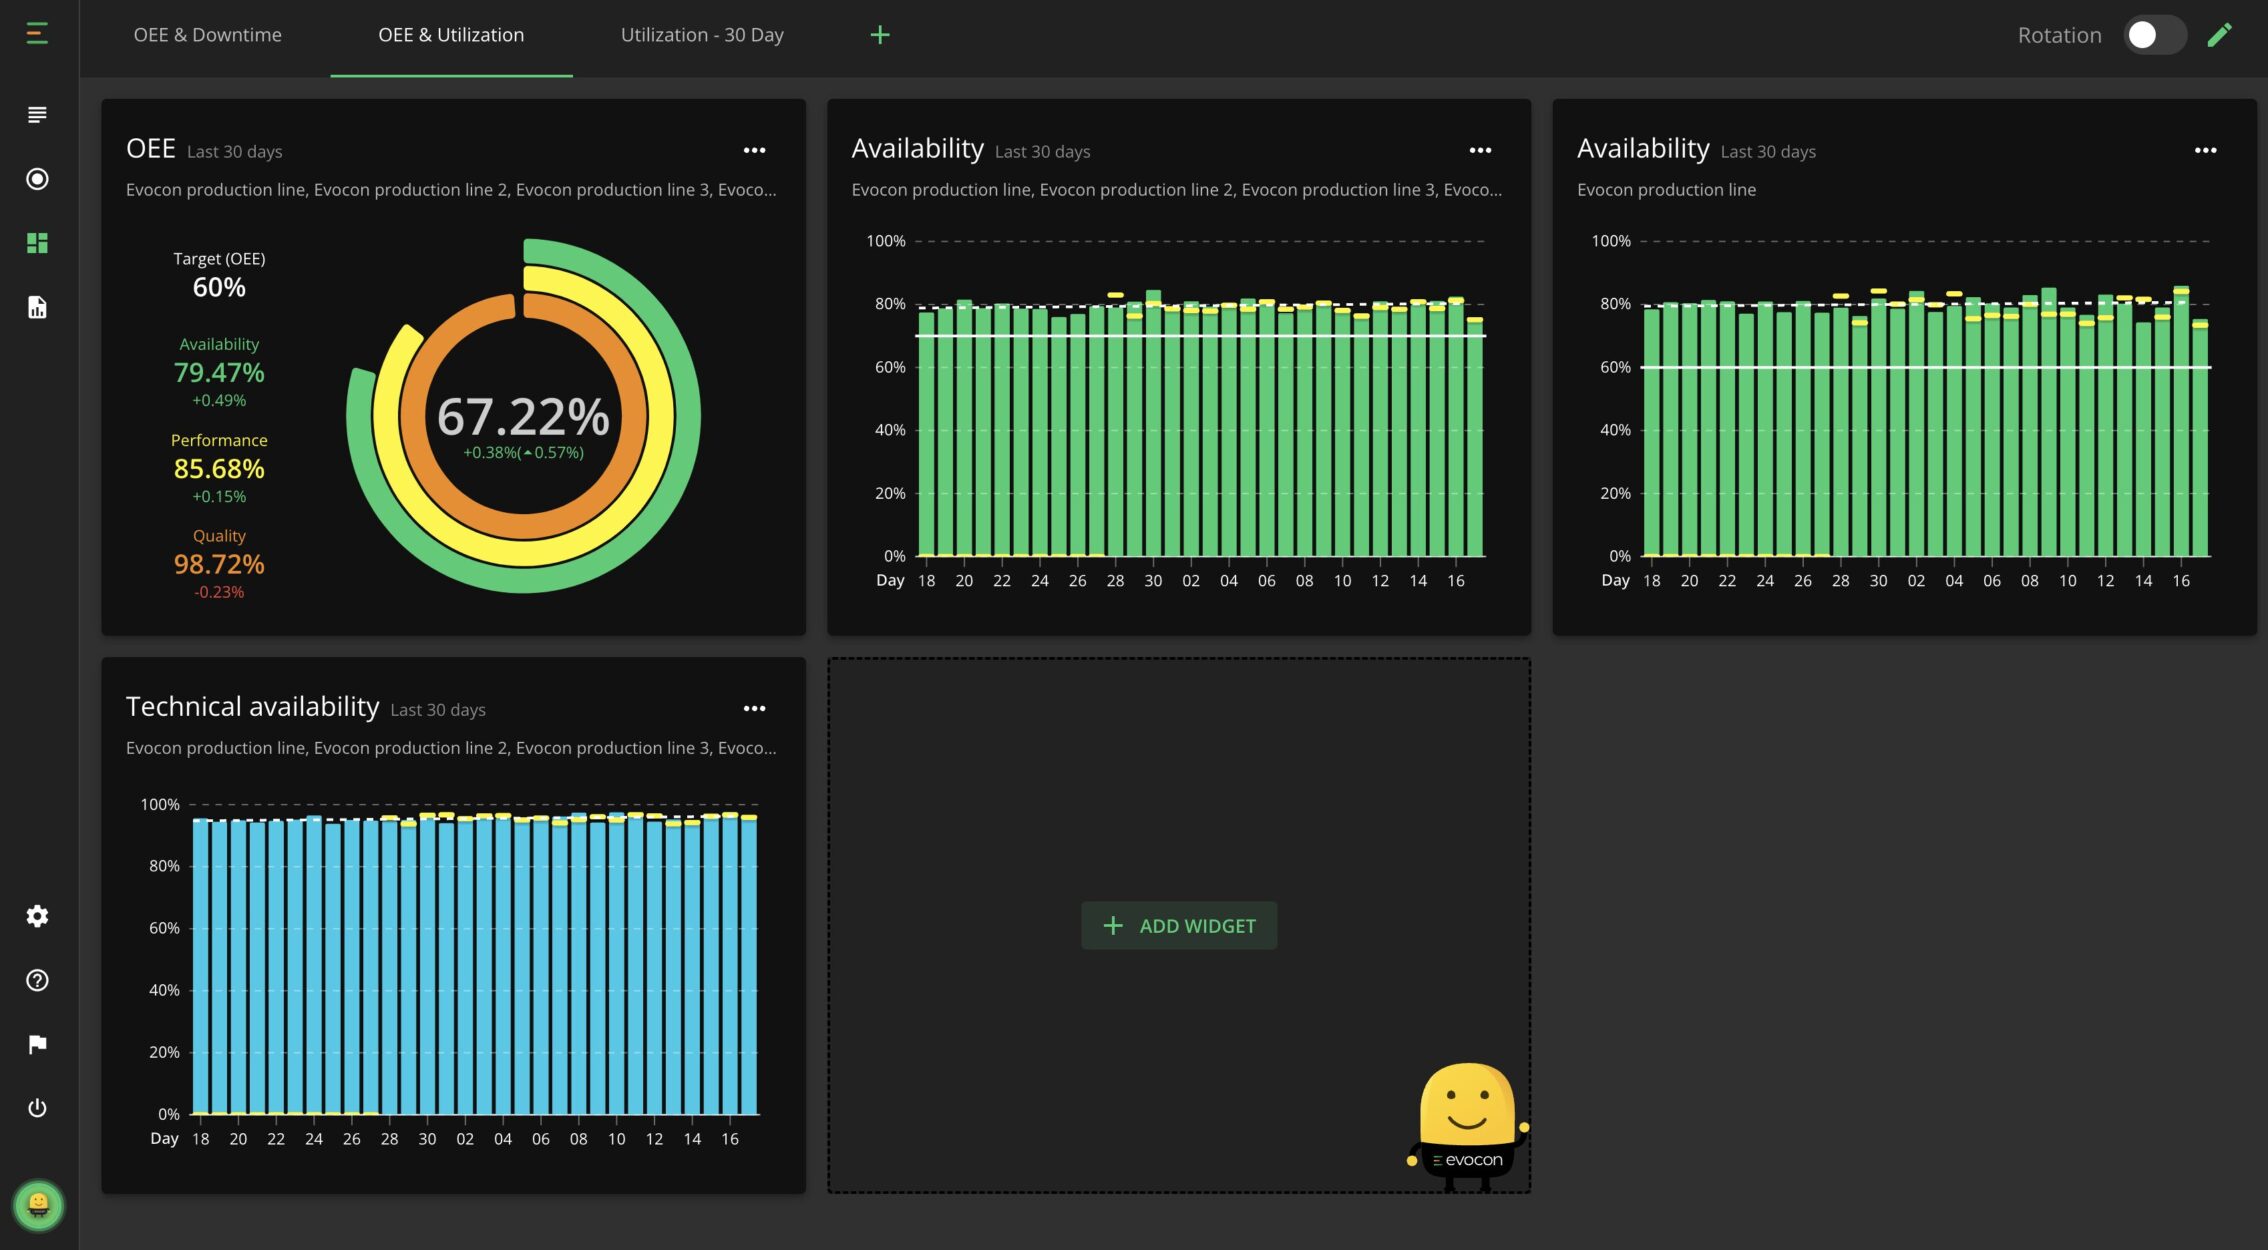
Using the filtering options in the Evocon Dashboard, you can choose the time period for which you want to see availability. Alternatively, if you would like to view your machine utilization for each line individually, you can create a widget for each line and view the availability scores simultaneously.
Key Takeaways
Learning how to calculate machine utilization and understanding its benefits is essential for every manufacturing company. By accurately measuring utilization, you can quickly determine areas where you can produce more efficiently, leading to more capacity, productivity, and profitability. Implementing software that tracks your equipment utilization makes your job even easier. Once you’ve followed our above checklist and set your benchmark, you’re ready to get started.
