 Enterprise Package
  Integrations
  Security
  Hardware
 How Evocon Works
  OEE Monitoring
  Increasing Productivity
 OEE Calculator
  Evocon
  Join us
 In this article, we will explain what manufacturing cycle time is, how it differs from takt time and lead time, and how to calculate all three. We will round-up with an illustrative example of a cycle time calculation and ideas on how to improve cycle time in manufacturing.
What is Cycle Time in Manufacturing?
Let’s take a few minutes to really understand what cycle time is. Looking broadly:
Cycle time is the time spent working to produce an item, complete a task, or provide a service, from beginning to completion.
In manufacturing we only focus on the process of production, and we measure time from the moment an item enters production until it is fully completed. For example, from the moment a worker starts assembling a table until the moment the table is done.
We may also focus on smaller parts of production and measure cycle time of a particular process, for example, on a bottling line – the cycle time of filling a bottle.
Cycle time in manufacturing is the time spent to produce an item or complete a process, from beginning to completion.
When measuring time spent, we do not include time before an item enters production (for example, preparation for the shift), time after production or process is completed (for example, packaging, delivery), and downtime (for example, lunch time, breakdowns, waiting).
We include all value-adding and non-value-adding activities during production time. For example, if the line is running slow, that time is included. If certain tasks to produce an item are not necessary (do not add value), that time is still included.
How Does Cycle Time Differ from Takt Time and Lead Time?
First of all, “cycle time” is not the same term as “takt time”. Cycle time, takt time and lead time are different KPIs that complement each other and it is important to differentiate between the three.
| Cycle Time | Takt Time | Lead Time |
| Average time to produce a single unit | Production pace required to satisfy customer demand | Time from customer order to delivery |
As you can see, these definitions work together to link production speed with customer demand. Calculating all three is essential in order to avoid over- or underproducing.

Manufacturing Cycle Time Formula
To calculate manufacturing cycle time, you choose a timeframe, count how many units were made, and divide that time by the number of units.
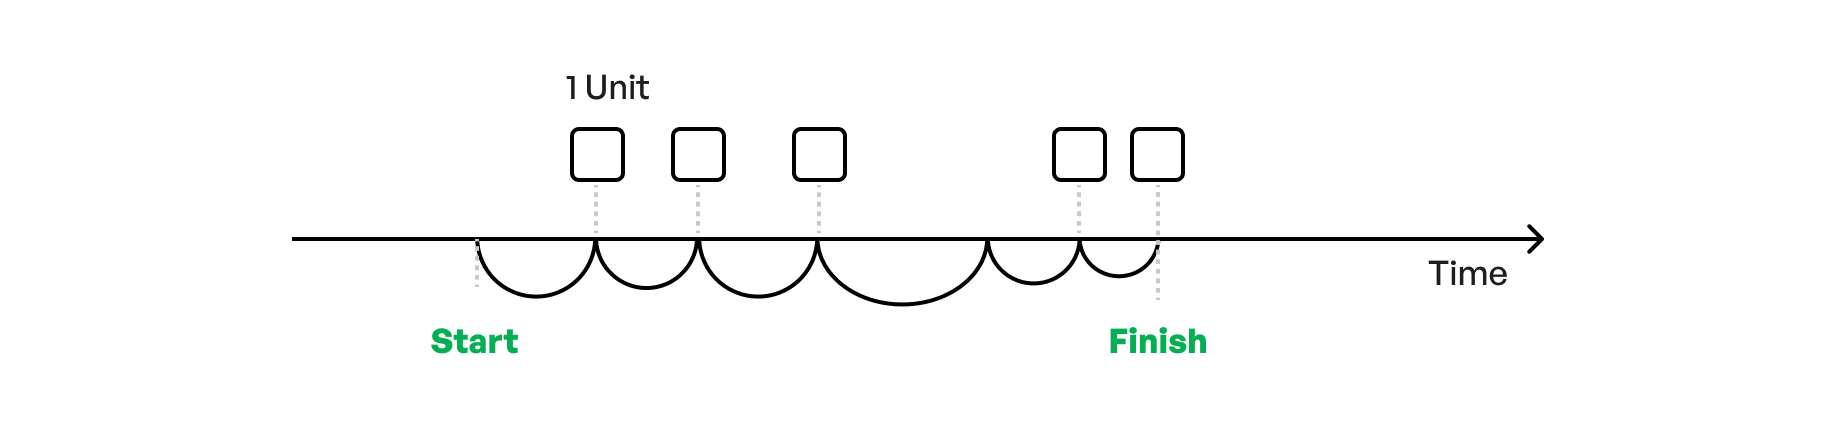

Now, let’s see how this actually works in real life (and how it is done in Evocon), when production monitoring is automated. Let’s imagine a situation on the shop floor, where the sensors are set up to register items at end of the line – once they are completed. In that case, it is unknown when exactly the process started.
Furthermore, let’s say that in the middle of production, the line stopped due to a lack of material. The duration of this stop was registered by the system. Here is what we have then:
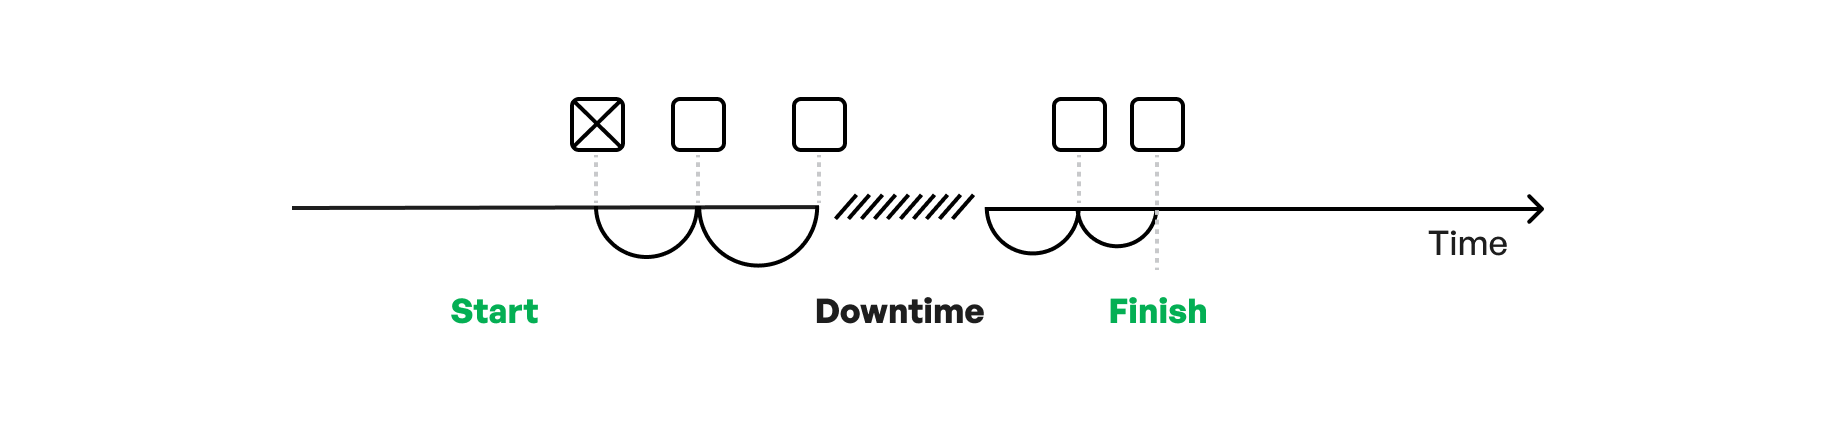
So, in this particular real-life situation, to calculate the cycle time, we take the moment we finished the batch, from it we subtract the moment we registered the first item of the batch, also subtract the duration of downtime, and then divide all of this by the number of units produced minus one unit.

What is Ideal Cycle Time?
Simply put, the ideal cycle time is the target. It is closely related to:
- Maximum demonstrated rate
- Theoretical maximum speed
- Nameplate capacity or design speed
Find out how to measure and analyze speed loss.
If cycle time is something you calculate manually or automatically, then the ideal cycle time is what you decide on.
Improve Manufacturing Cycle Time
Monitor production in real-time and boost efficiency with Evocon.
Manufacturing Cycle Time Calculation Example
Let’s consider a furniture manufacturing company that makes wooden doors. They receive an order for a new line of doors of different dimensions and must determine the manufacturing cycle time for this specific product.
They start by setting up the production line and running it at full capacity for a total of 120 minutes. During this period, they manage to produce 40 doors. To calculate the cycle time, they divide the total production time (120 minutes) by the number of doors produced (40), which gives them an ideal cycle time of 3 minutes per table.
After a week of production, they review their automated production monitoring data. They discover that the actual net production time, excluding downtime, was 1100 minutes and they produced 320 doors. The actual cycle time is therefore calculated by dividing 1100 minutes by 320 tables, resulting in roughly 3.44 minutes per table.
This actual cycle time is used to give a realistic estimate of how long it will take to fulfill future orders for this specific line of doors.
How to Improve Cycle Time in Manufacturing?
Having real-time production data to the granularity of individual units makes it possible to analyze, how to improve cycle times. Here is how to do it:
- Identify periods of production running slower than ideal cycle time (set target speed)
- Assign reasons why a slow-down happened
- Analyze the Pareto chart of slow cycle times to identify the biggest contributors
For example, in Evocon we do it like this.
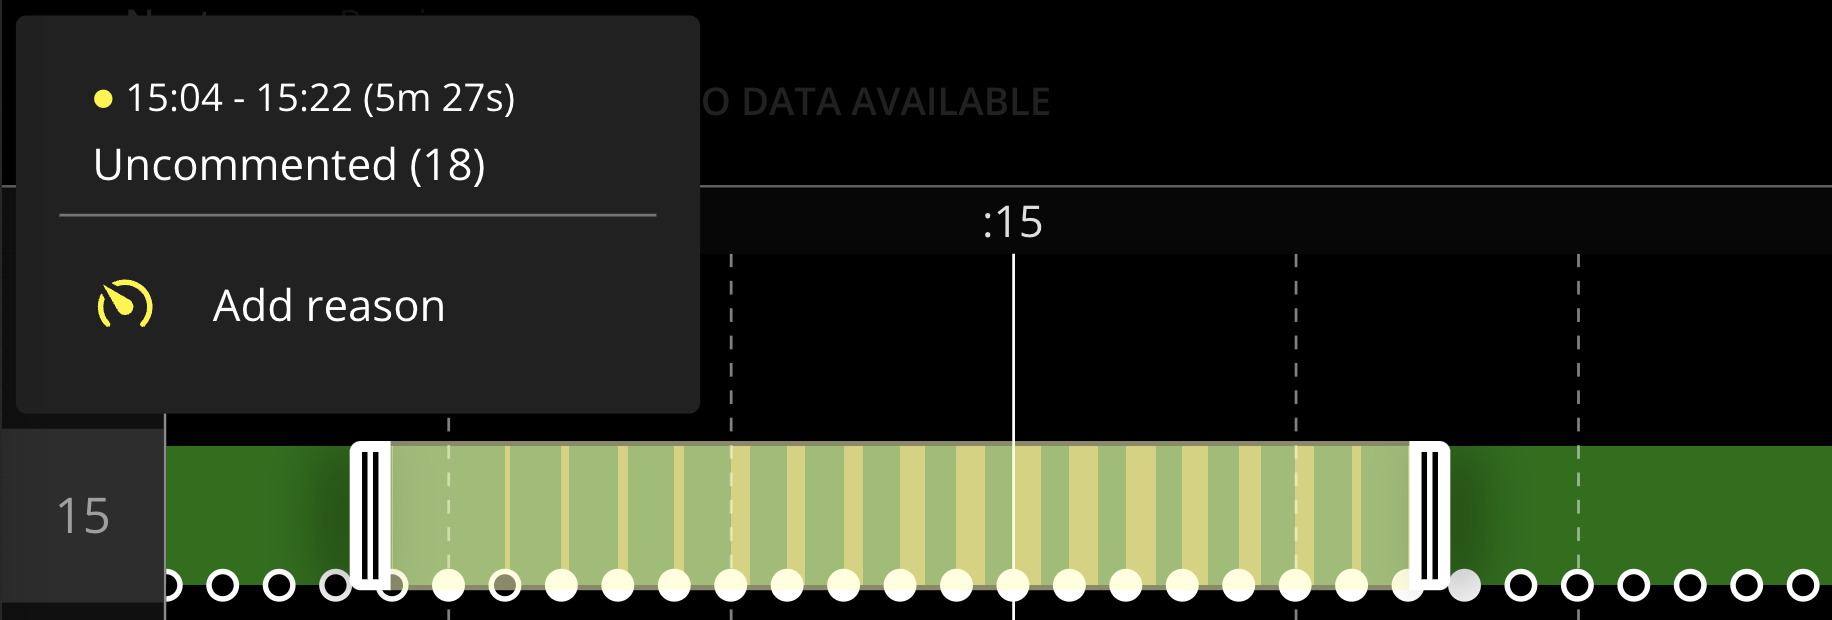
First, we identify slowdowns. On Evocon’s Shift View they typically look like this:

Here we see that the line slowed down between 15:04 and 15:22. Then, we select the slow period:
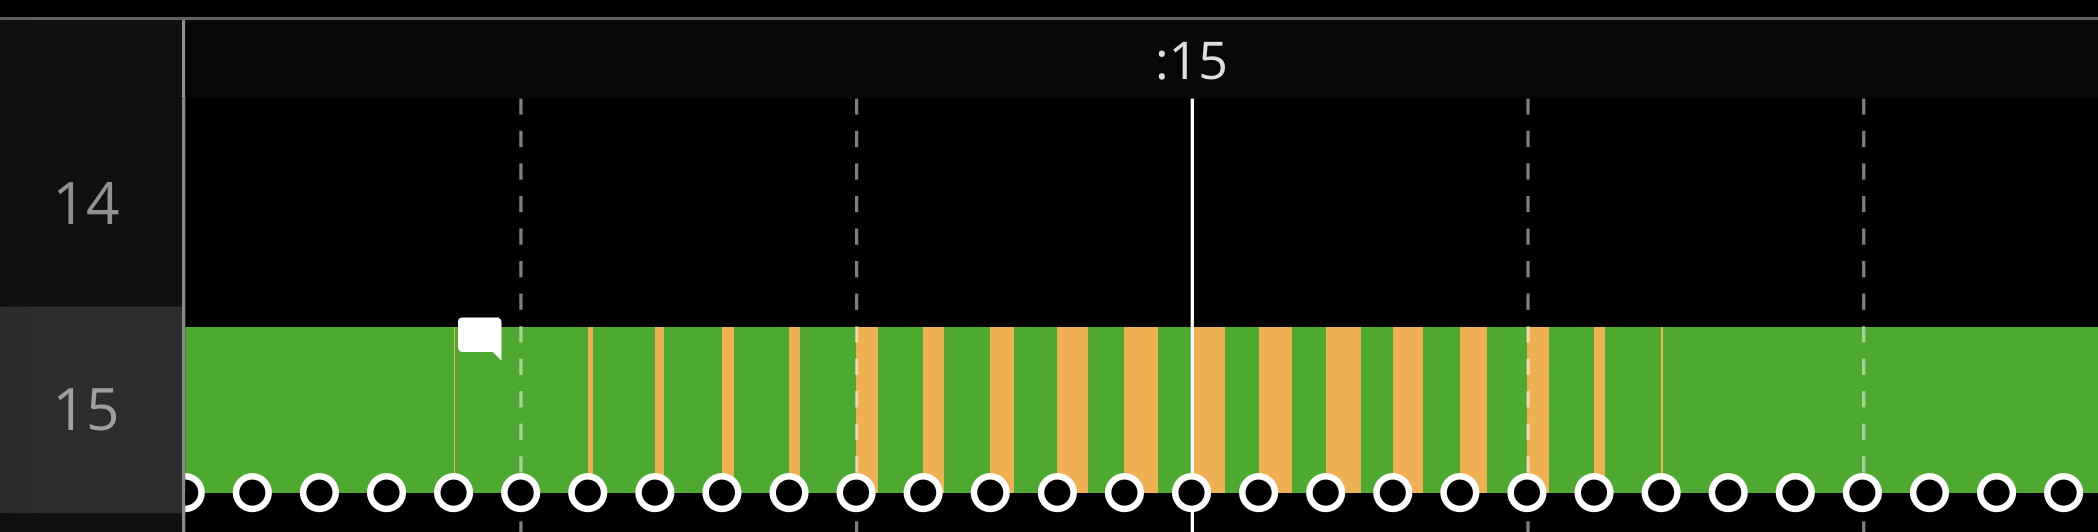
And add the reason for the slowdown. Once the reason is assigned, it changes color.
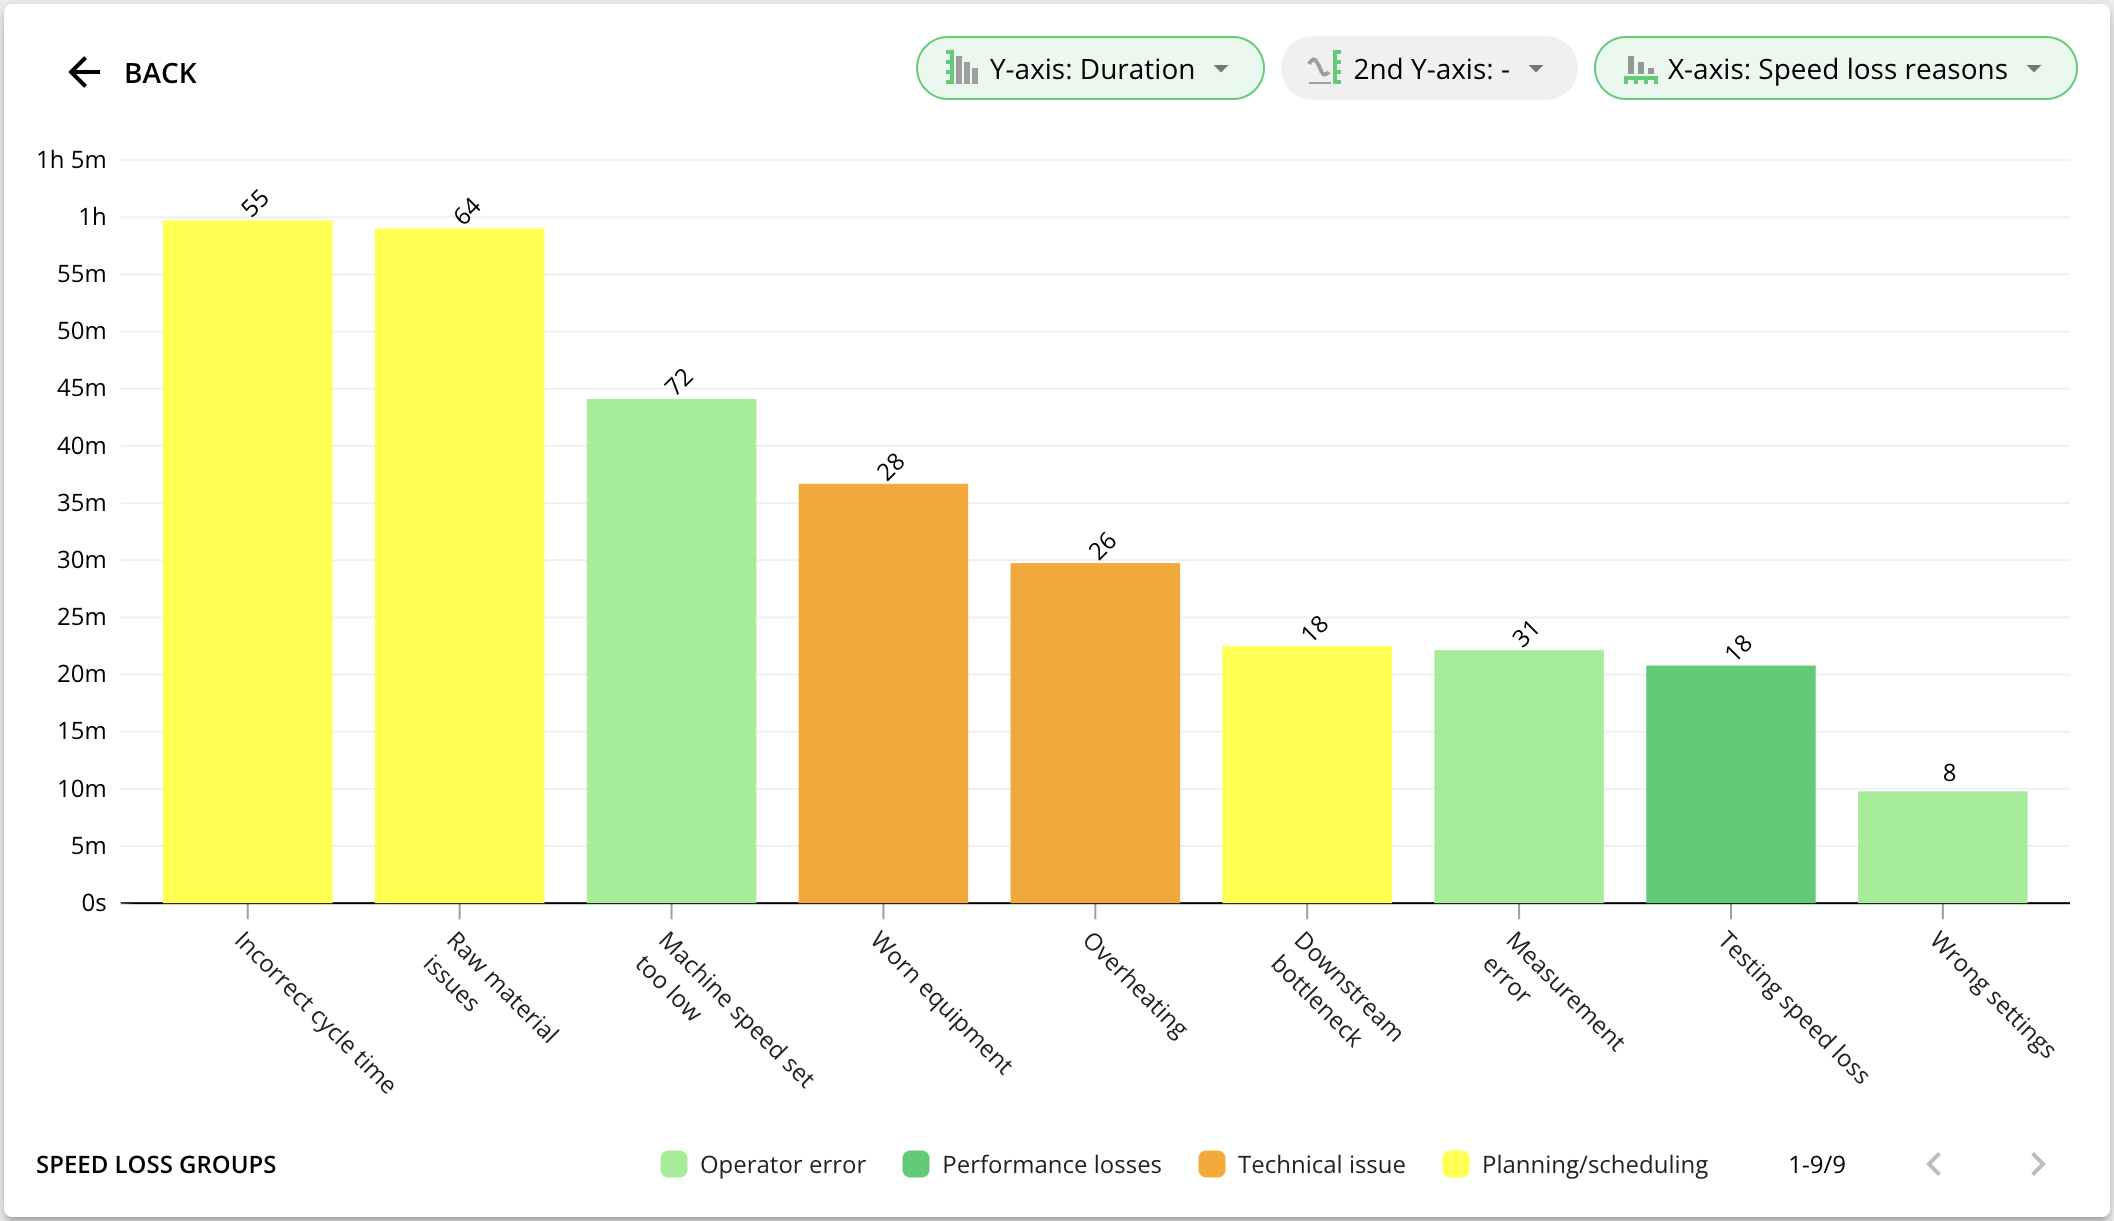
Finally, we can analyze the Pareto chart of slowdowns. It works just like analyzing downtime but is based on cycle times data and its comparison to target cycle times set-up in the system.
Key Takeaways
In conclusion, understanding and optimizing cycle time is essential for efficient manufacturing operations. By accurately measuring manufacturing cycle time, you can pinpoint inefficiencies, reduce production bottlenecks, and improve overall productivity. Integrating cycle time analysis with takt time and lead time ensures that production meets customer demand without overextending resources.
Implementing a real-time production monitoring system and continuous improvement strategies can significantly enhance the precision and reliability of cycle time data, leading to better decision-making and competitive advantage in the market. By focusing on these metrics, you can improve efficiency and minimize costs. For now, here is a list of questions to challenge you:
- Is your planning department using optimal cycle times and could you actually produce more than planned?
- What cycle time is used for cost calculation? Could you actually have healthier margins?
- How does cycle time contribute to OEE, exactly?
- It is okay to run above target speed (faster than ideal cycle time)?
- How to compare cycle times of different products/machines, or see change over time?
- How to update cycle times of a hundred products at once, based on historical data?
- Where is the line between slow cycle time and downtime, when tracking production automatically? And does this distinction even matter?