TEEP is a manufacturing metric that measures your equipment’s effectiveness against all available hours – 24 hours a day, 7 days a week. It considers every minute of every day, unlike OEE, which focuses on your planned production time. This approach offers a complete, high-level look at your factory’s real capacity, revealing potential you might not have considered.
In this article, we will explore what makes TEEP unique and how it can be used with other key metrics like OOE and OEE to give you a complete picture of your factory’s performance.
TEEP vs OOE vs OEE
Let’s add one more KPI of the same family to our discussion – Overall Operations Effectiveness (OOE). This will give you a complete picture so you know which one to use and when.
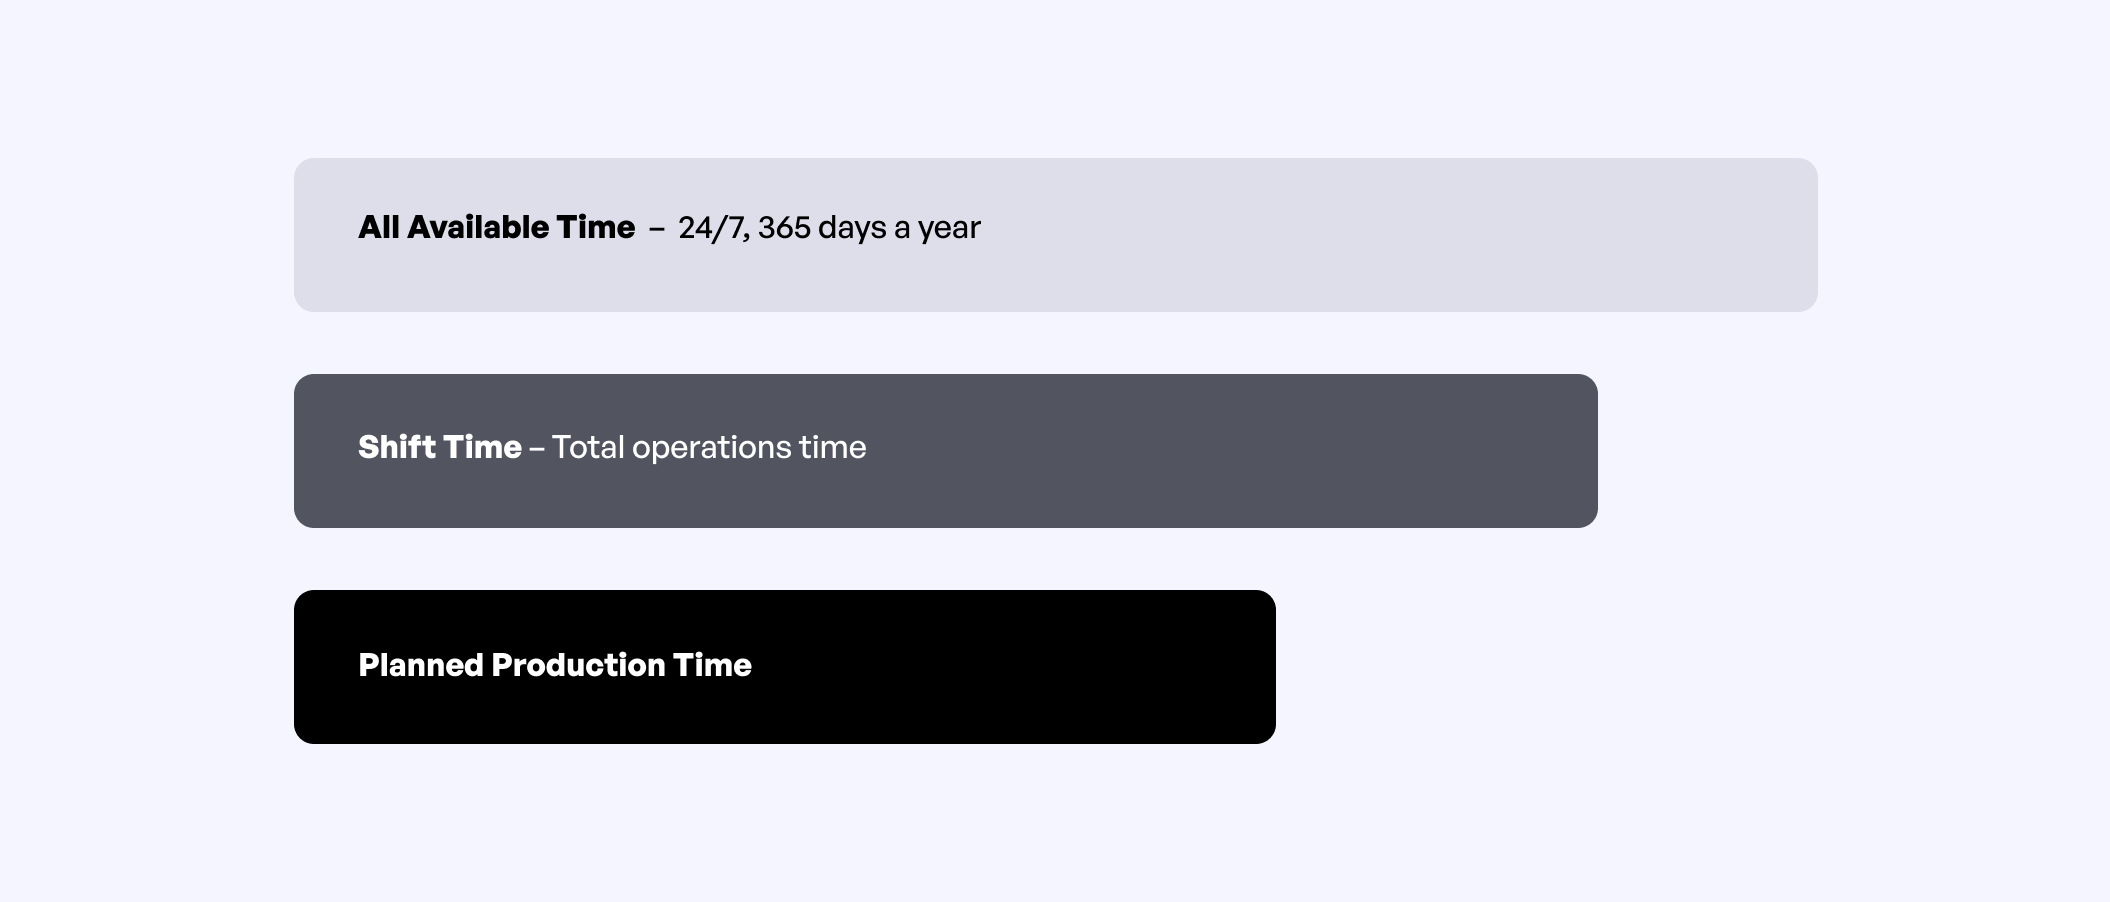
While TEEP, OOE, and OEE all measure manufacturing productivity, they do so from different perspectives, defined by the time they measure against.
- OEE (Overall Equipment Effectiveness)
This is the most widely used metric. It measures how effectively a manufacturing process operates during its planned production time. It answers the question, “How well did we do when we were supposed to be running?” - OOE (Overall Operations Effectiveness)
As we discussed in our article on OOE, this metric broadens the scope of OEE. It includes the impact of necessary planned activities like changeovers and breaks. It measures effectiveness across the entire shift time (or time dedicated/scheduled for shifts) and answers the question, “How well did we do during the time we were staffed and ready to operate?” - TEEP (Total Effective Equipment Performance)
This is the broadest of the three. It measures your equipment’s performance against all available time – 24 hours a day, 7 days a week. It answers the question, “What is our factory’s true capacity, and how well are we utilizing it?”
To put it simply, the main difference looks like this:
- OEE is performance during Planned Production Time
- OOE is performance during Shift Time
- TEEP is performance during All Available Time

By understanding these distinctions, you can choose the right metric for the right situation and gain a more complete picture of your factory’s performance.
How to Calculate TEEP?
TEEP uses the same three factors as OEE and OOE: Availability, Performance, and Quality, but its difference lies in the Availability factor. Unlike the other metrics, TEEP calculates Availability based on all available time (24/7).
Here is how TEEP is calculated:

While you may see TEEP presented as a product of OEE and a utilization factor (TEEP = OEE × Utilization) in other articles, we prefer a different approach. By showing how the formulas for TEEP, OOE, and OEE are identical except for one component, it becomes much clearer how these three metrics relate to one another.


The core formula remains the same, but the time we measure against changes for each.
Why Is TEEP Important, and Who Uses It?
TEEP provides a high-level, strategic view of your factory’s performance. While OEE is suitable for measuring efficiency during planned production time, TEEP reveals your true (maximum) potential, also called “the hidden factory”.
Why is it important?
TEEP shows all time your machines are not running, including nights and weekends, which exposes opportunities to utilize this idle time: add shifts, move activities to off hours (i.e. maintenance) or run automated processes without human supervision.
A high TEEP score indicates that your factory is already operating near its maximum capacity, which might justify a new equipment purchase. Conversely, a low TEEP score suggests you should focus on improving your existing assets before investing in new ones. TEEP helps you ask the right questions and focus your improvement efforts where they will have the greatest impact.
Who uses TEEP?
- Executive Directors and Plant Managers
These leaders need a complete picture of the entire operation. It helps them make strategic decisions about capacity planning, capital expenditure, and overall operational strategy. - Production Planners
Planners can gain a more accurate understanding of the factory’s maximum capacity. This allows them to create more realistic production schedules and delivery promises.
How to Track TEEP?
If you are already tracking OEE, calculating TEEP is simple. The only thing you need to change is the denominator of the availability calculation.
OEE = (Uptime / Planned Production time) × Performance × Quality
TEEP = (Uptime / All available time) × Performance × Quality
Because TEEP measures against all available time, this value is a constant (24/7, or 168 hours per week). This means you don’t need to track any additional data beyond what is needed for OEE. For example, if you are calculating TEEP for two machines over one week, your “All available time” would be 336 hours (168 hours x 2 machines).
For the remaining three components (uptime, performance, and quality), you need this data:
- To calculate Uptime:
You need the Runtime of your machine. - To calculate Performance:
You need the Ideal Cycle Time and the Total Production Count. - To calculate Quality:
You need the Good Count and the Total Production Count.
When you combine these components, the full TEEP formula looks like this:

How to measure runtime and production counts?
There are two primary ways to collect this data: manually or automatically.
Manual data collection
This method involves a person physically checking and recording machine data on paper forms or in spreadsheets. An operator might use a stopwatch to measure run time and visually count the number of parts produced. While this approach is simple, it comes with significant drawbacks:
- It’s time-consuming and labor-intensive.
- The data is often inaccurate due to human error.
- Information is not available in real-time, making it difficult to react quickly to production issues.
Automated data collection with Evocon
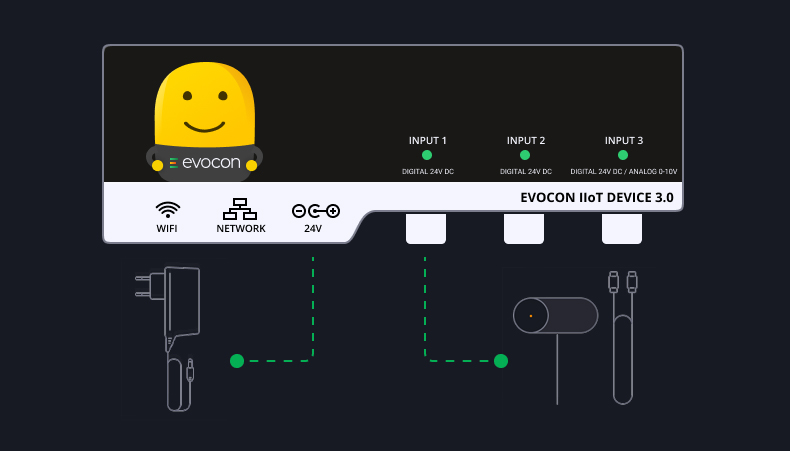
Automated systems provide more accurate data by precisely tracking when planned stops begin and end, eliminating timing errors in manual recording. Please see this section explaining what hardware and methods Evocon uses to track the data automatically.
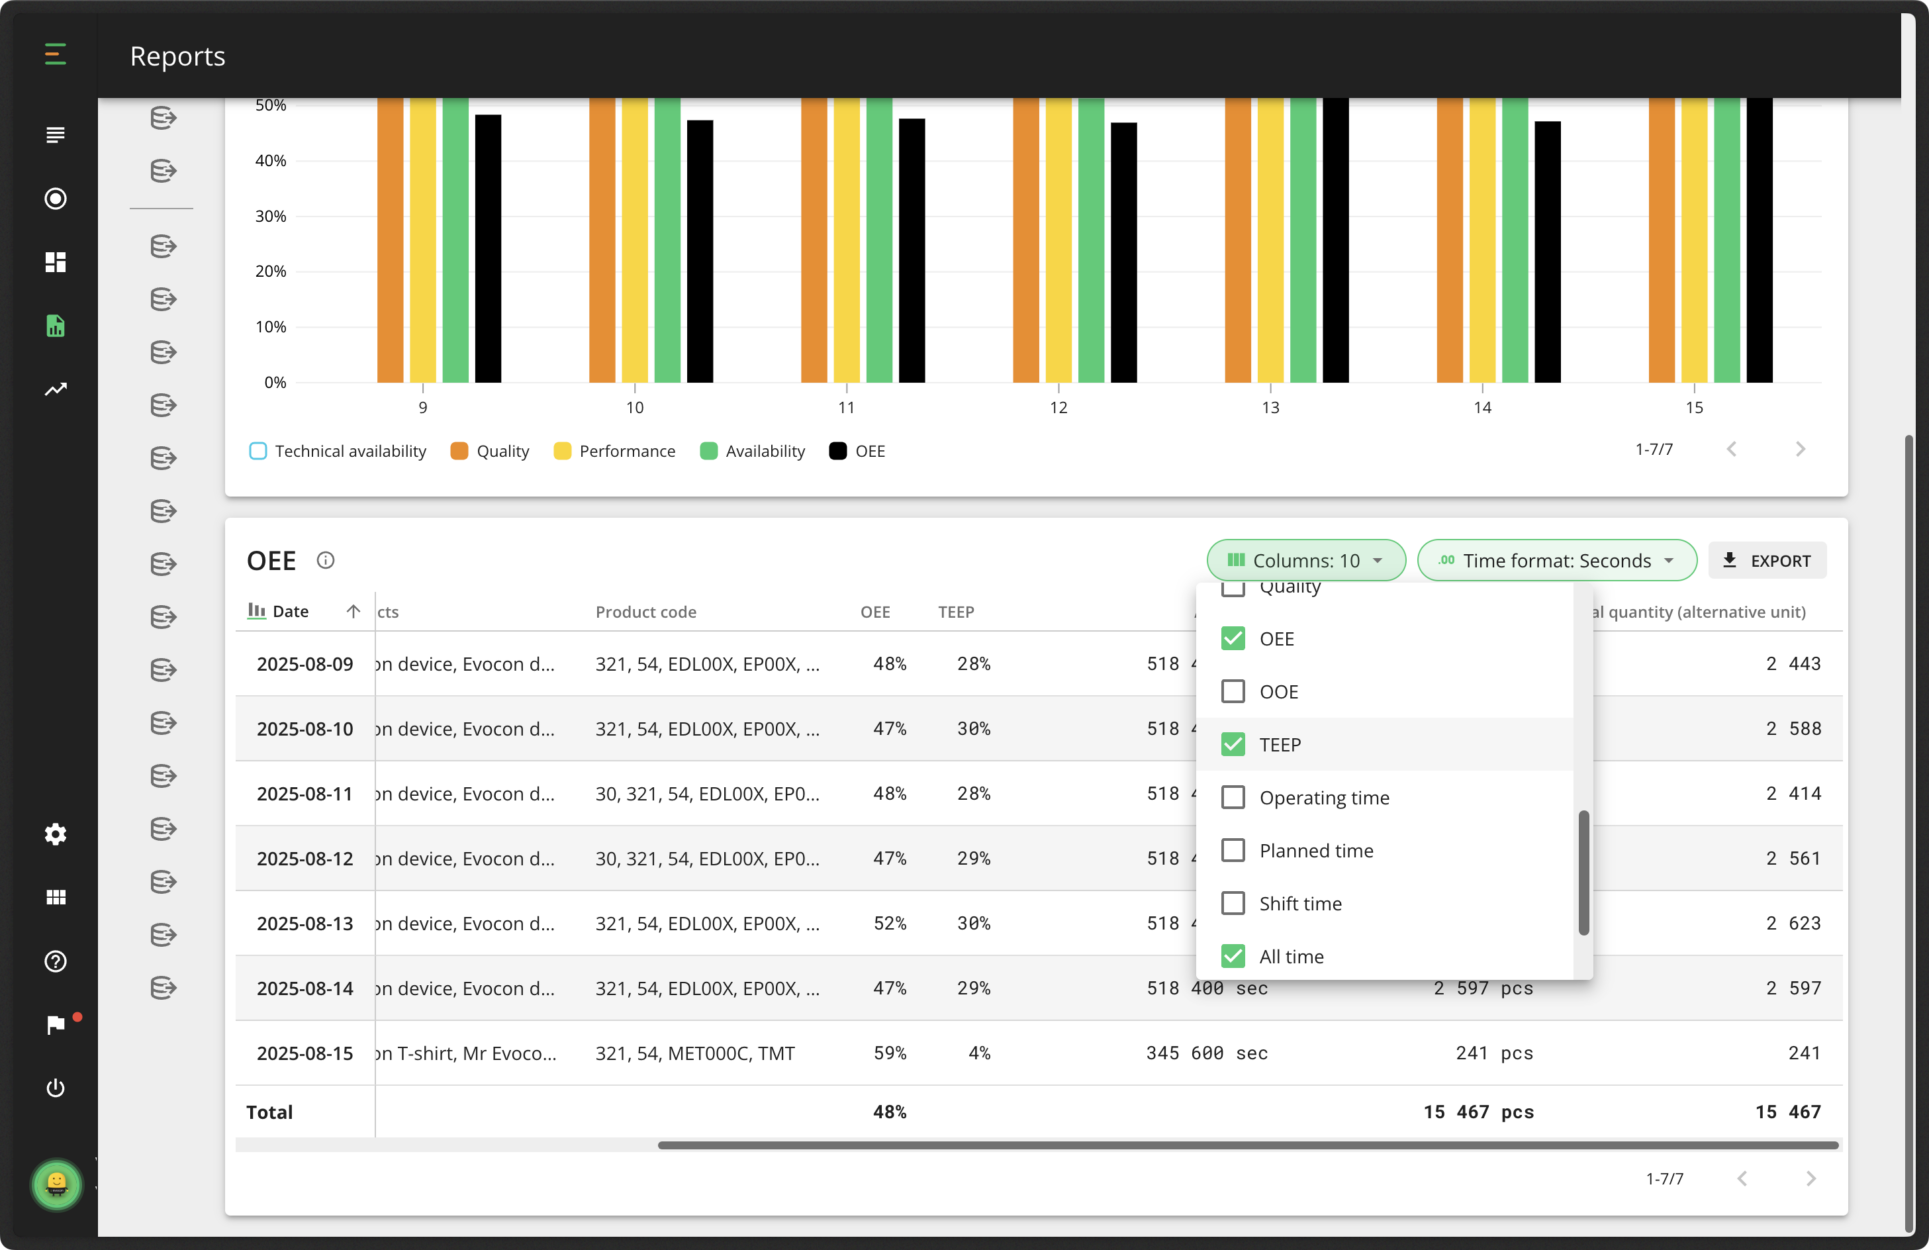
For Evocon users, your TEEP percentage can be viewed through Reports. To view it, go to your OEE report and scroll down to the table view. Click on the “Columns” option and make “TEEP” visible. With that filter selected, you will now see your TEEP percentage and can also export your data.

As you may have noticed, the OOE metric is also accessible in the same place.
How to Use OEE and TEEP Together?
OEE and TEEP work best as a pair, providing a more complete picture of your factory’s performance than either metric could alone.
A TEEP score is normally lower than your OEE because it measures against all available time. While an OEE score of 85% is often called world-class, reaching a high TEEP score is much more difficult. It requires you to maximize machine uptime and use even during periods of planned downtime.
Here is how you can put them to work together:
- Start with OEE and identify bottlenecks
Begin by implementing OEE on individual machines. This granular data helps you quickly pinpoint specific inefficiencies and bottlenecks on the shop floor. - Calculate TEEP of the entire system
Once you’ve assessed individual machine performance, calculate the TEEP score for your entire production line. This gives you a broader perspective on the total performance by considering all available operating time. - Compare the two
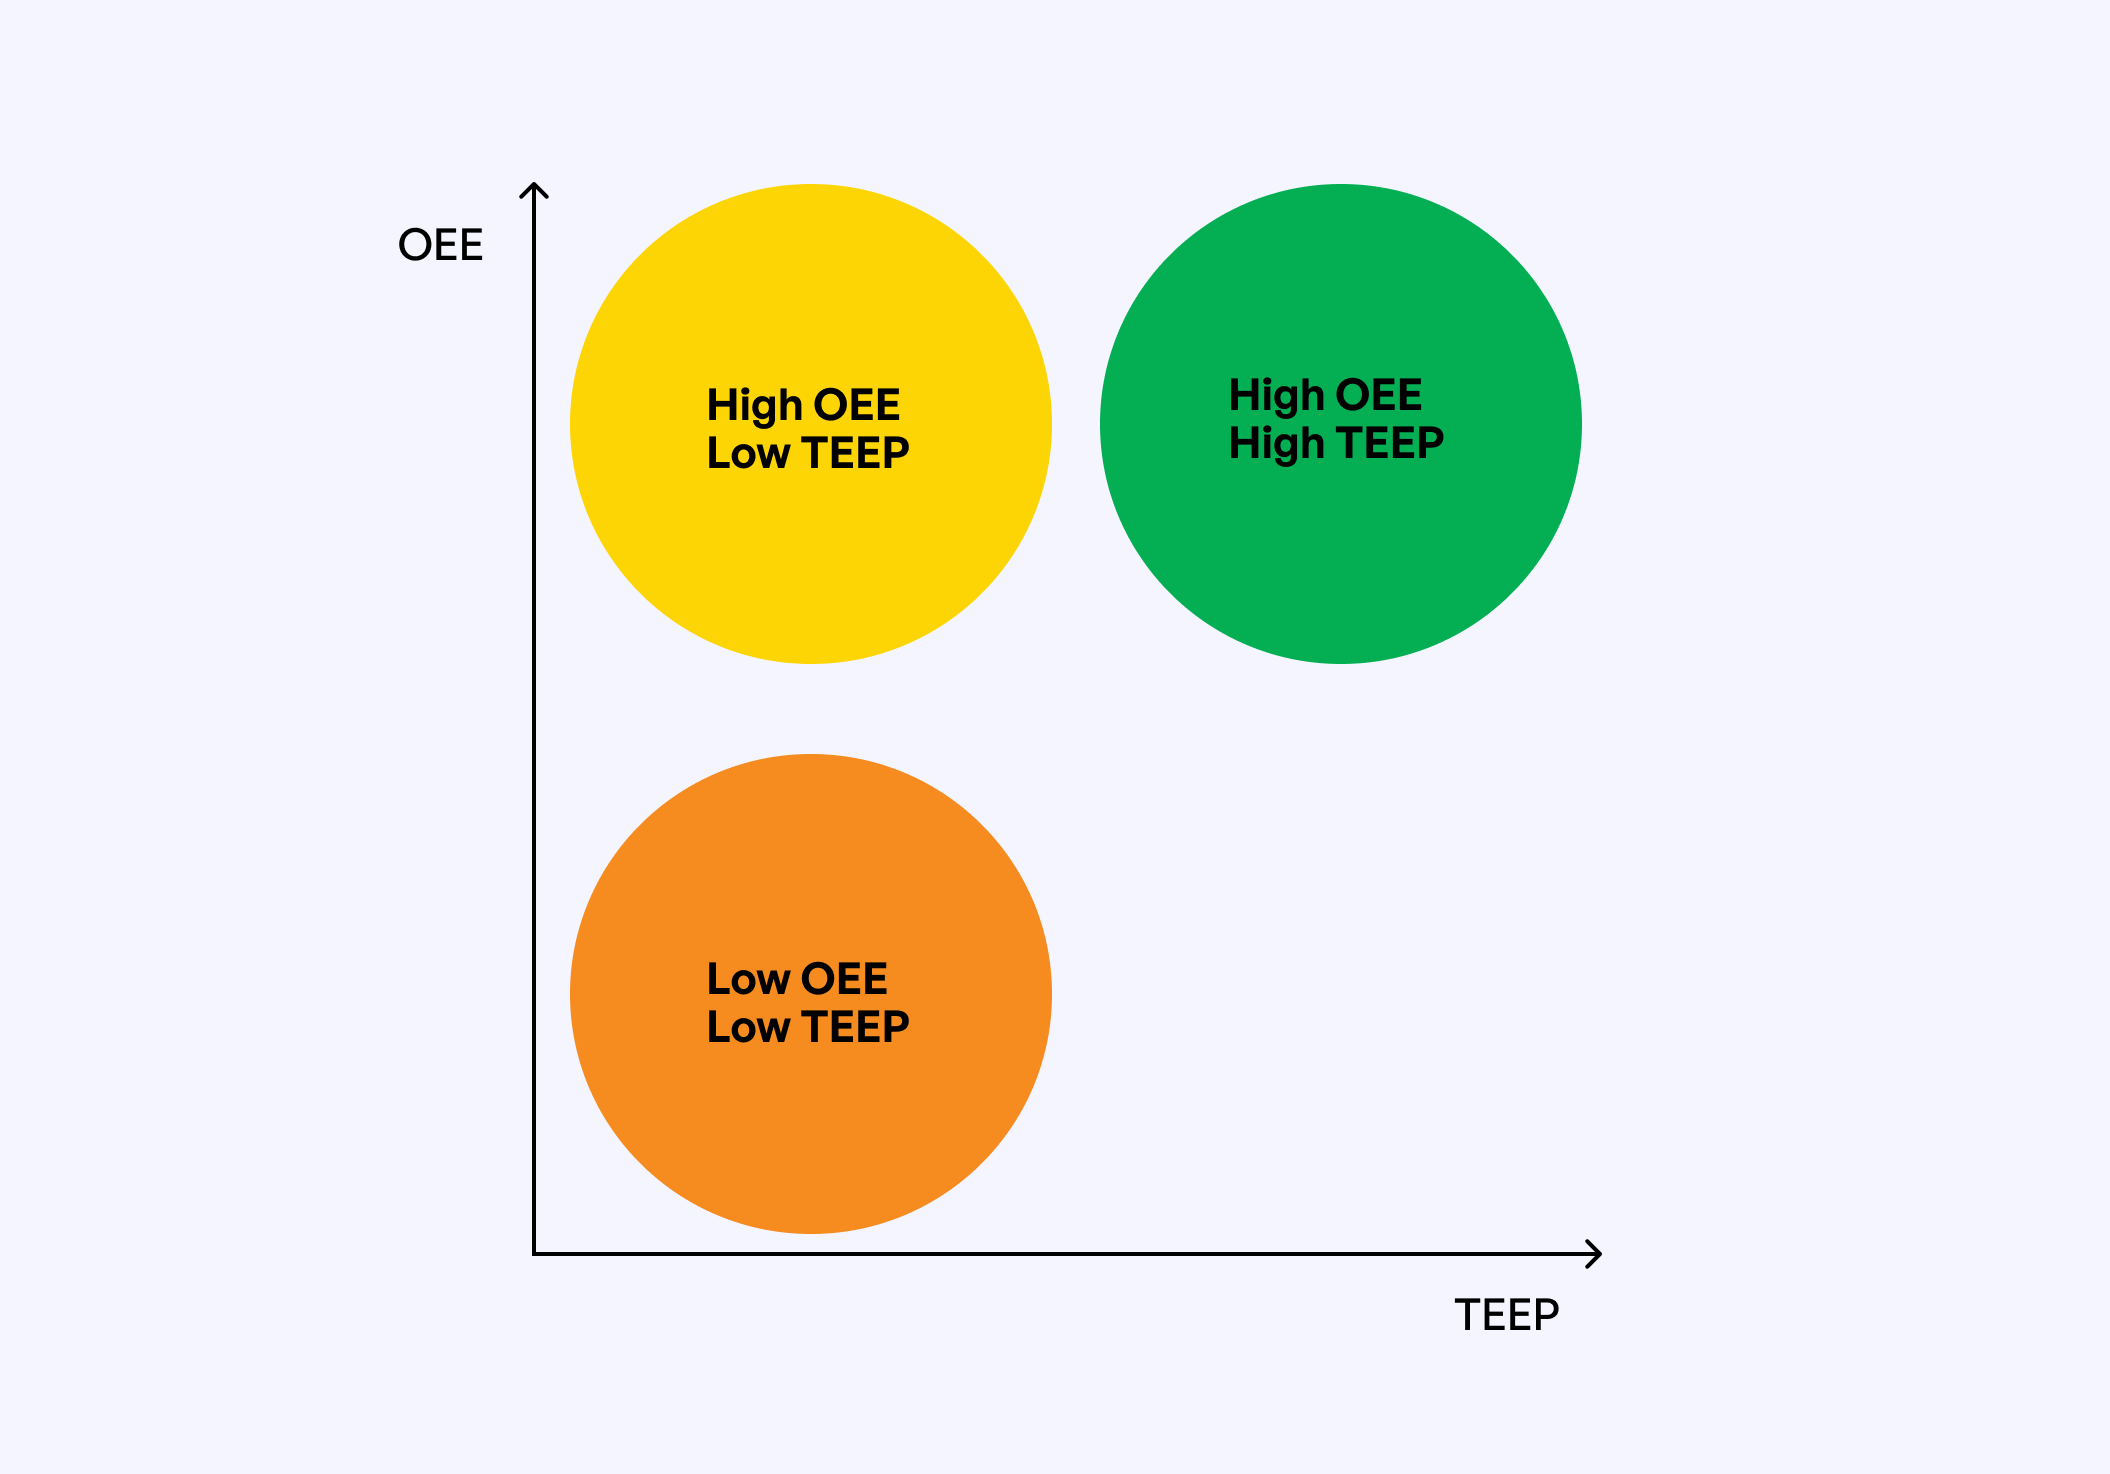
This is the key step. By comparing your OEE and TEEP scores, you can get a clearer understanding of where to focus your improvement efforts.- High OEE, low TEEP:
You are efficient when you’re running, but you have a lot of unused capacity. The focus should be on increasing overall utilization, perhaps by adding a new shift. - Low OEE, low TEEP:
Your efficiency is low even during planned production. Your first priority should be to improve your OEE by addressing the core causes of lost time. - High OEE, high TEEP:
Your factory is efficient and highly utilized. This may signal that it’s time to consider investing in new equipment to expand your operations.
- High OEE, low TEEP:
- Address issues and track progress
Use the insights from your OEE and TEEP comparison to devise and implement targeted strategies. Then, continuously monitor both metrics over time to measure the impact of your changes and identify new areas for optimization.
Challenges With TEEP
While TEEP is a valuable metric for strategic planning, it’s not without its drawbacks. It’s important to understand these challenges to ensure the metric is used correctly and doesn’t lead to misunderstandings or misdirected efforts.
- TEEP scores can be very low
Because TEEP measures performance against a 24/7 calendar, its scores will be lower than OEE. For a plant that runs one eight-hour shift, five days a week, the maximum possible TEEP score, even with a world-class OEE, is around 24% (40 planned production hours divided by 168 total hours). This can be demotivating for teams who are doing an excellent job during their planned production time but see a low TEEP score.
- It can be a misleading operational metric
TEEP is a high-level, strategic metric, and it isn’t designed for day-to-day use on the shop floor. An operator can’t impact the total available time, so showing them a TEEP score won’t help them with immediate, tactical improvements. For daily operational decisions, OEE is a much more relevant and actionable metric. - It doesn’t distinguish between planned and unplanned types of downtime
TEEP measures all downtime against the total time, but it doesn’t automatically differentiate between planned downtime (like a weekend) and unplanned downtime (like a machine breakdown). For a strategic planner, a low TEEP score might reveal an opportunity to add a shift. But for a maintenance manager, the same low score doesn’t provide enough detail to know if the problem is poor maintenance or just scheduled breaks. For that kind of detail, you still need to rely on OEE data. - It may lead to unrealistic expectations
Just because TEEP measures against a theoretical 24/7 capacity doesn’t mean a factory should run that way. Pushing for a higher TEEP score without considering factors like maintenance needs, labor costs, and employee well-being can lead to increased costs, safety risks, and staff burnout.
Key Takeaways
TEEP is a manufacturing metric that provides a complete picture of your factory’s true capacity by measuring performance against all available time (24/7). This is its key distinction from OOE and OEE, which measure against shift time and planned production time, respectively. Calculating TEEP is straightforward if you are already tracking OEE, you just need to change the availability denominator to all available time.
OEE and TEEP work best as a pair, serving different but complementary purposes. OEE is a tactical tool for day-to-day operational improvements on the shop floor, helping managers identify and fix bottlenecks in real-time. TEEP, on the other hand, is a strategic tool for high-level planning. It helps executive directors and planners understand the factory’s full potential and make informed decisions about expansion or investment.
While TEEP offers valuable strategic insight, it’s important to be aware of its limitations. TEEP scores are often very low, which can be demotivating for teams focused on daily performance. Furthermore, because it’s a high-level metric, TEEP isn’t designed for detailed operational improvements. By understanding these nuances, you can use TEEP effectively to guide your long-term business strategy while still relying on OEE for more immediate gains.


