 Enterprise Package
  Integrations
  Security
  Hardware
 How Evocon Works
  OEE Monitoring
  Increasing Productivity
 OEE Calculator
  Evocon
  Join us
 In any manufacturing facility, the sound of running machinery is the sound of productivity. For plant managers, the core challenge is to maximize that productive time and increase capacity. The key to achieving this lies in understanding and improving one of the most fundamental manufacturing metrics: equipment uptime. This comprehensive guide will walk you through everything you need to know: we will define what it is and why it’s critical, show you how to calculate it, and provide actionable strategies to maximize it. We’ll also look into the opposite side: why chasing a high uptime rate isn’t always the best overall approach.
What is Uptime in Manufacturing
In manufacturing, uptime is the time that a machine, production line, or piece of equipment is operational during its scheduled production period.
It’s the productive time when your assets are producing goods, contributing directly to your plant’s output.
Uptime is the direct opposite of downtime, which is any period when a machine is scheduled to be running but is not. While downtime represents lost production capacity, uptime represents realized production capacity.
This metric is a critical factor in calculating Overall Equipment Effectiveness (OEE). Specifically, uptime is the core of the Availability component of OEE. The more uptime you have, the higher your Availability score, which directly improves your overall OEE and reflects a more efficient and reliable operation.
☝ Note that uptime is not related to the Performance component of OEE. Performance takes into account the speed of the line, but uptime does not – whether your line is running fast or slow, it still counts as uptime.
Why is Equipment Uptime Important
The importance of uptime is best understood through its direct benefits:
- Higher productivity (and revenue)
More uptime directly translates to higher production output, or productivity. This increased throughput allows you to fulfill more orders and meet customer demand, increasing revenue without investing in new machinery.
- Lower operating costs
Every minute of unplanned downtime incurs costs, from idle labor and wasted energy to expensive overtime to meet deadlines. By maximizing uptime, you minimize these reactive expenses. Furthermore, well-maintained equipment, which is inherently more reliable and has less unplanned downtime, also runs more efficiently (faster), leading to further savings on energy and material consumption.
- Reliable, predictable production
Consistent uptime transforms manufacturing from a reactive to a predictable process. When you can trust your machines to run as scheduled, production planners can create accurate schedules and forecast capacity with confidence. This allows you to make dependable delivery promises.
- Better quality and customer satisfaction
Frequent stops and starts are often a source of quality deviations, leading to increased scrap and rework. A stable production process, characterized by high uptime, results in more consistent product quality.
How to Calculate Machine Uptime
Uptime can be expressed in two ways: as a total duration (in hours and minutes) or as a rate (a percentage). While knowing the total uptime is useful, converting it into a rate provides a much more powerful KPI for tracking performance.
In manufacturing, the most practical approach is to calculate this rate against the time you have scheduled for production. Although some sources calculate uptime against total calendar time (24/7), that method is better suited for measuring total asset utilization, and it is more typical for continuous 24/7 operations. This is very common in the information technology sector, where the term “uptime” is even more popular, but in the case of manufacturers, not all of them operate around the clock. For most factories, focusing on scheduled time gives a more direct and actionable insight into shop floor effectiveness.
The calculation involves two simple steps:
1. Calculate total uptime
First, find the total uptime duration by subtracting all downtime from your scheduled production time.

What is the “scheduled production time”, exactly? This is the time when your equipment is expected to be productive, and that’s not the same as the time you schedule for the shift. It is time scheduled for the shift minus planned downtime excluded from OEE.
Some examples of planned downtime excluded from OEE are:
- maintenance shutdowns,
- major plant overhauls,
- no production demand.

This is a very important nuance that will make a big difference in your calculations. Refer to our detailed explanation of the difference between planned and unplanned stops.
2. Calculate the uptime rate
Next, convert the total uptime into a rate by dividing it by the scheduled production time.

A practical example: dried fruit packaging line
Let’s walk through a realistic day for a packaging machine at a dried fruit factory. The morning shift started well but was interrupted by a film jam that stopped the line for 10 minutes. Once cleared, the operator performed an efficient, 20-minute changeover to switch from packaging apricots to figs, and the line ran smoothly until lunch. The operator then took their scheduled lunch break.
The afternoon shift faced a significant delay when the line ran out of bags, resulting in a 25-minute wait for a new supply to arrive. The day’s planned activities concluded with a quick, 10-minute scheduled cleaning of the machine’s sealing jaws before the shift ended.
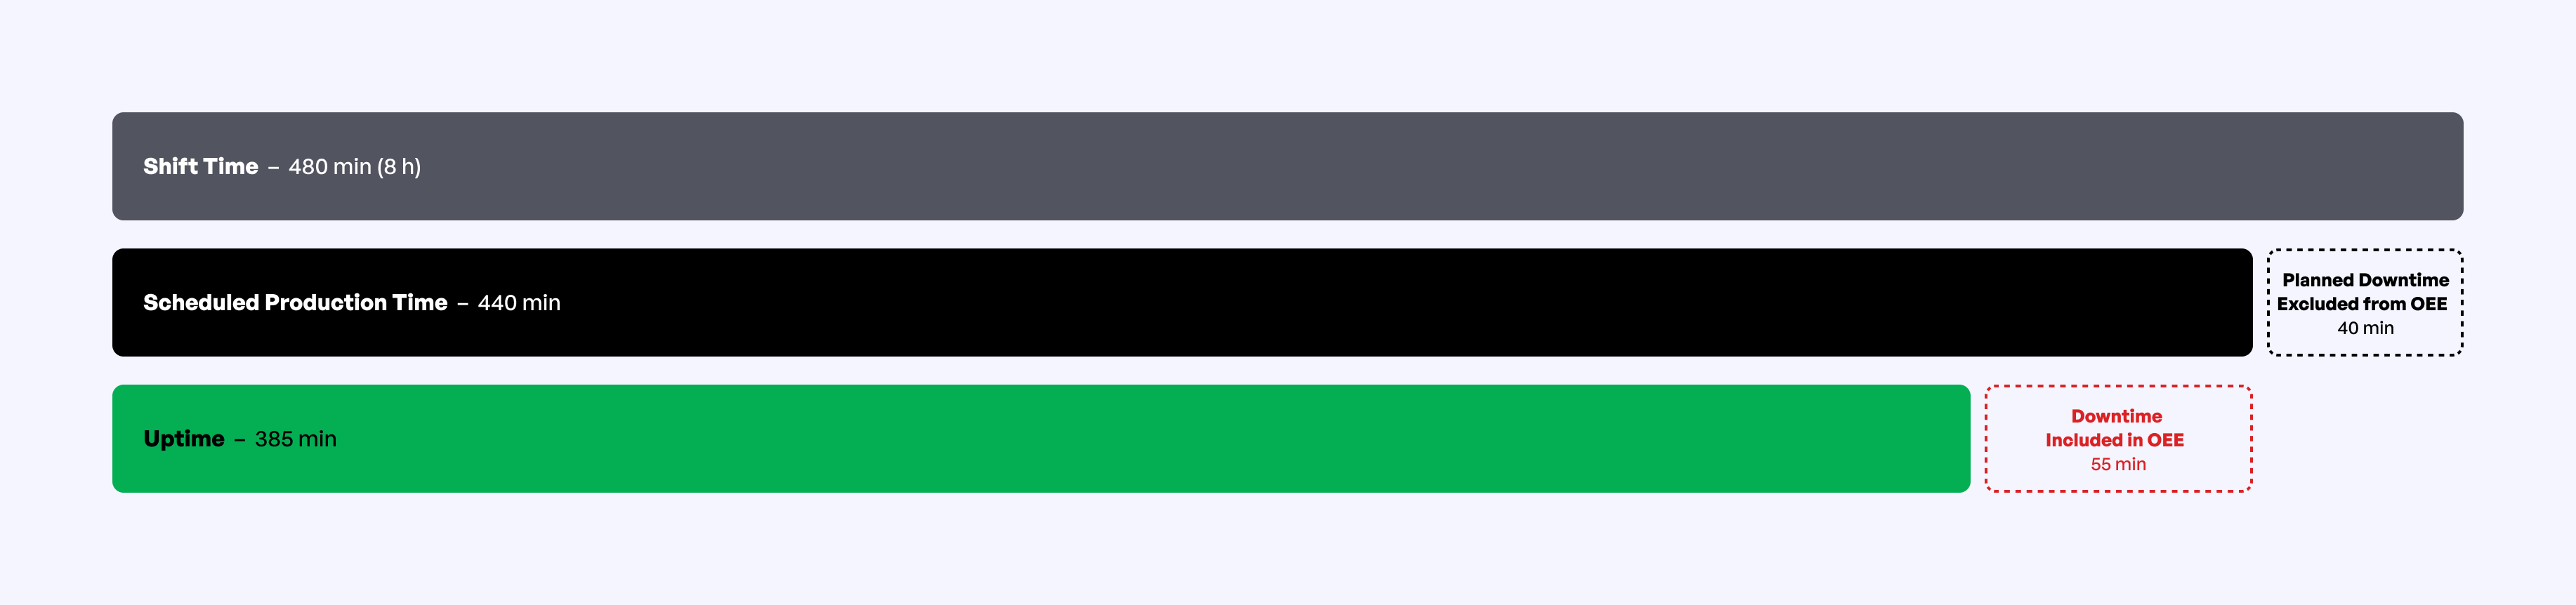
- Determine total shift time:
8 hours = 8×60 = 480 minutes - Identify and calculate planned downtime excluded from OEE:
This is time the machine is intentionally stopped for necessary, scheduled activities which are not a target for improvement. For this shift, the log shows:
Employee Break: 30 minutes for the operator’s scheduled lunch.
Routine Maintenance: 10 minutes for a planned cleaning and lubrication of the machine’s sealing jaws.
Total Downtime Excluded from OEE = 30 + 10 = 40 minutes - Calculate scheduled production time:
This is the time when you actually plan to produce. It’s the total shift time minus your planned stops excluded from OEE.
Scheduled Production Time = 480 minutes – 40 minutes = 440 minutes - Identify and calculate unplanned downtime and planned downtime included in OEE:
These are the unexpected stops that occurred during the 440 minutes of scheduled production time.
Equipment Failure: 10 minutes due to a single packaging film jam.
Material Shortages: 25 minutes spent waiting for a new supply of empty bags to be brought to the line.
Changeover is a planned stop that is still categorized as “included in OEE”, because it is a target for improvement, as explained in our article about the types of downtime in manufacturing:
Changeover: 20 minutes to switch the line from packaging apricots to figs.
Total Unplanned Downtime = 10 + 25 + 20 = 55 minutes - Calculate uptime:
This is the total time the machine was actually running during the scheduled production period.
Total Uptime = Scheduled Production Time – Total Unplanned Downtime
Total Uptime = 440 minutes – 55 minutes = 385 minutes - Calculate the uptime rate:
Finally, we calculate the rate by comparing the actual uptime to the scheduled production time.
Uptime Rate = (385 minutes/440 minutes) × 100% = 87.5%
In this scenario, the machine’s uptime rate for the shift is 87.5%. This figure accurately reflects that the machine ran reliably during the period it was actually scheduled to be productive.
How to Track Uptime with Evocon
The most effective way to track uptime is by moving from manual logs and spreadsheets to an automated production monitoring system. A system like Evocon provides objective, second-by-second data, giving you a true picture of what is happening on your shop floor.
To see how this works in practice, the video below provides a detailed walkthrough of the Evocon system. You will learn how our color-coded Shift View gives you an instant, real-time understanding of your production status. We also explain how to use Reports to see your total uptime over any period and clarify the important distinction between uptime as a total duration and uptime as a percentage – what is known in OEE as Availability.
☝ There’s a nuance regarding speed loss (the yellow parts on the Shift View). As per OEE theory, there are two types of speed loss: slow cycles and micro stops. There is a good reason to attribute micro stops to speed loss, and not to downtime, according to OEE theory. But when it comes to uptime, you could argue that, strictly speaking, machine uptime should be registered only during slow cycles, but not during micro stops.
That being said, in most cases, it isn’t possible to distinguish between slow cycles and micro stops using sensors that count products – such sensors essentially do not know if the slower frequency of products is due to a slower running line, or small but frequent stops of the line. Therefore, it is more practical to consider all slowdowns to be part of machine uptime.
How to Maximize Uptime in a Factory
Maximizing equipment uptime is an effort that combines technology, optimized processes, and a proactive culture. It requires moving from a reactive “run-to-failure” model to a strategy that anticipates issues and improves reliability.
1. Build a foundation with high-quality assets
Uptime starts with the equipment and parts you choose to bring into your facility.
- Invest in reliable machines and parts:
When procuring new equipment, uptime should be a primary factor in your decision. High-quality machines from reputable vendors are designed with greater precision and more reliable components, leading to longer life and less maintenance.
- Optimize spare parts management:
A significant portion of maintenance-related downtime can be attributed to waiting for parts. To minimize Mean-Time-to-Repair (MTTR), you must have a smart inventory strategy. This involves keeping critical, custom, or long-lead-time parts in stock while ensuring quick access to common parts through local distributors to avoid unnecessary delays and premium shipping costs.
2. Implement a proactive, data-driven maintenance program
Shifting your maintenance strategy from reactive to proactive is the single most effective way to reduce unplanned downtime.
- Embrace Predictive Maintenance (PdM):
The goal of PdM is to anticipate equipment failures before they happen. This is achieved through Condition Monitoring, where sensors track key parameters like vibration, temperature, current, and noise to detect signs of deterioration. Analyzing this data allows you to schedule maintenance at the optimal time – just before a failure occurs, thus avoiding breakdowns and extending equipment life.
- Utilize a CMMS with standardized codes:
For the maintenance events that do occur, a Computerized Maintenance Management System (CMMS) can streamline your response. Implementing PFA (Problem-Failure-Action) codes helps to quickly and accurately identify the issue and the required action, which reduces repair time and gets the machine back online faster.
☝ Evocon integrates with CMMS systems: read our overview
- Automate your production tracking:
The first step is to replace manual, often inaccurate, data collection with an automated system. Using IIoT sensors and production monitoring software allows you to accurately capture every minute of uptime and downtime in real-time.
☝ Learn more from a concrete example: IIoT sensors and hardware provided by Evocon
3. Analyze the root causes of downtime
Once you have accurate data, you can identify your biggest problems.
- Prioritize with Pareto Analysis:
Use a Pareto chart (the 80/20 rule) to rank your downtime reasons by frequency or duration. This shows you the “vital few” problems that are causing the majority of your production losses, ensuring you focus your efforts where they will have the greatest impact.
- Dig deeper with Root Cause Analysis (RCA):
For your top 2-3 downtime reasons, use a formal RCA method like the 5 Whys or a Fishbone Diagram. This helps you move beyond fixing symptoms to find and eliminate the underlying cause of the problem, preventing it from happening again.
4. Optimize processes and empower your team
Even the best equipment will suffer from poor processes and untrained personnel.
- Develop and standardize procedures (SOPs):
Inefficient processes for tasks like changeovers, clearing jams, or staging materials are a common source of downtime. Use data to identify these bottlenecks and develop standardized, efficient Standard Operating Procedures (SOPs) to ensure tasks are performed consistently and quickly across all shifts.
- Standardize downtime reasons:
Work with your operators to create a clear, standardized list of downtime reasons. Their accurate input is essential for your data analysis to be effective.
- Invest in training and leverage expertise:
The operator who runs a machine every day is often the best person to monitor its health and notice when something is wrong. Proper training empowers operators to identify early warning signs and resolve minor issues before they escalate. For complex problems, leveraging seasoned, specialized technicians can drastically reduce troubleshooting and repair time.
- Provide live dashboards:
Displaying real-time production data on the shop floor gives operators immediate feedback and a sense of ownership. When they can see the impact of stops in real-time, they become active participants in the improvement process, shifting the culture from “who is to blame?” to “what does the data show?”.

Why More Uptime Isn’t Always Better
While maximizing uptime is a critical goal, pursuing the highest possible uptime percentage at all costs can be counterproductive. The true objective is not simply more uptime, but effective uptime that contributes to the overall health of the business. Chasing a metric without considering the wider context can lead to several negative consequences, which we list below.
1. The cost of deferred maintenance
One of the easiest ways to temporarily increase uptime is to skip or postpone planned maintenance activities. While this may improve the numbers for the week, it’s a shortsighted strategy that increases the risk of a major equipment failure, resulting in far more damage in the future.
2. The waste of overproduction
Running a machine just to keep its uptime metric high when there is no customer demand for the product is a classic example of waste. This is known in Lean Manufacturing as overproduction – producing more than what is needed, sooner than it is needed. This practice ties up capital in raw materials and creates excess inventory that costs money to store, manage, and transport, without adding any value.
3. Uptime at the expense of quality or performance
Availability, which is directly influenced by uptime, is only one of the three components of Overall Equipment Effectiveness (OEE), alongside Performance and Quality. A relentless focus on uptime can negatively impact the other two:
- Ignoring quality:
Operators might be pressured to keep the line running even when they notice minor quality deviations, leading to an increase in scrap and rework.
- Slowing down performance:
A machine might be run at a slower speed than its ideal cycle time to avoid breakdowns, jams, or minor stops, which negatively impact the Performance metric.
In both scenarios, the machine is “up,” but it isn’t operating effectively, which ultimately harms profitability.

4. The law of diminishing returns
The resources required to gain an extra percentage point of uptime are not linear. The effort and cost to go from 95% to 96% uptime can be exponentially higher than going from 80% to 81%. At a certain point, the investment required to eliminate the last few sources of downtime may exceed the financial benefit gained. It’s often more profitable to accept a high, stable uptime rate and allocate those resources to other improvement areas.
The ultimate goal is to reduce unplanned and inefficient downtime, not to eliminate necessary stops for maintenance or to produce goods that are not needed. True operational excellence comes from a balanced approach that optimizes uptime in harmony with quality, performance, and real customer demand.
Key Takeaways
- Uptime is a foundational manufacturing metric that represents the time your equipment is operational during its scheduled production period. When expressed as a percentage, it forms the Availability component of OEE.
- Maximizing uptime is a core business strategy, not just an operational goal. It directly leads to higher productivity, lower operating costs, more reliable production planning, and better product quality.
- The most actionable way to calculate uptime for shop-floor improvement is against your Scheduled Production Time. This provides a more practical measure of operational effectiveness than calculations based on total calendar time.
- A systematic, data-driven approach is key to improvement. This involves automating data collection with an IIoT system, using analysis to find the root causes of downtime, shifting to a proactive maintenance strategy like Predictive Maintenance (PdM), and optimizing your Standard Operating Procedures (SOPs).
- The goal is effective uptime, not just more uptime. Pursuing the highest possible uptime percentage without context can be counterproductive, leading to deferred maintenance, overproduction, or poor quality. A balanced approach that improves overall operational effectiveness is the most successful strategy.