The journey to becoming a green manufacturer isn’t possible without calculation and reduction of carbon footprint. Let’s deep dive into what carbon footprint is, why it matters, how manufacturers calculate it, and how Evocon can help on your journey to net-zero.
Manufacturers are on a journey to become more sustainable. And rightly so, as the manufacturing industry is directly responsible for approximately one-fifth of the world’s carbon emissions (one-fourth in the US). It’s a daunting statistic, but it also holds an opportunity to improve and do better.
As we observe many of our customers working towards their climate goals, we want to share what we’ve learned to support your success.
Carbon Footprint Definition
A carbon footprint is defined as “The quantity of Greenhouse Gases emitted into the atmosphere by an individual, organization, product or event within a specified boundary”.
(Pandey, Agrawal, & Pandey, 2011)
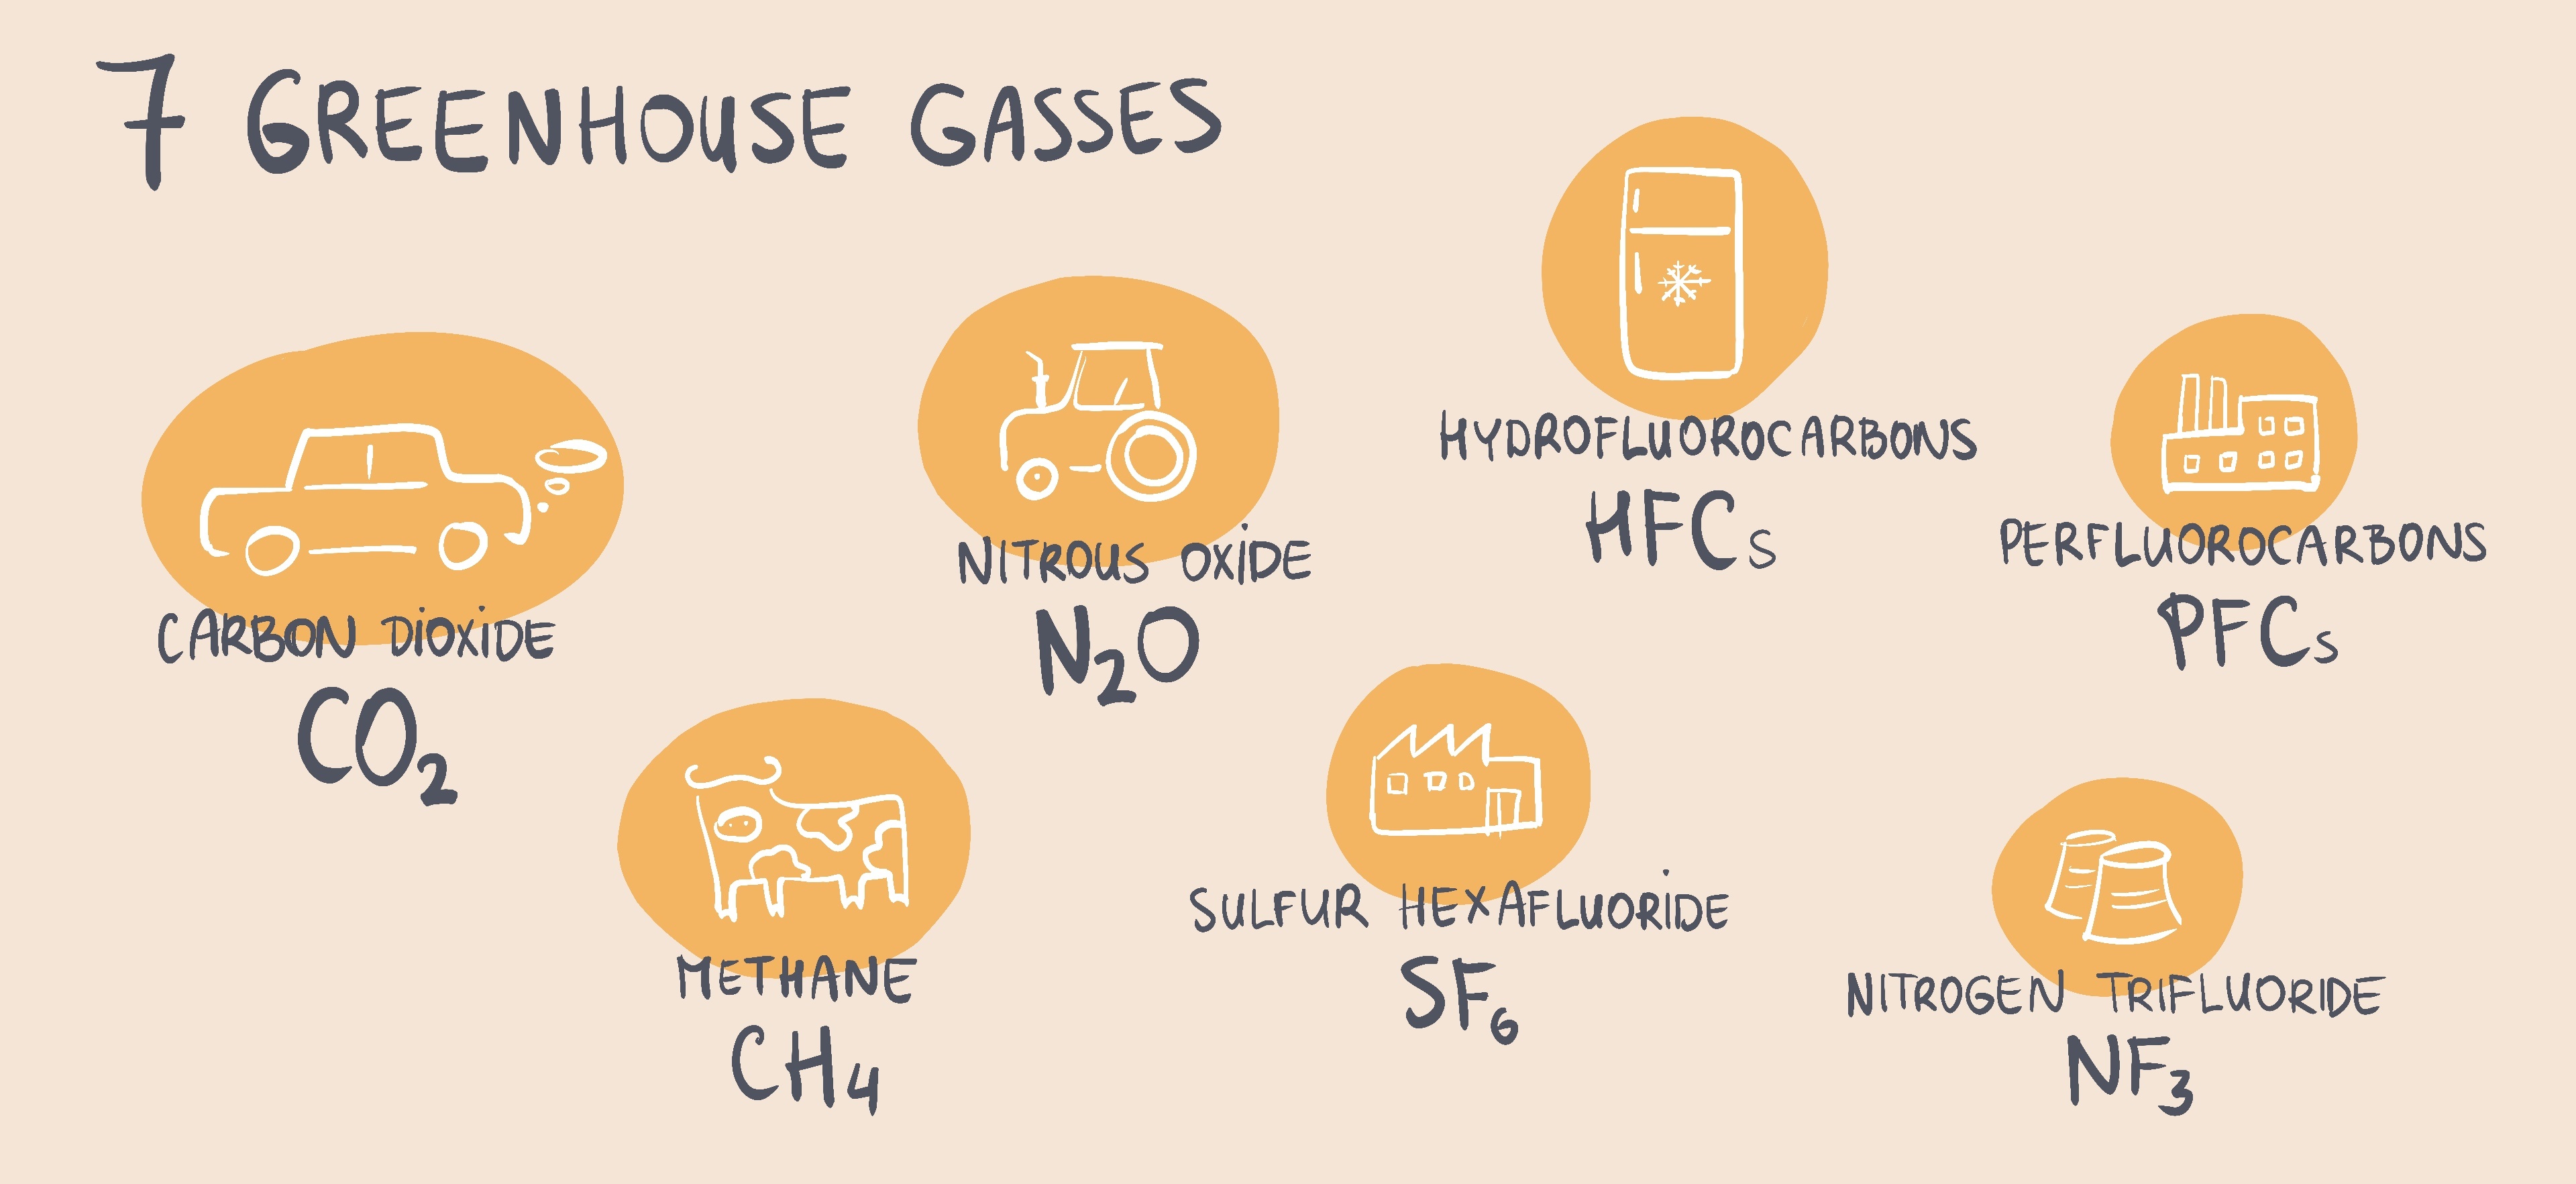
Although carbon dioxide is one of the most commonly known gases contributing to global warming, it’s not the only one we consider when calculating a carbon footprint. Each of the seven gasses used in the calculation occurs in different processes, have different chemical properties, and has a different global warming potential.
The 7 gases included in the Greenhouse Gas Protocol (more on what this is later in the article) are:
- Carbon dioxide (CO2)
- Methane (CH4)
- Nitrous oxide (N2O)
- Hydrofluorocarbons (HFCs)
- Perfluorocarbons (PFCs)
- Sulfur hexafluoride (SF6)
- Nitrogen trifluoride (NF3)

For example, carbon dioxide enters the atmosphere through burning fossil fuels (coal, natural gas, and oil), solid waste, trees, and other biological materials, and also as a result of certain chemical reactions (e.g., manufacturing of cement).
Methane is emitted during coal, natural gas, and oil production and transportation. Methane emissions also result from livestock and other agricultural practices, as well as land use and the rotting of organic waste in municipal solid waste landfills. Although the amount of methane emitted globally is 8-10 smaller than carbon dioxide, its GWP (global warming potential) is 28. That means that methane warms the atmosphere 28 times more than carbon.
Why a Company’s Carbon Footprint Matters
Carbon footprint is one of the key KPIs companies can use to evaluate their non-financial performance. There are several reasons why a company’s non-financial performance has become important.
First, it’s been proven that companies with better non-financial performance (based on ESG criteria) offer better financial results.
Secondly, business leaders are increasingly aware of the impact climate change already has and will have on their business (e.g., severe weather causing supply chain disruptions and lack of raw materials).
Last but not least, companies are facing increasingly higher expectations from regulators and consumers.
Calculation of the carbon footprint can offer the company valuable insights into where resources (money and energy) are spent in their operations. And once there’s data, there can be data-driven decisions on reducing resource consumption.
All activities that go into producing an item contribute to the company’s total carbon footprint. For example, one of the largest food production companies, Nestle, recently published its sustainability report.
Based on the GHG emission calculation, they know that 95% of their GHG emissions came from activities in their supply chain (such as farming and shipping) and are related to dairy and livestock ingredients.
Once they had this insight, they could start to understand the main contributors to generating emissions and what they can do to reduce them.
In other companies, such as the cement manufacturing company SCHWENK, the business model at its core is tied to the generation of GHG gasses. The production of cement requires burning it, and during the process, the key ingredient, limestone, releases CO2 emissions. However, once that was clear, they could start to work on solutions. Currently, the company is one of the first in its industry to build a carbon capture plant and is aiming to be the first carbon-neutral cement plant by 2030.
Kick off your sustainability journey
Contact our team to start improving the efficiency of your operations and become more sustainable.
How Manufacturing Companies Calculate Their Carbon Footprint
After reviewing our customer’s sustainability communication and CSR reports, we’ve concluded that most manufacturers have chosen to follow the internationally renowned GHG Protocol to calculate their carbon footprint.
The basic idea behind the Greenhouse Gas Protocol is to offer a scientifically verified and globally used framework for calculating the environmental impact. The GHG Protocol can be used by companies, cities, and countries.
Scope 1, 2 and 3 explained
As part of the process, companies gather data internally from partners and suppliers and then input all this data into an excel spreadsheet or a software tool. Companies following the GHG Protocol categorize all these activities in 3 scopes.
Scope 1 refers to emissions the company is responsible for directly, for example, energy used in the company facilities or fuel used to drive company vehicles.
Scope 2 included all the activities that the company is accountable for indirectly, for example, waste generated in operations, business travel and employee commute, and purchased goods and services.
Scope 3 is the most complicated part of the calculation. Still, it’s also the one that can sum up to 90% of a company’s carbon footprint. The activities included here are the transportation of the products, use of sold products, end-of-lifecycle treatment of sold products, etc.
Data for carbon footprint calculation
Many data points go into the calculation of carbon footprint. For example, to calculate the carbon footprint from energy use in the factory, a company needs to gather data on:
- what is the carbon intensity of the energy they used (based on the energy mix – renewable vs. nonrenewable);
- the amount of electricity used.
To calculate the carbon footprint of a company’s transport fleet, a company needs:
- data on the amount of fuel used;
- the fuel’s carbon intensity (kilograms of CO2 emitted per liter of fuel combusted).
What does a company’s carbon footprint mean?
Thanks to the GHG Protocol, each activity company undertakes can be calculated in one simple number – a CO2e (carbon dioxide equivalent or often referred to as GHG or carbon footprint).
For example:
- Nike FY2021 GHG emissions are 119,141 tons of CO2e (44% reduction from 2020)
- IKEA FY21 is estimated to be 26.2 million tonnes of CO2e, a decrease of 5.8% in absolute terms compared to the baseline FY16, but an increase of 5.7% compared to FY20.
- Coca-Cola’s global manufacturing sites produced 5.24 million metric tons of GHG emissions in 2020. This was was a reduction of six percent compared to 2019 levels.
For context, an average tree absorbs 25 kg of CO2 per year. So we can estimate that it would take:
- 4’765’640 trees to absorb Nike FY2021 GHG emissions
- 1’048’000’000 trees to absorb IKEA FY2021 GHG emissions
- 209’600’000 trees to absorb Coca-Cola 2020 GHG emissions.
What does product carbon footprint mean?
Some manufacturers (also among our customers) have taken their efforts to the next level and calculated one more metric to measure their progress – the product’s carbon footprint.
Maybe you’ve seen this even displayed on product packaging. For example:
- a standard 330ml can of Coke embodies the equivalent of 170g of carbon dioxide (CO2e)
- a pair of Levi’s 501 jeans equates to 33.4 kg CO2e which would equate to 69 miles driven by the average US car
To calculate product carbon footprint a Life Cycle Assessment (LCA) methodology is used. The goal of this process is to view the whole life cycle of the product from raw material sourcing to how it’s been used by the customer, to the emissions it generates after disposal.
Life Cycle Assessment offers insights on what aspects of the product have the highest impact on the environment and creates opportunities to improve the product based on these priorities.
For example, the LCA methodology was applied by a large food producer who wanted to promote plant-based milk as an environmentally preferable to animal-based (dairy). To make this claim publicly, they hired Deloitte consultants to carry out the LCA of the two products they are comparing.
Real-time monitoring to reduce resource consumption
Now that we’ve reviewed what makes up a carbon footprint of a company and a product, it’s clear that the manufacturing processes significantly contribute to both. That’s why more and more companies are working on ways to improve the efficiency of their operations.
Reducing the carbon footprint of the manufacturing plant reduces the company’s GHG emissions and products’ carbon footprint.
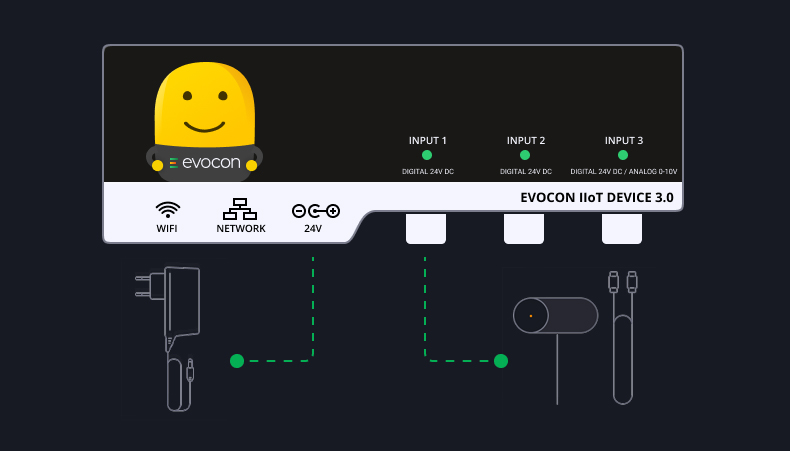
Evocon already today is working with manufacturers to track temperature and electricity in real-time. The real-time data combined with OEE enables our customers to:
- notice abnormalities and fix them before resources have been wasted;
- draw conclusions on when most resources are used;
- make data-driven decisions on how to improve the processes.
If you would like to learn more about how other manufacturers work on becoming more sustainable, read our article on Green Manufacturing or reach out to our team to learn more.

