OEE (Overall Equipment Effectiveness) is one of the most frequently used terms on the shop floor. But what exactly does OEE mean in manufacturing? How does it work? And what are the metrics? Two shop floor experts; Mark Wetherill, productivity manager, and Aivar Künnapuu, operations manager, also the writers of “OEE at Work” give all the answers here, from the definition of OEE to methods of implementation.
From “OEE at Work” by Mark Wetherill and Aivar Künnapuu
What Is OEE (Overall Equipment Effectiveness)?
Overall Equipment Effectiveness, or OEE, is the gold standard for measuring manufacturing productivity. It is one of the fundamental concepts in lean manufacturing and a key performance driver for any production plant, production unit, workshop, or individual station.
Having a high OEE is a mark of a highly efficient factory with high productivity. A low OEE, on the other hand, means there is a “hidden factory” with unused resources that are producing losses where there should be value.
OEE is a powerful yet simple concept, but it performs only if we apply it rigorously, and its successful implementation requires proper preparation.
First, we need to establish a common understanding of the principles of value and waste, together with a systematic approach to gathering production data. Secondly, we should introduce an understanding of the benefits of OEE to the company, so everyone in the team understands why we have decided to implement the concept. It is also crucial to run a pilot project before continuing with more wide-scale adoption.
Finally, it is essential to understand the long-term improvement journey.
Here, our goal is to give you an in-depth understanding of the meaning of OEE and what principles to follow when implementing the concept.
OEE Definition
OEE (Overall Equipment Effectiveness) is a lean manufacturing tool and universal best practice to monitor, evaluate and improve the effectiveness of a production process. This could be an assembly line, machine cell, packaging line, filling machine, etc.
OEE definition
While we can see OEE as a performance measure or metric, its primary purpose is to drive improved asset performance. The use of OEE helps improve performance through visualizing, quantifying, and systematically eliminating sources of production loss.
Why OEE Matters Today? – The Hidden Factory
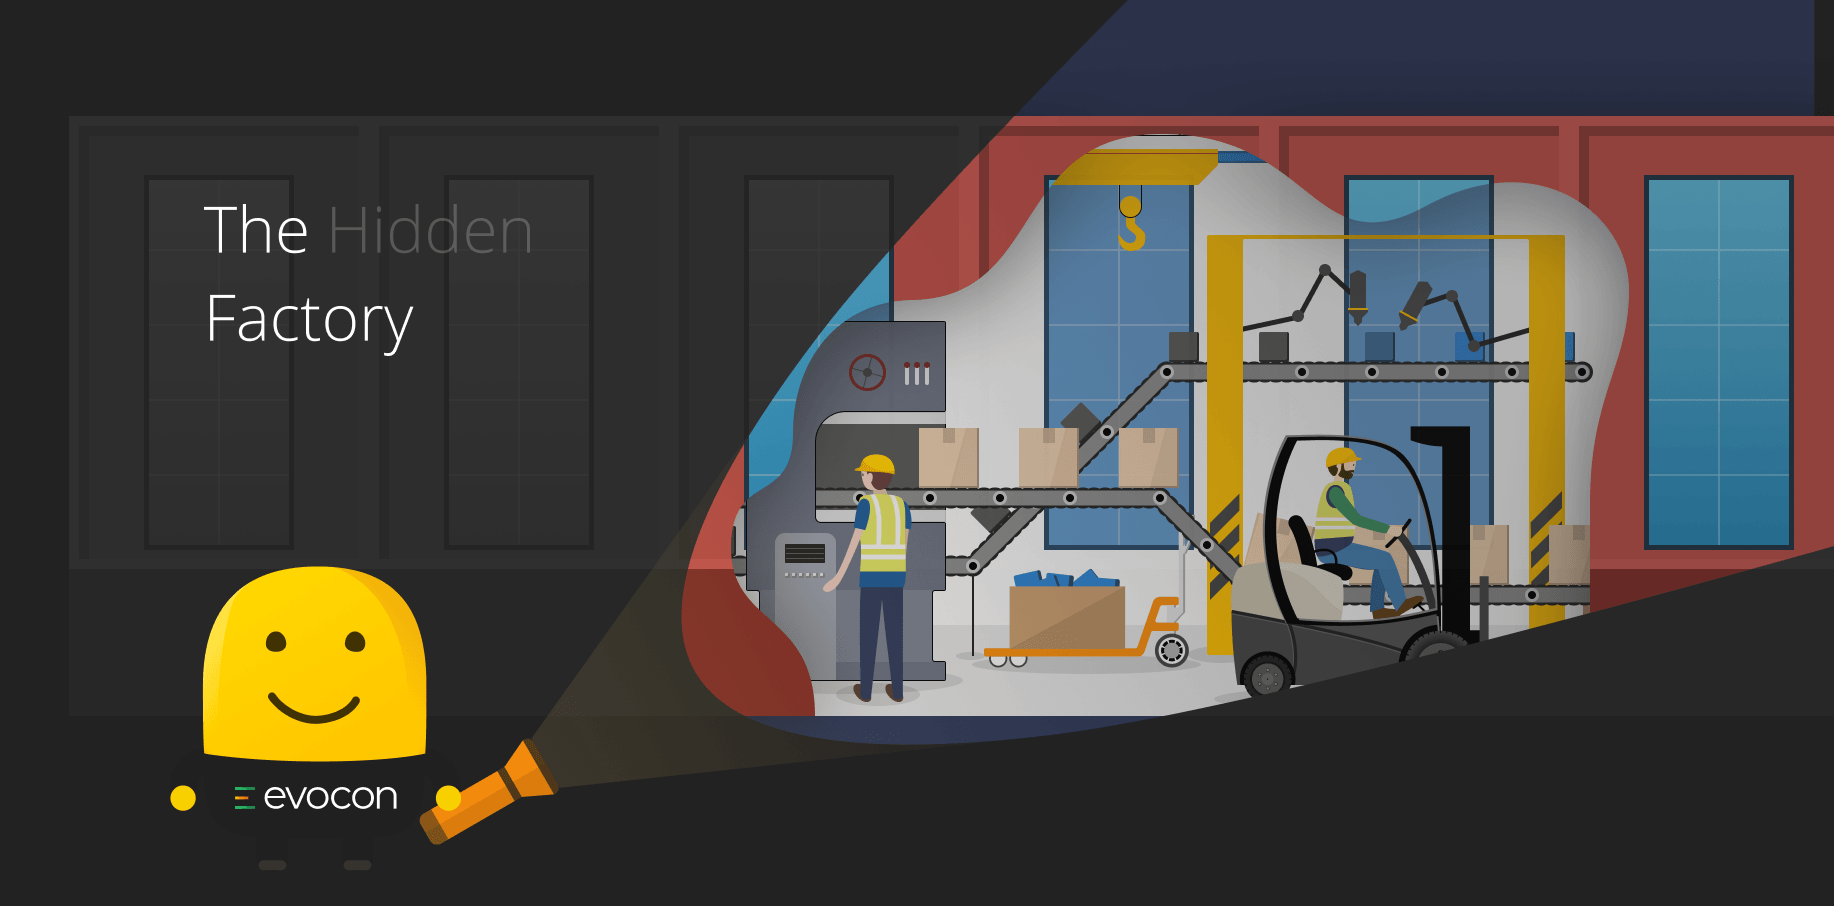
We use OEE because it helps us see and understand our production process. By quantifying and visualizing all losses from the production line and machines, OEE shows what we produced with our resources and what we could have produced – our hidden factory. In other words, by tracking and visualizing it on an OEE dashboard, we start to understand the true potential of our factories.
It also helps us focus our resources and direct our maintenance strategy more precisely because it reveals to us what is happening on the shop floor and what are the actual problems. E.g., losses caused by organizational factors such as staffing, material supply, planning, and changeovers.
OEE in production is not only an indicator of performance but, more importantly, a continuous improvement tool that allows us to eliminate waste and target “the six big losses in manufacturing” that are present in virtually every production facility.
Wasting our resources and operating below our true potential is not a sustainable strategy today. Besides, using the concept of OEE in manufacturing can help companies remain competitive in the advent of Industry 4.0.
Learn more: Importance of OEE in manufacturing & How OEE can contribute to your organization.
Understanding OEE in Manufacturing– “The Six Big Losses”
OEE is a total measure of performance that helps focus improvement on the most critical (and common) areas of productivity loss. These fall into three primary categories:
- Availability
- Performance
- Quality
OEE shows us how effectively we utilize our plant and production equipment. It also shows how effectively we can deliver quality products to the customers.
The concept of the Six Big Losses has its origins in the development of TPM (Total Productive Maintenance). Production experts have tested and applied it over many years. The concept of the Six Big Losses relates directly to the “seven wastes” but more closely aligns shortfalls and losses to the impact these have on OEE.
Having an awareness and understanding of the Six Big Losses enables us to identify them in operation. Afterward, the focus is to eliminate or minimize its effect.
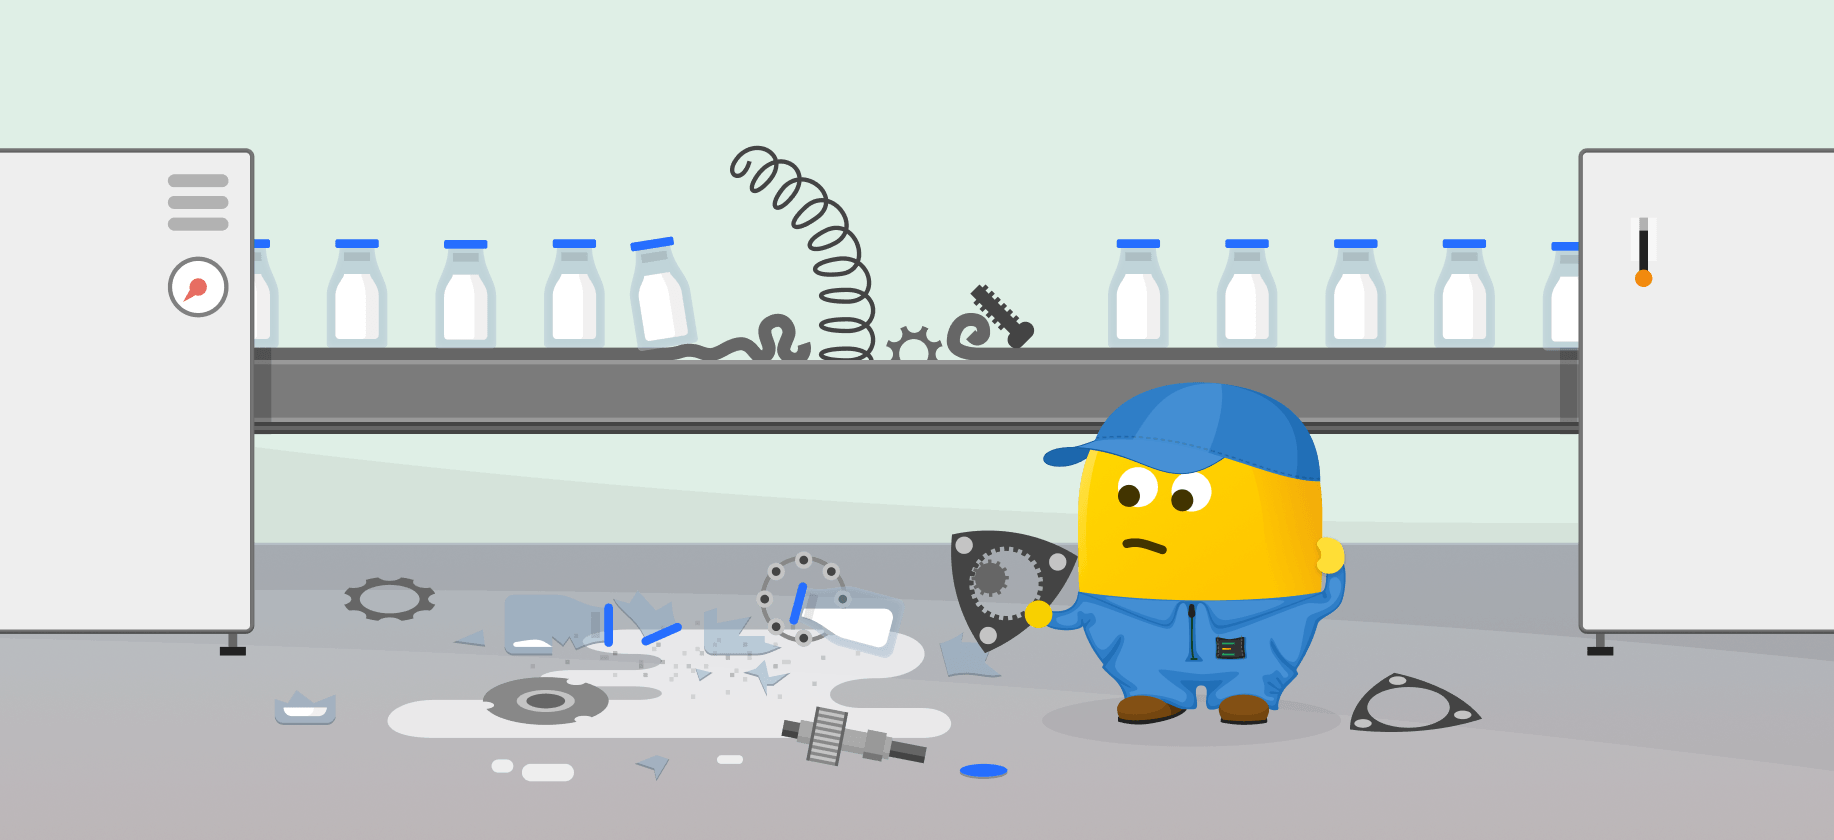
What is Availability?
Availability is the proportion of planned running time that is available for production. The losses in this category include unplanned and planned stops.
Unplanned stops form the time when equipment is scheduled for production but is not running due to unplanned events. Examples include equipment breakdowns, unplanned maintenance, lack of operators or materials, being starved by upstream equipment, or being blocked by downstream equipment.
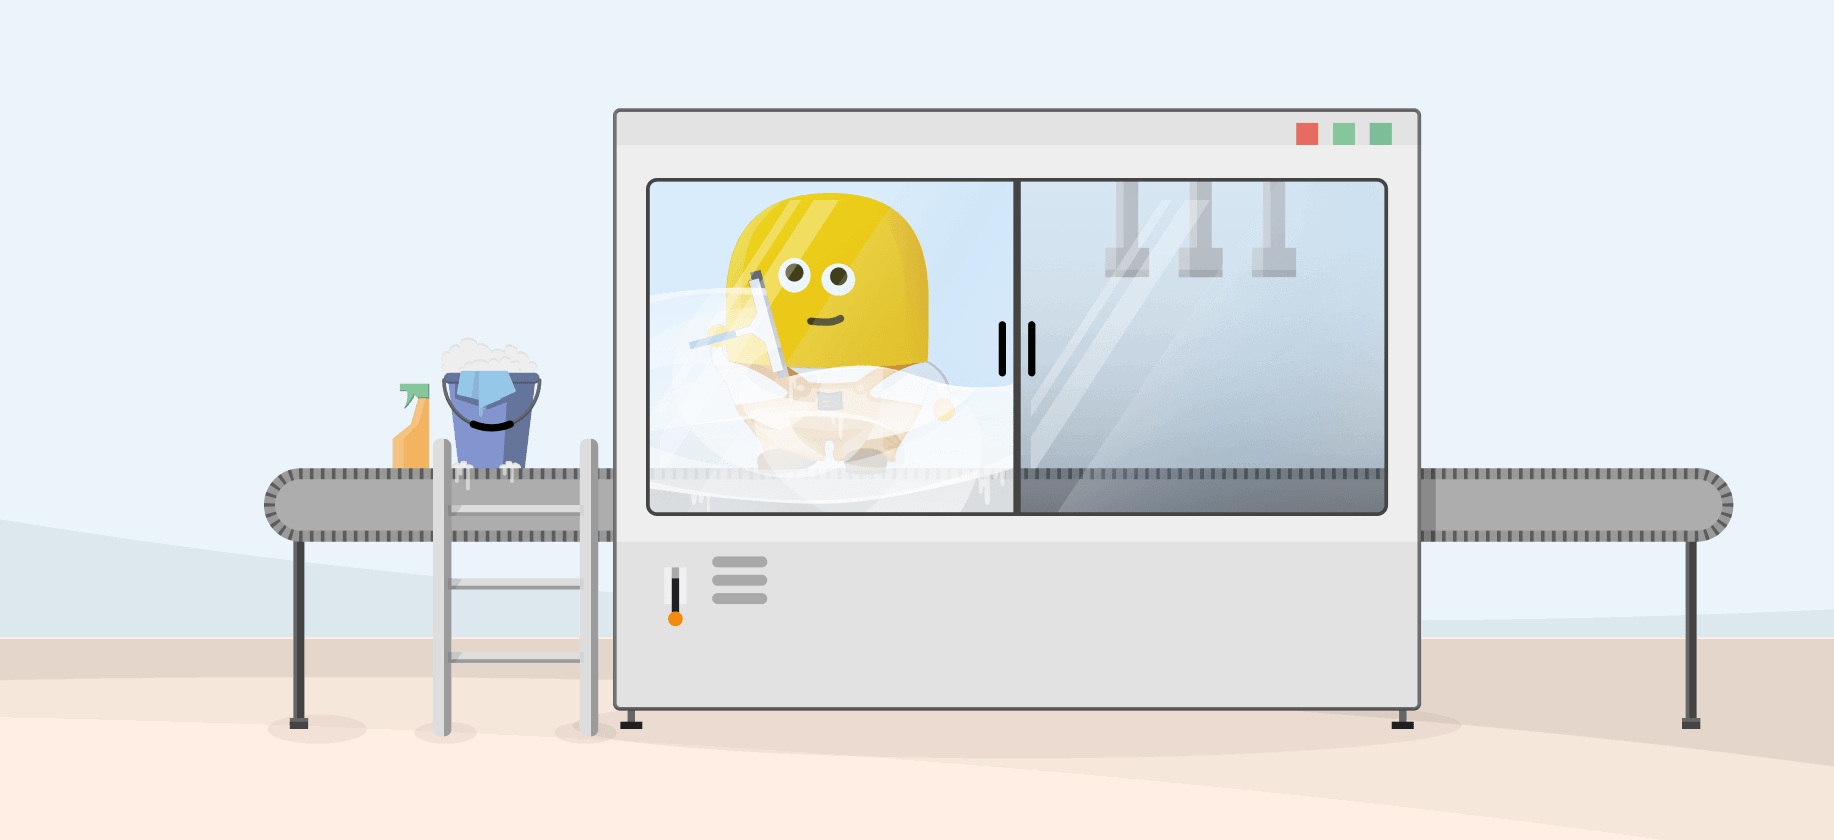
Planned stops form the time when equipment is scheduled for production but is not running due to planned events. Examples include changeover, tooling adjustment, cleaning, planned maintenance, and quality inspection. Paid rest breaks, meetings, toolbox talks, etc., also fall into this category.
The exact list of availability losses varies depending on the production process and company. However, a good start is to write down the most frequent machine breakdown causes and see how you can group them.
Learn more about availability loss, it’s possible causes and solutions.
An important note!
We do not categorize planned activities such as maintenance shutdowns and major plant overhauls as an availability loss. Therefore we do NOT use them in the calculation of OEE. Similarly, where lack of demand or seasonality dictates that we do not need to complete certain shifts or work in particular days, it is essential to exclude these from the calculation of OEE.
What is Performance?
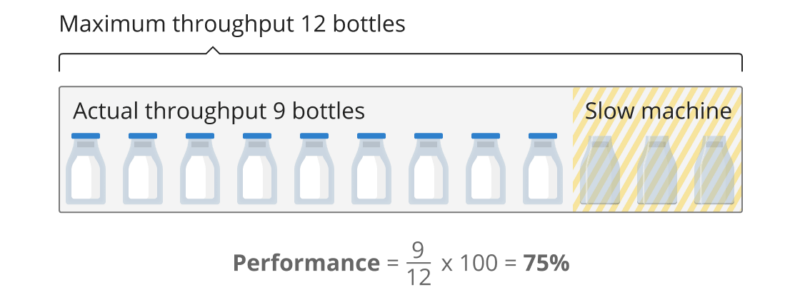
The second component of OEE compares the actual running speed of the plant or equipment against its specified operating speed. The specified run speed is often referred to as the “Maximum demonstrated rate” (MDR) or “ideal cycle time”. Performance is the actual throughput of the plant during the time it ran, compared to the maximum throughput that it could have achieved running at the MDR. We categorize performance losses as micro stops and slow cycles.
Micro stops – The time when the equipment stops for a very short period of time (typically a minute or less) with the stop. Often the operator solves the issue. They can be repetitive (same problem, different day), which can make operators blind to their impact. Examples include miss-feeds, material jams, incorrect settings, misaligned or blocked sensors, equipment design issues, and periodic quick cleaning.
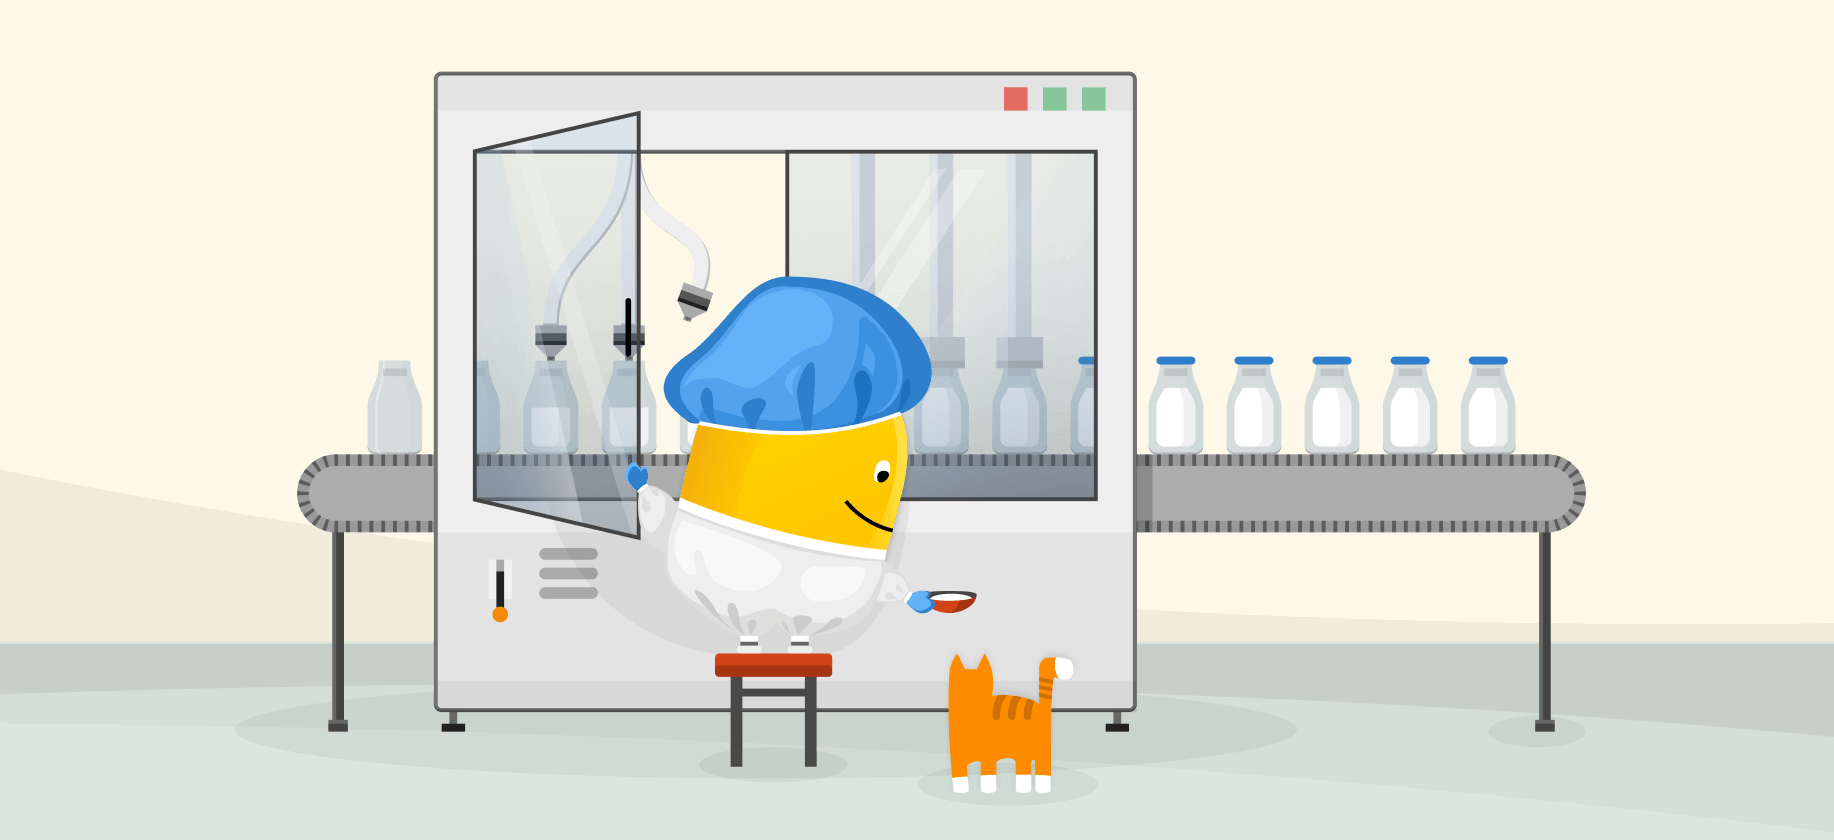
Slow cycles – The time when equipment runs slower than the “Nameplate” (the theoretical fastest time to manufacture one piece / ideal cycle time). It may be a consequence of dirty or worn-out equipment, poor lubrication, substandard materials, poor environmental conditions, wrong settings/adjustment in PLC or human factors (training, experience, etc.).
Find out more about machine breakdown causes and downtime tracking and analysis to get started with OEE.
Also, read more about performance loss, possible causes and solutions.
What is Quality?
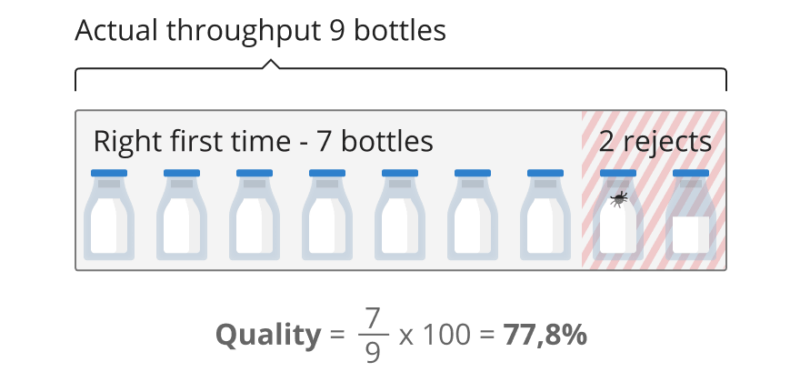
The third component of OEE measures quality, which is simply the proportion of actual production throughput which meets the customer specification exactly and is right the first time. Quality losses fall into two categories – production rejects, and start-up rejects.
Production rejects are defects that we have produced during stable (steady-state) production – including those that we can rework as OEE measures quality based on “Right First Time”. Examples include under or overweight bags, label problems, chemical or physical conformity issues, broken packaging, etc.
Start-up rejects are defects that we have produced from start-up until stable production. They can occur after any equipment start-up. However, production teams tend to track them the most after changeovers. Examples include suboptimal changeovers, equipment that needs “warm-up” cycles, or equipment that inherently creates waste after start-up.
Learn more about quality loss, it’s possible causes and solutions.
How to Calculate OEE (Overall Equipment Effectiveness)?
Please use our OEE calculator to quickly and easily estimate your OEE and “the hidden factory”. We also have a summary and examples of OEE formulas. Here in this article, we outline the steps you need to take in order to calculate OEE yourself.
OEE in production is the factor of all three components – availability, performance, and quality. The method of calculation is simple:
Availability x Performance x Quality
= OEE
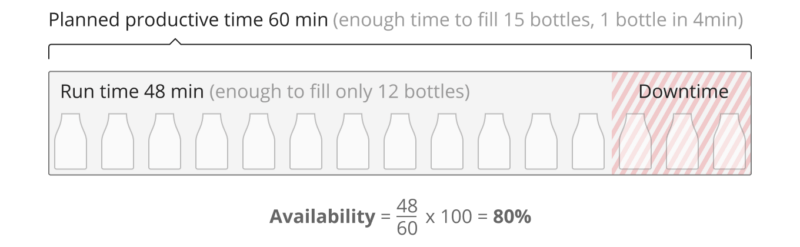
How to calculate availability?
- Identify and capture planned productive time. This is the sum of your scheduled shifts minus planned shutdowns and lack of demand.
- Identify and capture total downtime.
- Downtime % = Total Downtime / Planned Productive Time x 100%
- Availability % = 100% – Downtime % or Availability % = Run Time / Planned Productive Time x 100%
How to calculate performance?
- Identify and capture the available time for production (or “Up-time”).
- Identify and capture the actual throughput achieved.
- Calculate the maximum potential throughput (based on the MDR) during the available time for production.
- Performance % = actual throughput / maximum throughput x 100%
How to calculate quality?
- Identify and capture total production.
- Identify and capture the number of rejected products.
- Right First Time = total production – rejects
- Quality % = right first time / total production x 100%
Putting it all together
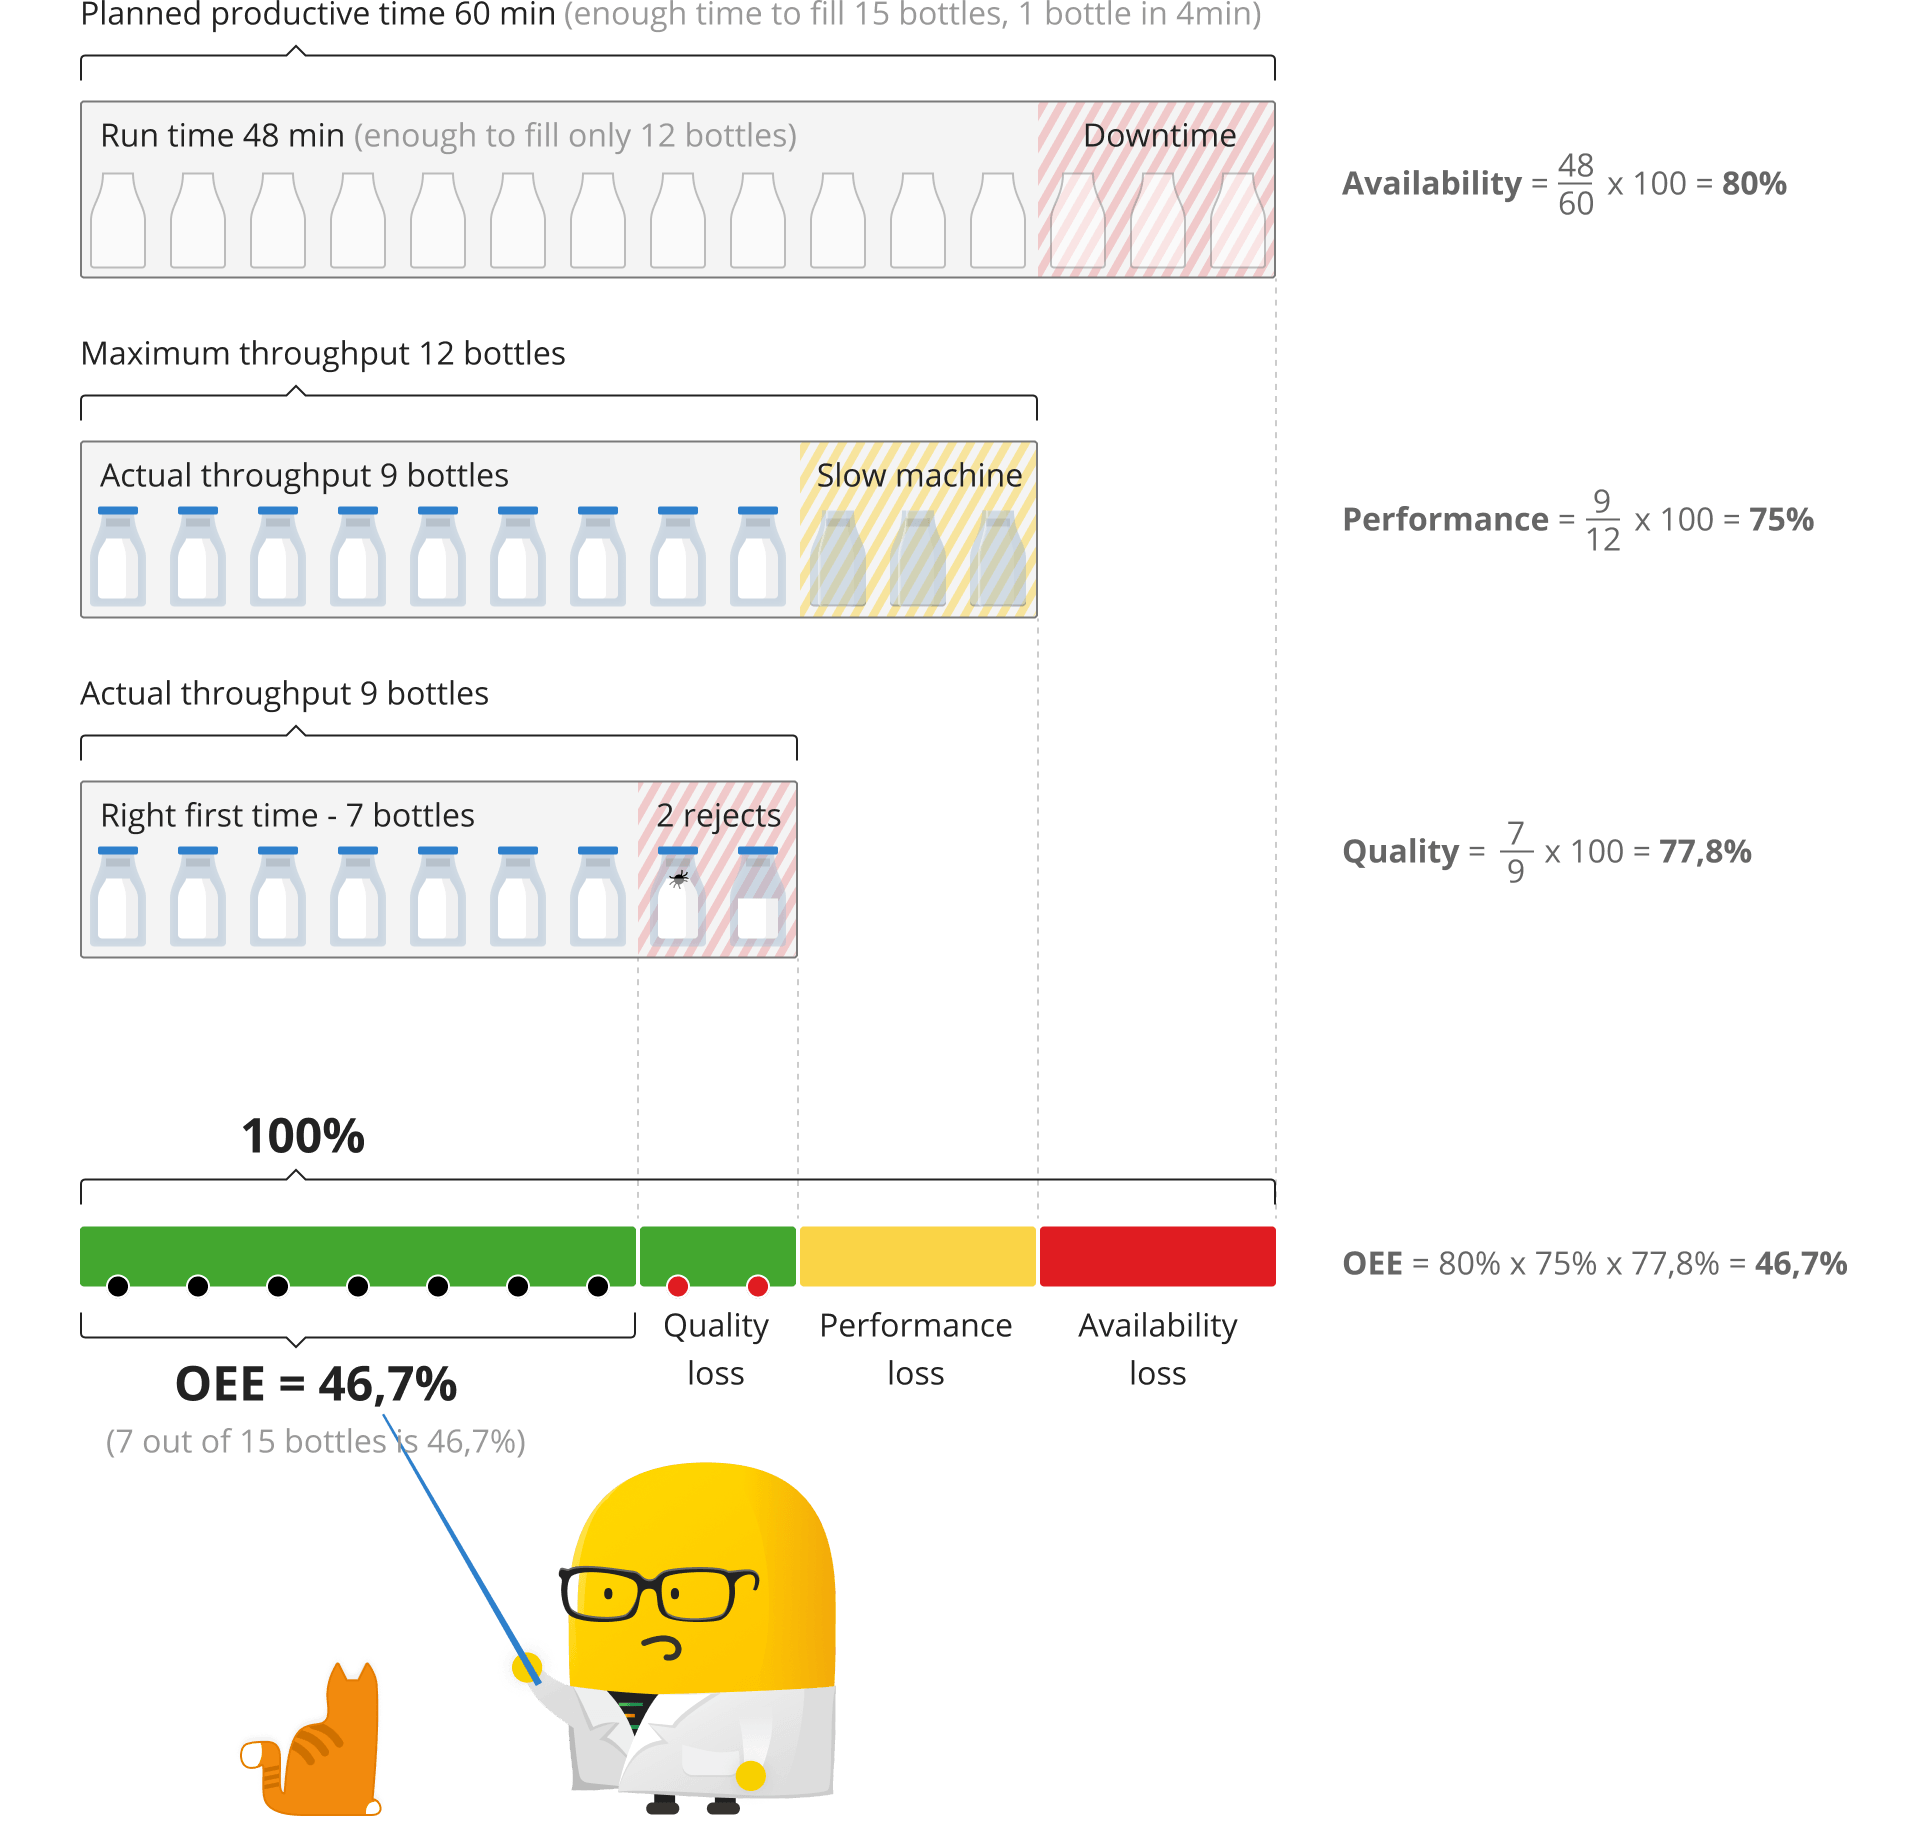
Interactive visualization of OEE components
Try this interactive tool to see how OEE components work together:
 This graph is interactive! (drag the dashed --- lines)
What Are the Common OEE Calculation & Monitoring Mistakes?
Availability
Availability losses are the most diverse source of losses in OEE (Overall Equipment Effectiveness) analysis. One of the common mistakes regarding availability is the tendency to exclude too many stops from OEE calculation.
As an example, operators and managers tend to exclude changeovers from the OEE calculation. On the other hand, we lose a lot of time during changeovers. The opportunity here is that we can schedule them much more efficiently.
For instance, when a changeover lasts for 60 minutes whereas it is scheduled to be 30 minutes, then there is a 30-minute loss in the process. And in some industries, this may refer to a significant loss in production. When thinking about the number of losses that might happen during a production day, it is crucial to identify where, when, and why they happen.
Performance
Another widespread problem is that manufacturers do not know the maximum potential throughput of their machines. Also, in most cases, they underestimate the actual production speed. This results in the performance % being over 100% and thus giving an incorrect OEE reading.
You can solve this by contacting your machine manufacturer and consulting them about the MDR. If that is not possible, you can set a benchmark based on the fastest recorded shift. Then, adjust set cycle times periodically based on the performance of your operators.
Quality
Regarding quality, then quite often, the challenge of calculating the correct quality % falls into two main issues:
- There is no reliable way of registering scrap automatically. Thus operators need to count rejects and enter the information manually.
- You receive quality information weeks after the actual shifts. You can solve this by including the data in the OEE calculation in hindsight.
Learn more: Top 8 OEE Calculation & Monitoring Mistakes
Take Action on OEE Today
Understanding what OEE (Overall Equipment Effectiveness) is and how it works is crucial in setting attainable OEE targets and maximizing machine utilization. It is equally important to properly set up your OEE monitoring by following a successful OEE implementation guide. This will ensure that you are on the right track towards achieving your goals.
As a lean manufacturing tool, OEE defines the way manufacturers think, plan, and execute. If you want to discover the true potential of your company as well as the losses which you can easily turn into value, Evocon’s overall equipment effectiveness software can always assist you on the way.