

 Product Overview
  Enterprise Package
  Integrations
  Security
  Hardware
  FAQ
FAQ 
 How Evocon Works
  OEE Monitoring
  Downtime Tracking
  Manufacturing Data Collection
  Production Monitoring
  Continuous Improvement
  Quality Control
 Learn
Learn  Case Studies
  Reports and Tools
  OEE Fundamentals
  Increasing Productivity
  Sustainability in Manufacturing
 The 5-Day Guide to Launch OEE Monitoring in 2026
 OEE Calculator
  ROI Calculator
  OEE Excel Template
  Evocon
  Contact
  Join us
  Sign in
 Back to main menu
Manufacturers today face various issues: raw material costs keep climbing, customers expect shorter lead times, and skilled labor is hard to find and keep. With tight margins, factories can’t afford to waste any of the resources they already have.
Optimizing a single machine or workstation helps, but real, lasting improvement comes from looking at manufacturing efficiency across the entire plant. When processes are synchronized across lines, shifts, and departments, facilities produce more good units in less time.
This article covers what manufacturing efficiency means at the plant level, how to calculate it, why it’s worth the effort, and six practical ways to improve it across your facility.
What Is Manufacturing Efficiency?
Manufacturing efficiency is about maximizing what you produce while minimizing the resources you consume. This means understanding how effectively your factory converts inputs (like time, labor, and raw materials) into desired outputs (finished products) with minimal waste and downtime. It tells you how close your plant is running to its true capacity, and how much is being lost to waste and downtime.
Production line efficiency and manufacturing efficiency use the same calculation, but it is applied with a different lens. Efficiency at the line level measures a line’s actual output against its maximum possible output, whether that line is a single machine, a workstation, or a full bottling line.
Manufacturing efficiency applies it to every line, shift, and department in the facility, capturing losses across the entire operation.
The Benefits of Improving Manufacturing Efficiency
Improving efficiency brings benefits across the organization. Here are a few examples:
- Lower operating costs
Less scrap, less unplanned downtime, and better use of labor all cut production costs. With shorter material-handling distances and less idle machine time, you can also reduce utility bills and wear on equipment. - Increased output
A more efficient plant produces more within the same shift hours. This is because plant managers can find capacity in existing machinery and labor rather than committing to new equipment or increasing floor space. - More consistent quality
Rushed or delayed setups, operators using different settings or skipping steps from one shift to the next, and unstable machines all lead to defects. By standardizing shop-floor procedures, you can reduce scrap and downtime. - More reliable delivery
Unplanned delays and slow cycles can lead to missed or late deliveries. With more stable and predictable production, you can commit to tight delivery windows.
How to Measure Manufacturing Efficiency
Before moving on, it’s worth recapping the difference between efficiency, productivity, and effectiveness. These terms are often used interchangeably, but they each have distinct meanings:
- Productivity measures output relative to input, like units produced per labor hour.
- Effectiveness measures whether or not you achieve your goal.
- Efficiency measures output achieved per unit of input, relative to what’s possible.
There are different ways to calculate efficiency, but in this article, we focus on how effectively your plant converts its maximum production capacity into actual results. Here is the manufacturing efficiency formula:
Efficiency (%) = (Actual Output / Maximum Possible Output) × 100
- Actual output is the number of good, defect-free units produced in a given period.
- Maximum possible output is the maximum number of units the plant could produce under ideal conditions, with no downtime, speed, or quality losses.
Note: Using this formula, you will get the same result as your Overall Equipment Effectiveness (OEE) score. While efficiency offers a quick snapshot of performance, OEE helps you understand the “why” behind your efficiency losses.
Example:
A plant’s capacity for a shift is 12,000 units. Due to minor stoppages, changeovers, and scrap, the floor produces 9,840 good units.
9,840 ÷ 12,000 × 100 = 82%
An efficiency score of 82% means the plant is operating at 82% of its potential for that shift, with the remaining 18% lost to downtime, speed loss, or scrap.
Core Metrics to Track Alongside Manufacturing Efficiency
To find out what’s behind that number, you need a few more metrics.
- Overall Equipment Effectiveness (OEE)
OEE is one of the main manufacturing KPIs tracked across industries. It combines three factors into one score: OEE (%) = Availability × Performance × Quality
Tracking OEE across multiple lines lets plant managers compare equipment and shifts, and spot recurring downtime issues and bottlenecks. As mentioned above, depending on the efficiency calculation used, your OEE score and Efficiency percentage might be the same. - Throughput
Throughput is the number of units that can be produced in a given amount of time, such as 100 units per day or 5000 liters per minute. Monitoring throughput across lines helps managers see where the plant has bottlenecks. - Cycle time and Takt time
Cycle time is the average time to produce a single unit from start to finish. Takt time is the production pace required to satisfy customer demand. Comparing the two keeps the plant from overproducing while still meeting order deadlines. - Unplanned downtime
This is the total time lost to equipment failure, materials shortages, or unscheduled stoppages. Tracking it gives you a clear indication of where you can improve availability. - First-pass yield (FPY)
First Pass Yield measures the percentage of units that are produced the first time without any rework or repairs. High FPY indicates a reliable process and high quality. Low FPY leads to extra labor, wasted material, and delayed deliveries.
6 Ways to Improve Manufacturing Efficiency
1. Optimize layout and workflow
A poor layout costs you time every day, with operators walking long distances, carrying materials across facilities, and looking for shared tools. Depending on what you produce, there are different layouts to consider:
- Product layout
Machines and workstations are arranged in a straight line to match your production steps. - Cellular layout
Machines and processes are grouped by product family into cells, cutting travel distance and reducing WIP. - Process layout
Similar machines are grouped together, which works well for low-volume, high-variety production.
Though lean tools like 5S help clean and sort individual work areas, they don’t show how materials and information move throughout the entire facility. Value Stream Mapping (VSM) is the perfect tool for this. It maps every step from raw material arrival to shipment, and can help identify waste that is invisible at line level, such as:
- Parts that travel unnecessary distances between departments
- Work-in-progress (WIP) inventory building up between processes
- Delays waiting on quality sign-offs
2. Apply automation
Automation doesn’t have to mean high-speed robotic arms. Manufacturers can get real value from smaller, targeted automation that keeps material moving and handles manual, lower-value tasks for operators:
- Automated Guided Vehicles (AGVs) and Autonomous Mobile Robots (AMRs)
These can move raw materials and finished components between storage and production, freeing up operator time. - Automated material feeders
Specialized systems that add raw materials to production equipment, keeping feed rates consistent, preventing the stops that come with manual feeding. - Centralized alert systems
Systems that flag maintenance teams or operators automatically when a station needs attention.
3. Standardize quality checks
Consistent and standardized quality checks are vital to improving overall efficiency. Standard operating procedures (SOPs) that check quality throughout the process, not just at final inspection, catch problems earlier.
Without in-process checks, defects usually aren’t caught until it’s too late, and you can end up scrapping a whole batch.
With Evocon, manufacturers use the Checklists feature to digitize recurring production checks. Using real-time machine data, operators can perform the right tasks at the right time, increasing efficiency and quality across the board.
4. Train and support operators
Automation and software give you the tools, but your operators are still the ones making the factory work. Undertrained or less engaged operators are more likely to miss early signs of equipment wear and take longer on routine tasks like changeovers.
To avoid this, you can use:
- Cross-training
Train operators on multiple machines, so managers can reallocate labor if someone’s out or a line has a sudden increase in demand. - SMED (Single-Minute Exchange of Die) Training
Training in SMED helps cut setup and changeover time between production runs. - Visual Management
Using aspects of the visual factory, such as displaying targets on shop-floor monitors, keeps operators aware of the shift goal.
5. Cut energy waste
Costs due to air compressors, HVAC systems, ovens, and idling conveyors left running on inactive lines add up. Here are a few ways to reduce energy waste:
- Install smart meters to see power usage during non-production hours.
- Set shutdown protocols for machines, lights, and pumps during shift changes and weekends.
- Check compressed air lines for leaks regularly.
6. Track performance in real time
Paper logs and spreadsheets mean managers only find out about problems after they’ve happened. Real-time visibility into machine performance and downtime reasons across every line helps you catch issues when they happen.
Production monitoring software that pulls machine signals from sensors and IIoT devices gives you that visibility. With it, managers can spot bottlenecks, compare performance across lines, and make decisions based on current data.
Tools and Software to Support Efficiency
Manual tracking is slow to catch problems and often error-prone. Real-time production efficiency software removes the inaccuracies. Here is a quick snapshot of why you should switch to real-time tracking.
| Manual / Spreadsheet | Real-time software | |
| Data accuracy | Prone to human error | Captured automatically |
| Speed | Delayed, often end of shift or next day | Immediate |
| Multi-line view | Scattered across files | One dashboard |
With Evocon, there are different features that help monitor and improve manufacturing efficiency across the whole plant.
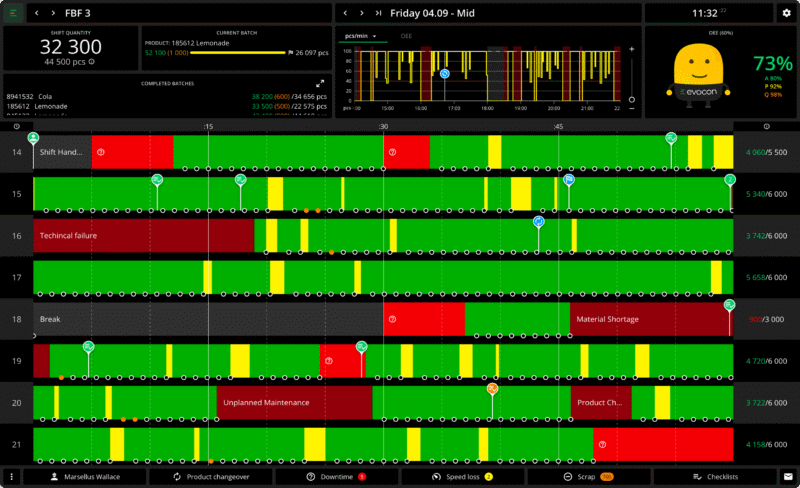
Shift View
Evocon’s Shift View helps you track and analyze the performance of all your production shifts in real time across different stations, factories, and countries.
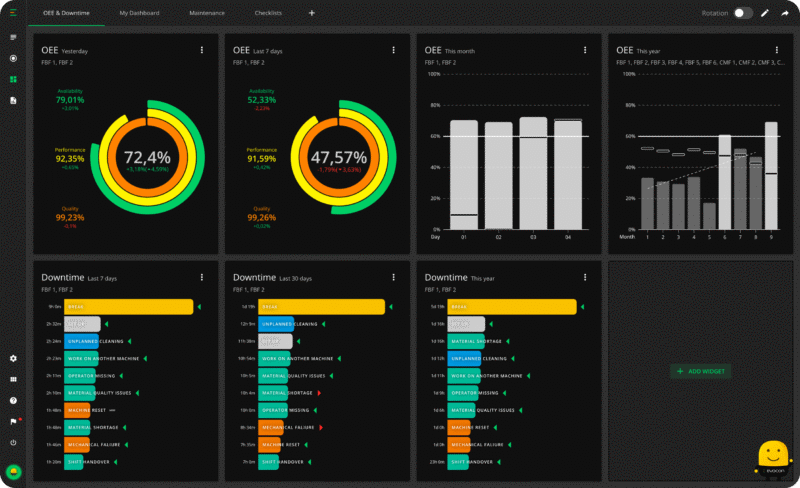
Dashboard
Evocon’s OEE dashboard transforms complex data into clear, actionable insights, letting you track OEE and production performance in real-time. Customizable with a wide range of widgets, this is useful for production, maintenance, and quality departments.
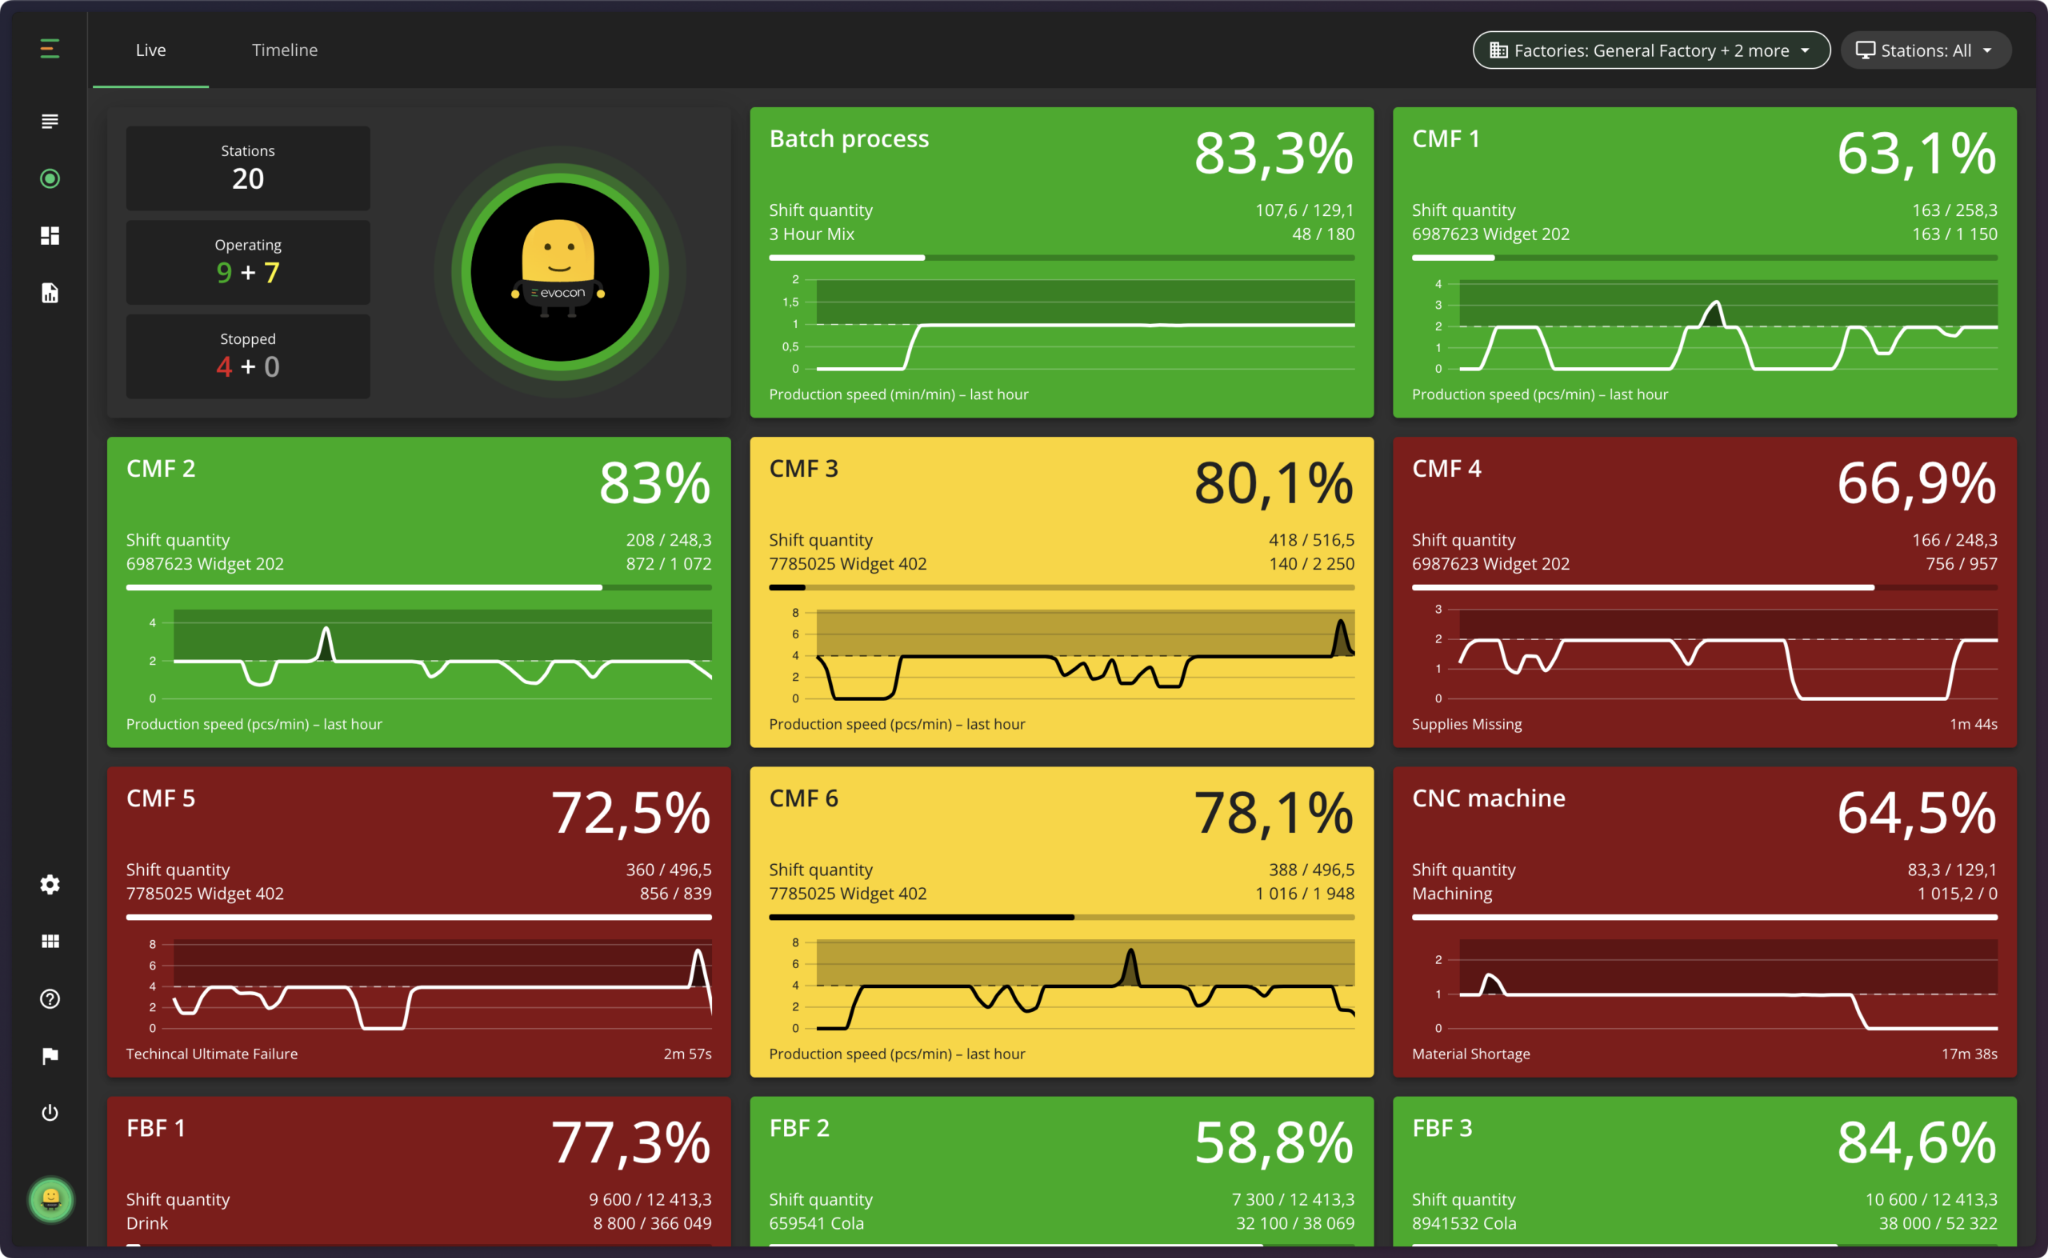
Factory Overview
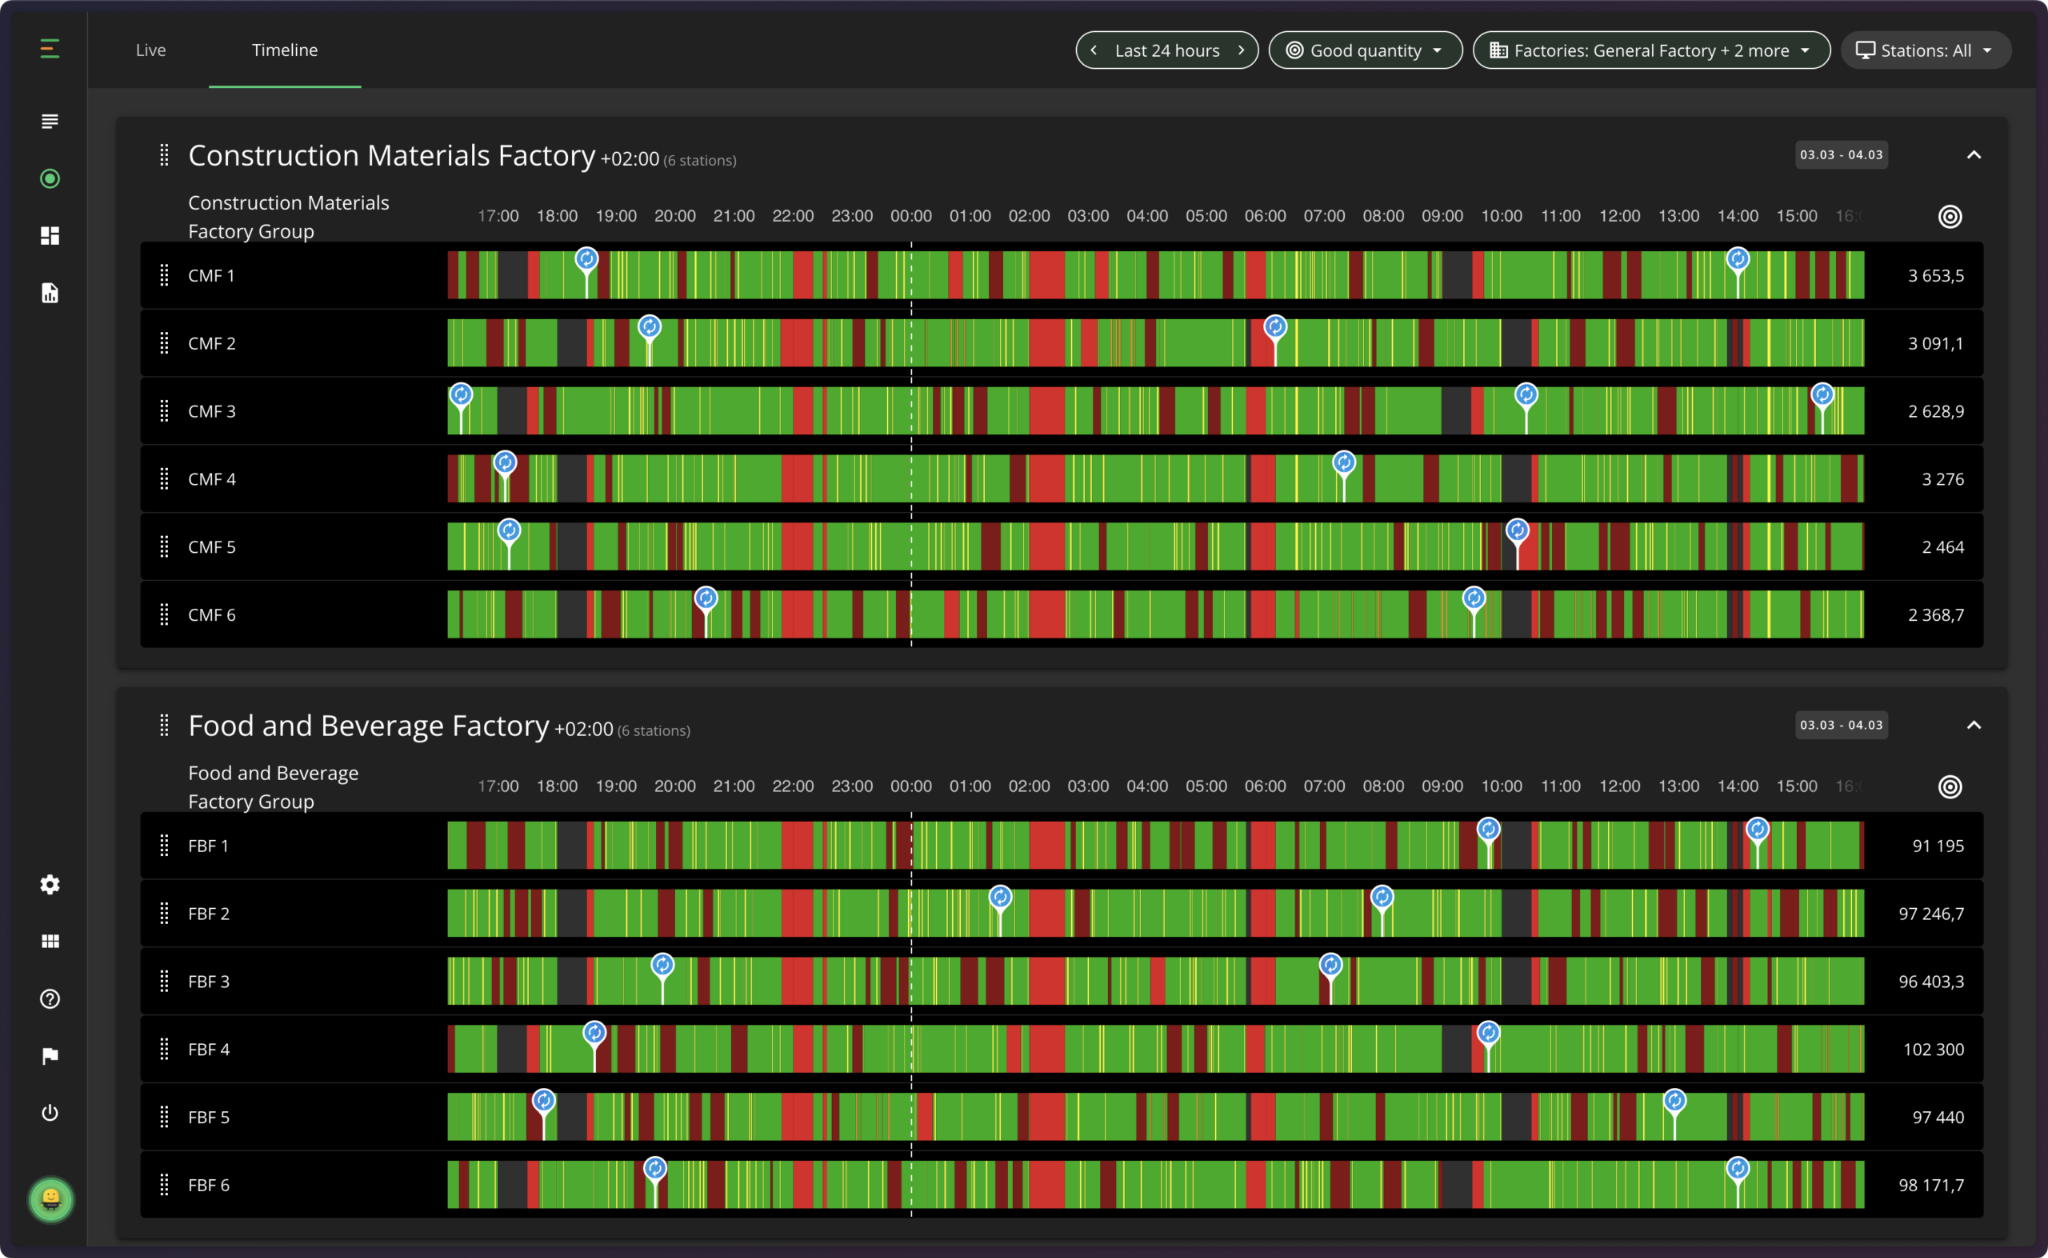
Getting a quick snapshot of what’s happening across the plant is the easiest way to know which machines are performing well and which need attention. Evocon’s Factory overview transforms every machine into a color-coded card, offering an instant view of your factory’s health across all connected locations. This means you can spot issues at a glance and keep everything running smoothly. There are two views: Live View and Timeline, which give managers the information they need.
Operator input tools
Along with software, it’s essential to have intuitive hardware for your operators. For example, tablets let operators log downtime reasons quickly and add context that machine data alone can’t capture.
Frequently Asked Questions
- What is a good manufacturing efficiency percentage?
Since manufacturing efficiency and OEE can land on the same number, the usual OEE benchmarks apply here too: 85% for world-class performance, while many plants run closer to 55-60%. The specific number matters less than the trend; continuous improvement is what counts. - How is manufacturing efficiency calculated?
Divide actual good output by maximum possible output over a given period, then multiply by 100: Efficiency (%) = (Actual Output / Maximum Possible Output) × 100 - What’s the difference between efficiency and productivity?
They get used interchangeably, but they measure different things. Productivity is raw output relative to input, like units produced per labor hour. Efficiency is how well you use resources to get that output while minimizing waste. A plant can be highly productive, turning out large volumes, while still being inefficient if it takes high scrap rates or excess energy use to get there.
Key Takeaways
Manufacturing efficiency isn’t a different metric from production line efficiency; it’s the same calculation, but it captures how resources and processes work together across the wider operation instead of just one line.
Start with an accurate baseline. Know your actual output against your maximum possible output, and track OEE, throughput, cycle time, downtime, and first-pass yield alongside it to see what’s driving that number. From there, fixing layout and workflow will improve your overall operations, as will applying targeted automation, standardizing quality checks, training operators, reducing energy waste, and replacing spreadsheets with real-time monitoring.
With the right data in place, it becomes a lot easier to see exactly where your plant’s capacity is going, and how much of it you can get back.


