 Enterprise Package
  Integrations
  Security
  Hardware
 How Evocon Works
  OEE Monitoring
  Increasing Productivity
 OEE Calculator
  Evocon
  Join us
 Many manufacturers have a hidden blind spot in their system: an inaccurate production speed target. Whether it originated from a machine spec sheet or an initial setup estimate, an outdated target distorts your OEE scores, capacity plans, costing, and scheduling.
If a target is too high, it makes a well-running line look like it’s underperforming, while a target that’s too low hides capacity you could be using. Evocon’s Production Speed Report was created to tackle this problem, giving manufacturers full visibility into their production speed, and the ability to set targets that reflect reality.
What is Production Speed?
Depending on your industry, you probably talk about performance in one of two ways: production speed/rate (how many units you make per hour) or cycle time (how long it takes to complete one unit). These are simply two sides of the same coin.
What many factories miss is that neither number is static. Your real production speed shifts with the age of your equipment, the quality of your raw materials, operator skill, and dozens of other variables. A target set five years ago may bear little resemblance to what your machines are actually capable of today.
Why Speed Targets Are Often Wrong
From our experience working with manufacturers, we see three common reasons why targets drift away from reality:
- One size fits all
A single speed is applied across an entire product group, even though different products behave differently on the same line. Differences in speed also arise from varying conditions and different raw materials. - “Set and forget”
Clients set speed targets once and then leave them at that. However, tooling changes, practices improve, and the speed improves as well. And sometimes targets are left at the initial estimate due to the fear of conflict – unwillingness to push the people. In both cases, the target stays the same, resulting in unrealized potential. - Relying on the spec sheet
Basing targets on a machine’s theoretical ideal cycle time (or nameplate speed) ignores your real-world shop floor situation, like operator skill, material quality, or equipment condition.
Why is Production Speed Important?
Here are some of the ways production speed impacts your operations:
- Setting expectations
Your production speed defines what “normal” looks like for a product on a line. Without it, you can’t distinguish good production runs from bad ones.
- Calculating OEE accurately
Production speed is one of the three OEE components: the “Performance” component. We often see inaccurate speed targets (especially with new clients); this leads to inaccurate performance calculations, which then results in inaccurate OEE.
- Capacity planning
Inaccurate speed targets directly influence planning: “How much can we produce this week, month, or quarter, given our speed?” Every promise to customers starts with speed targets.
- Costing and pricing
Your cost-per-unit depends on how many units you make per hour, which again is derived from your production speed.
For example:
Your line costs €500/hour to run (labor, fixed costs, depreciation).
If your target stays at 1,000 units/hour: Cost per unit = €500 ÷ 1,000 = €0.50
If actual capability is 15% higher (1,150 units/hour), then the real cost per unit = €500 ÷ 1,150 = €0.43
- Scheduling and changeovers
With accurate speed targets, you know how long each product takes, and you can plan shifts and delivery commitments.
- Identifying losses
Speed deviations reveal problems. If the production speed report shows slower speed on any particular machine, shift, or product, it reveals worn equipment, subpar materials, incorrect settings, or operator training issues.
- Benchmarking
Comparing lines, shifts, plants, or time periods is only meaningful if the target speed is set accurately for all of them.
- Investment decisions
Finally, do you need more capacity or are you underutilizing what you have? Correct speed targets are a necessary component to find the answer.
The Cost of “Phantom Efficiency”
Imagine a production line where the target is 500 units/minute, but the actual capability is 575 (15% faster). This gap creates “Phantom Efficiency”.
You might see a “world-class” 92% OEE score, but that isn’t a true picture of your production. You could end up underpricing contracts because your “cost per unit” is based on the slower speed, or worse, you invest in a new production line when your current one has 20% unused capacity.
How Production Speed Impacts OEE
If OEE (Overall Equipment Effectiveness) is the heartbeat of your factory, then your speed targets are key to measure it accurately. Speed targets determine the Performance pillar of OEE.
Performance = (Actual Speed / Target Speed)
If your speed target is inaccurate, so is your OEE score. This leads to two common scenarios that can frustrate management:
- The “False High”: Your team keeps running at 110% performance. It looks great, but since it’s mathematically impossible to do more than 100% of a machine’s true capability, it actually means your targets are too low. Your OEE is inflated, and you’re overstating your efficiency.
- The “Unearned Low”: Your team is working hard, but the Dashboard shows 65% performance because the target was set to a “theoretical maximum” that the machine hasn’t hit in years. This can lead to fatigue on the shop floor, where operators stop trusting the data because it doesn’t reflect their hard work.
Identifying your sustainable speed has always been a challenge — most teams simply don’t have time to dig that deep into their data. That’s exactly the problem the Production Speed Report was built to solve.
Introducing the Production Speed Report
To give manufacturers an accurate understanding of the production speed for each product specifically, Evocon created the Production Speed Report. Here are a few examples of how it looks.
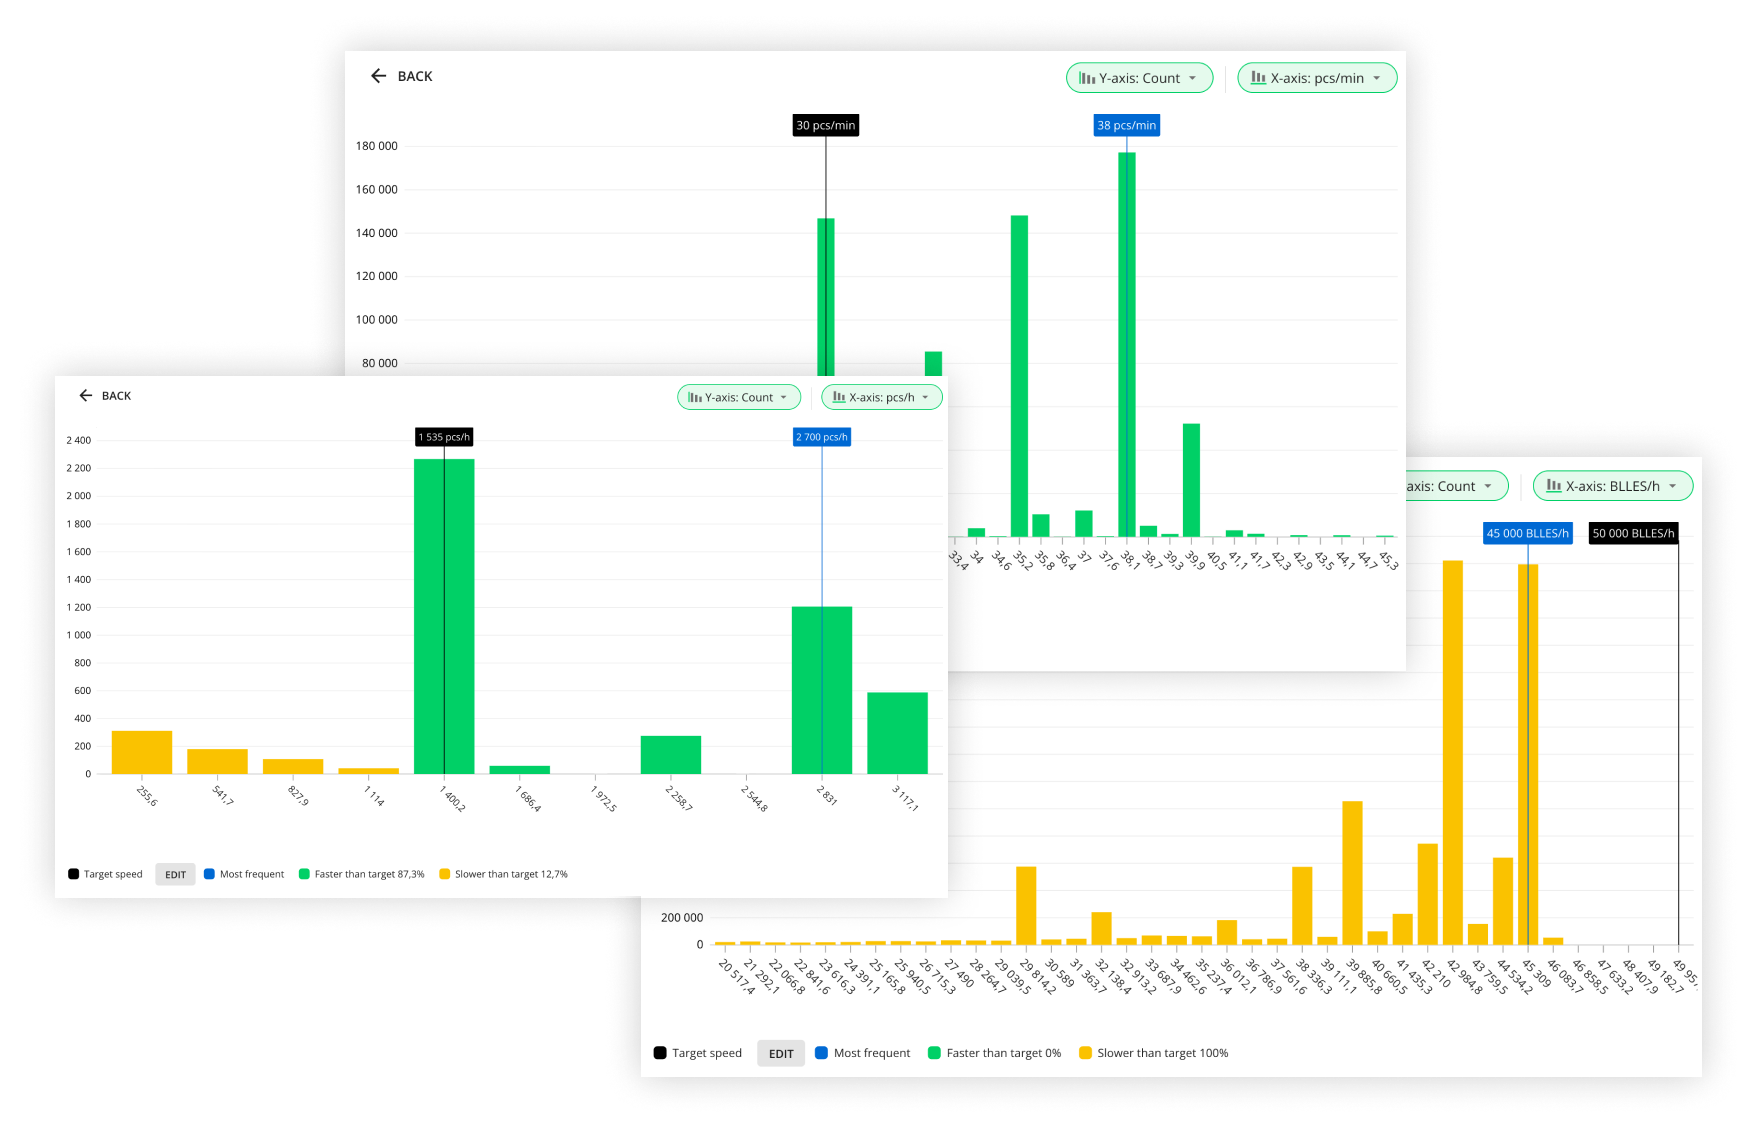
How to Read the Speed Report
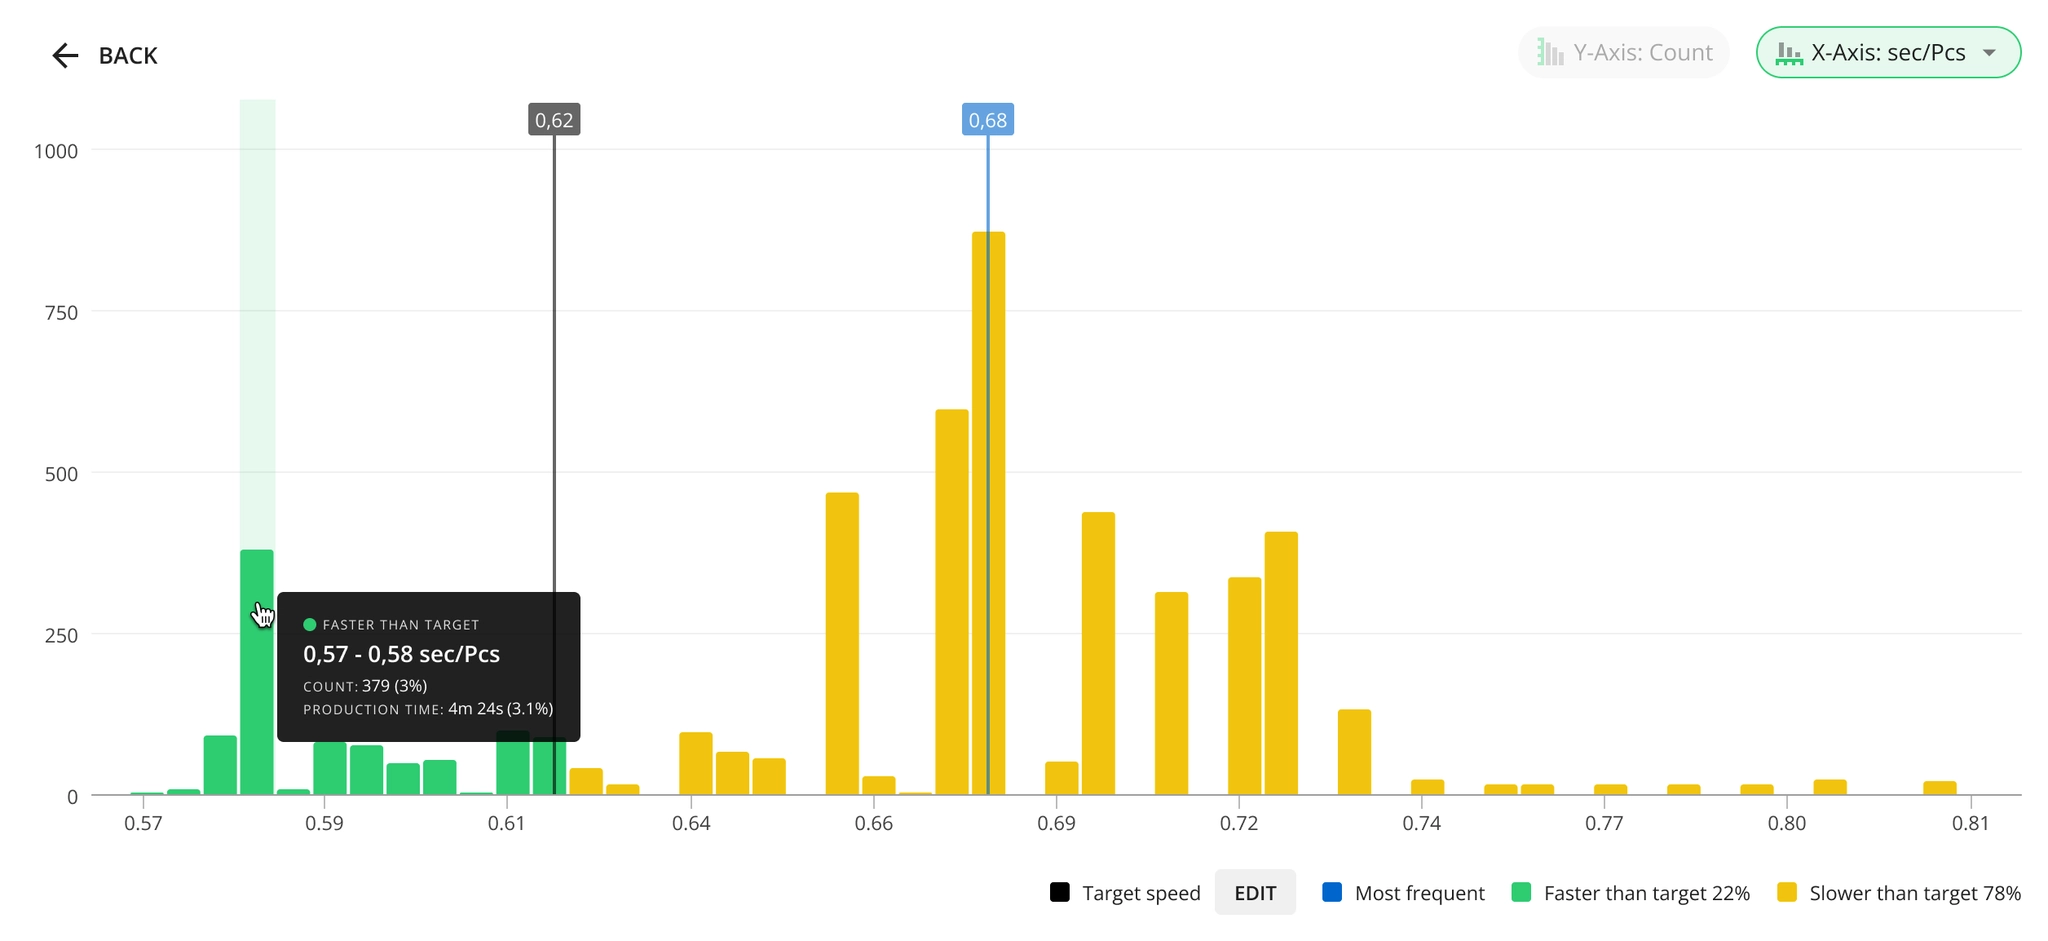
This chart is a histogram, where the X-axis represents your production speed, and the Y-axis represents the count of cycles at that speed, so that higher bars show which speed happens more frequently.
Whether you choose to display your speed in terms of pieces produced per time unit, or in seconds to produce one unit, slower cycles are on the left, and faster ones – on the right. Your current target is marked using the black line, so that the speed below the target appears in yellow, and faster speed – in green color.
The blue marker shows your most frequently occurring speed – known to our more technical audience as the “Mode”. It’s worth mentioning that this isn’t the same as your Maximum Demonstrated Rate (MDR), which is also used by some of our clients, however, the Mode is a more practical way to find your speed at which you are able to run consistently, as opposed to the MDR which is only achievable under perfect conditions. Think about it like your commute to work. If you made it to the office in 25 minutes once during a holiday with no traffic, you still won’t set your alarm based on that time. You set it for the 40 minutes it usually takes. That frequency is the Mode. It’s the most honest, proven foundation for a target.
☝ Note that the Mode is only a recommendation – you can set your actual target speed anywhere else you see suitable.
Important details
There are a few nuances in how Evocon handles production speed data to make your analysis easier.
- Evocon automatically filters out noise caused by outliers, and removes data points immediately following a stop. You only see clean production data.
- Bars (both yellow and green) are not single values – they are “buckets”, or ranges of speed. Buckets can be smaller or bigger, and that can change significantly, how your histogram looks.
Reading the Data Table
Below the histogram, there is a table that provides an overview of production speed ranges during the selected time period, including details about location, product groups, product codes, shifts, and operators.
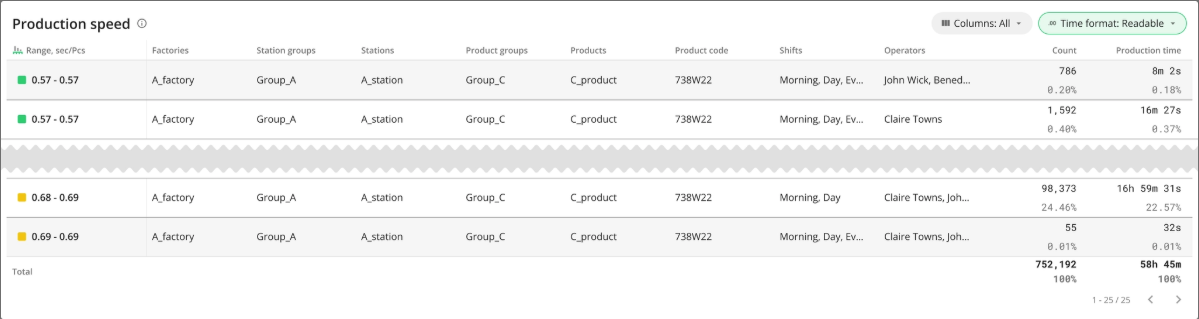
Here is a quick explanation of some of the data available in the example above:
- Range: Interval between the first and last values of the production speed inside one “bucket” on the histogram.
- Count: The number of occurrences of production speeds falling within that range (inside the “bucket”).
- Production time: The sum of all time at which the speed fell within that range.
How can the Speed Report be used in production?
Here is a simple scenario, where the Speed Report can be used to update your speed targets, giving you more accurate data.
Consider a situation where an operator claims a specific product can run 15% faster than the official target. Without data, this is just an opinion.
By using the Production Speed Report, a manager can filter the data for specific shifts or operators. If the histogram shows a clear peak (Mode) at the higher speed during that operator’s shifts, the manager now has the evidence needed to update the target in the system settings. This validates floor feedback and instantly captures the hidden capacity that was previously invisible.
How to Get Started
You don’t need to overhaul your entire factory at once.
- Pick one product that consistently shows performance over 100% – this is one easy way to identify a speed target that is off.
- Run the Speed Report for the last 90 days.
- Find the Mode. Check at which speed your machine runs most frequently.
- Update the target. Adjust your settings in Evocon to match reality.
By aligning your targets with demonstrated reality, you turn OEE from a metric you track into a tool for growth.
Key Takeaways
It’s easy to look at a strong OEE score and think everything is fine. But if those high scores are coming from an outdated target, you’re not seeing your true production reality.
- Trust your data: ensure your OEE reflects actual capability, not old specs.
- Protect your margins: price and cost based on what your machines actually do.
- Optimize Capex: avoid buying new equipment when you still have hidden capacity.
Accurate speed targets don’t just change your reports—they clarify your entire business strategy.