We often hear about “world-class OEE” and how it’s something that every manufacturing organization should aim for. But the reality is that many companies would be better off focusing on improving their existing OEE score, rather than exclusively striving for that lofty world-class OEE that many dream of.
With the aid of real-world industry data from more than 50 countries, we are here to explain how your manufacturing operation can take the first steps towards definitive OEE improvement.

What Is a ‘World-Class OEE Score’?
By definition, a world-class OEE score is the target suggested by Seiichi Nakajima in his 1984 book, Introduction to TPM. Seiichi Nakajima defined a world-class OEE as a score over 85.
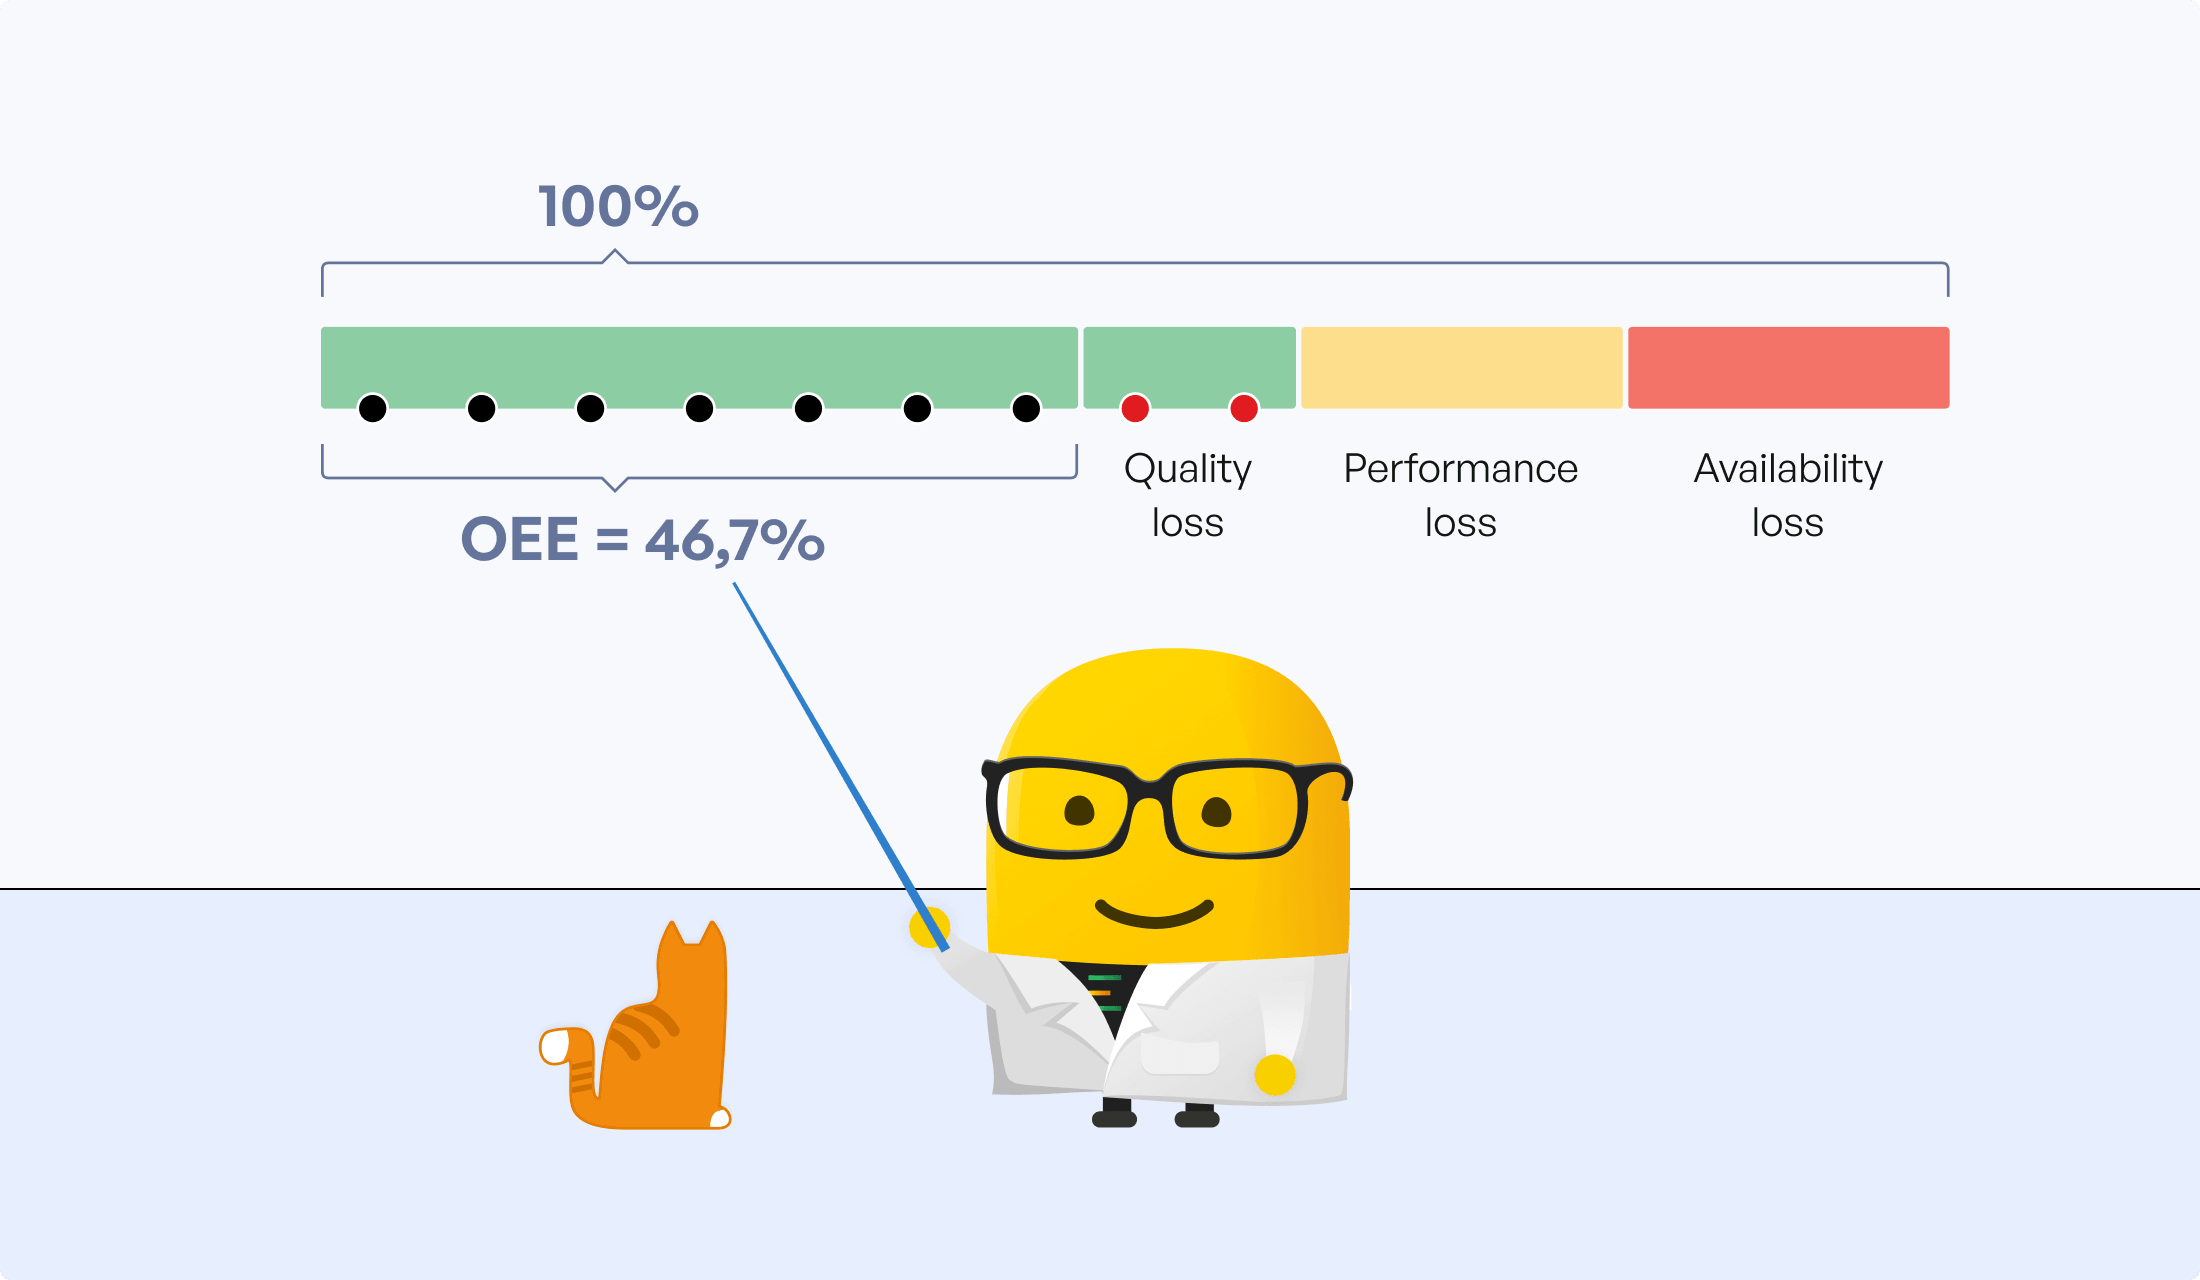
Considering that OEE comprises three values – availability, performance, and quality – achieving an overall OEE score of 85% plus is significantly challenging.
For example, if a factory achieved 90% for availability, 90% for performance, and 90% for quality, the resulting OEE would only be 73%. In other words, 27% of your production process is not as productive as it could be.
To better understand the dynamic between the components, use the interactive OEE tool below.
 This graph is interactive! (drag the dashed --- lines)
Few manufacturers actually achieve a world-class OEE score
Based on our extensive work with customers and the data from our OEE monitoring software, the reality is that most manufacturing organizations’ OEE scores are closer to 60-65%, and this is dependent on how long they have been tracking OEE. More on that below.
So while a world-class OEE score of 85% and above is extremely desirable, most manufacturers are unlikely to achieve such results in reality. That’s why companies should not focus on striving for 85% as a minimum but rather set their sights on raising their OEE through specific improvements.
Average OEE Scores In Manufacturing Based on Actual Data
Don’t feel disheartened or daunted by the fact that a ‘world-class OEE score’ is 85% and above. The reality is that most manufacturers do not come close to achieving this. How do we know? Because we have customers in more than 50 countries, which provides us with genuine, in-depth insights into manufacturing operations globally.
What OEE targets do manufacturers set for themselves?
Before we look at the actual OEE scores that manufacturers achieve, let’s consider what targets we see manufacturers setting for themselves.
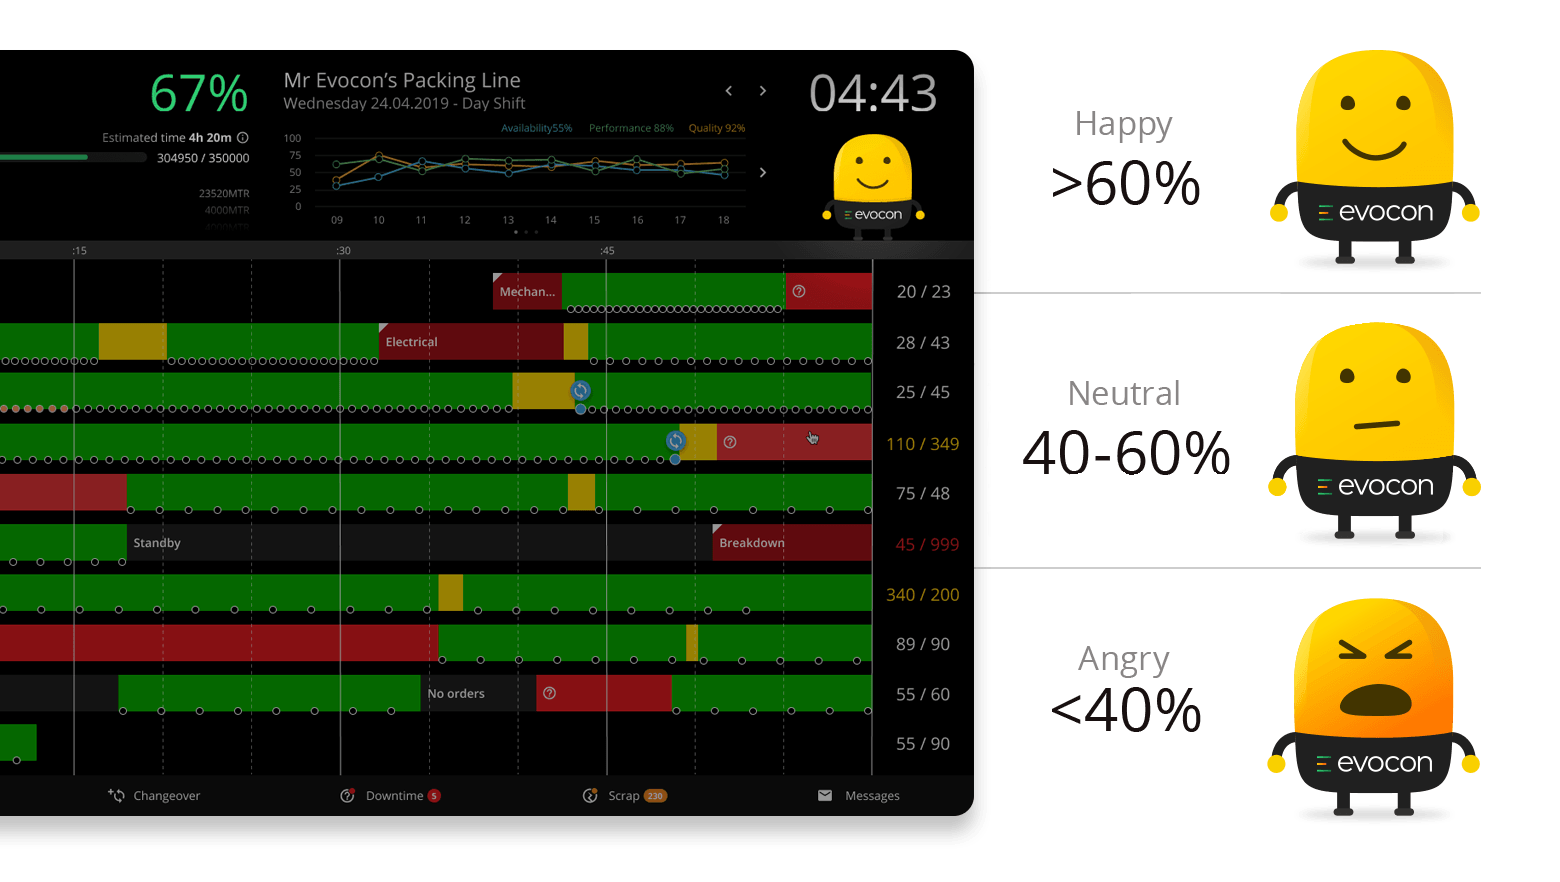
In Evocon, manufacturers can set a low OEE target and a high OEE target for each production machine, giving them ranges to achieve instead of one single score. Progress towards these targets is visualized in a humane way to increase operator engagement.
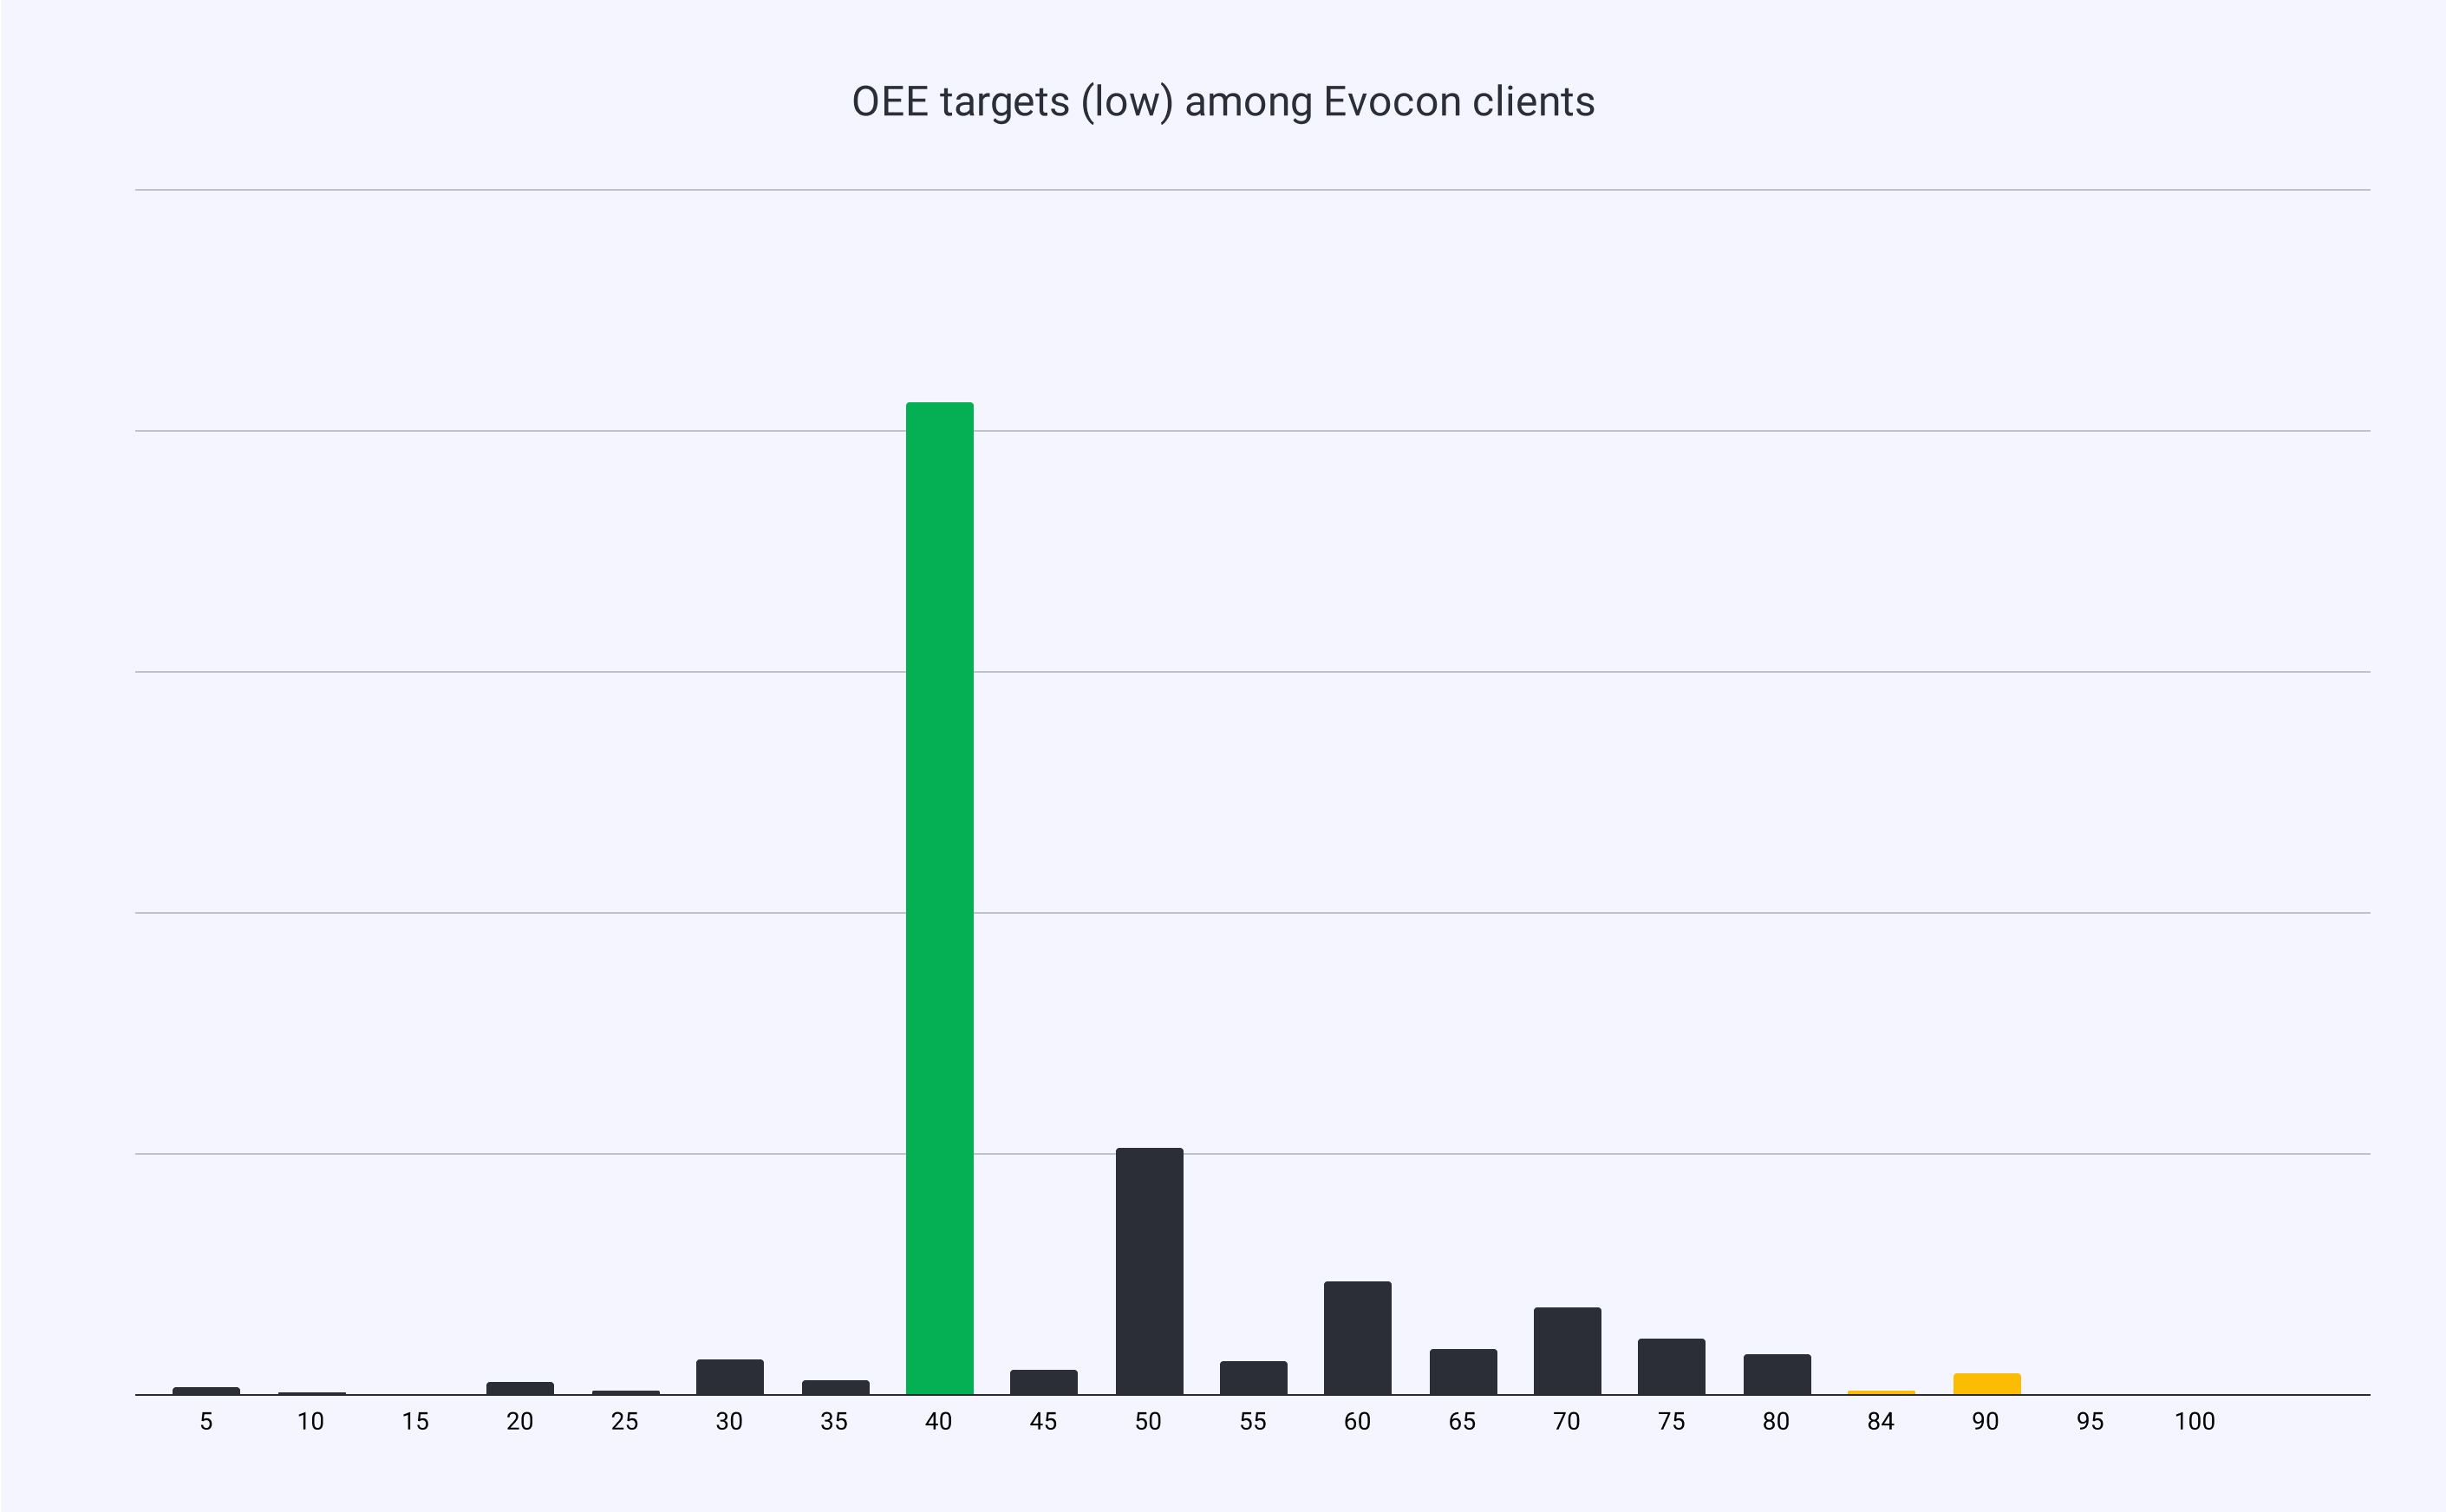
The low and high targets for OEE
Below are two graphs – the low OEE targets and high OEE targets. What we can see from the first graph is that the majority have their low OEE target set between 36-40%. These levels indicate the minimum they expect to get from their machines. Anything below would be considered upsetting (angry).
The graph on high OEE targets tells us that majority have their sights set on reaching 56-60% – a reading equal to or above these levels makes them happy. Moreover, only a fraction (orange) has the world-class OEE as their target.
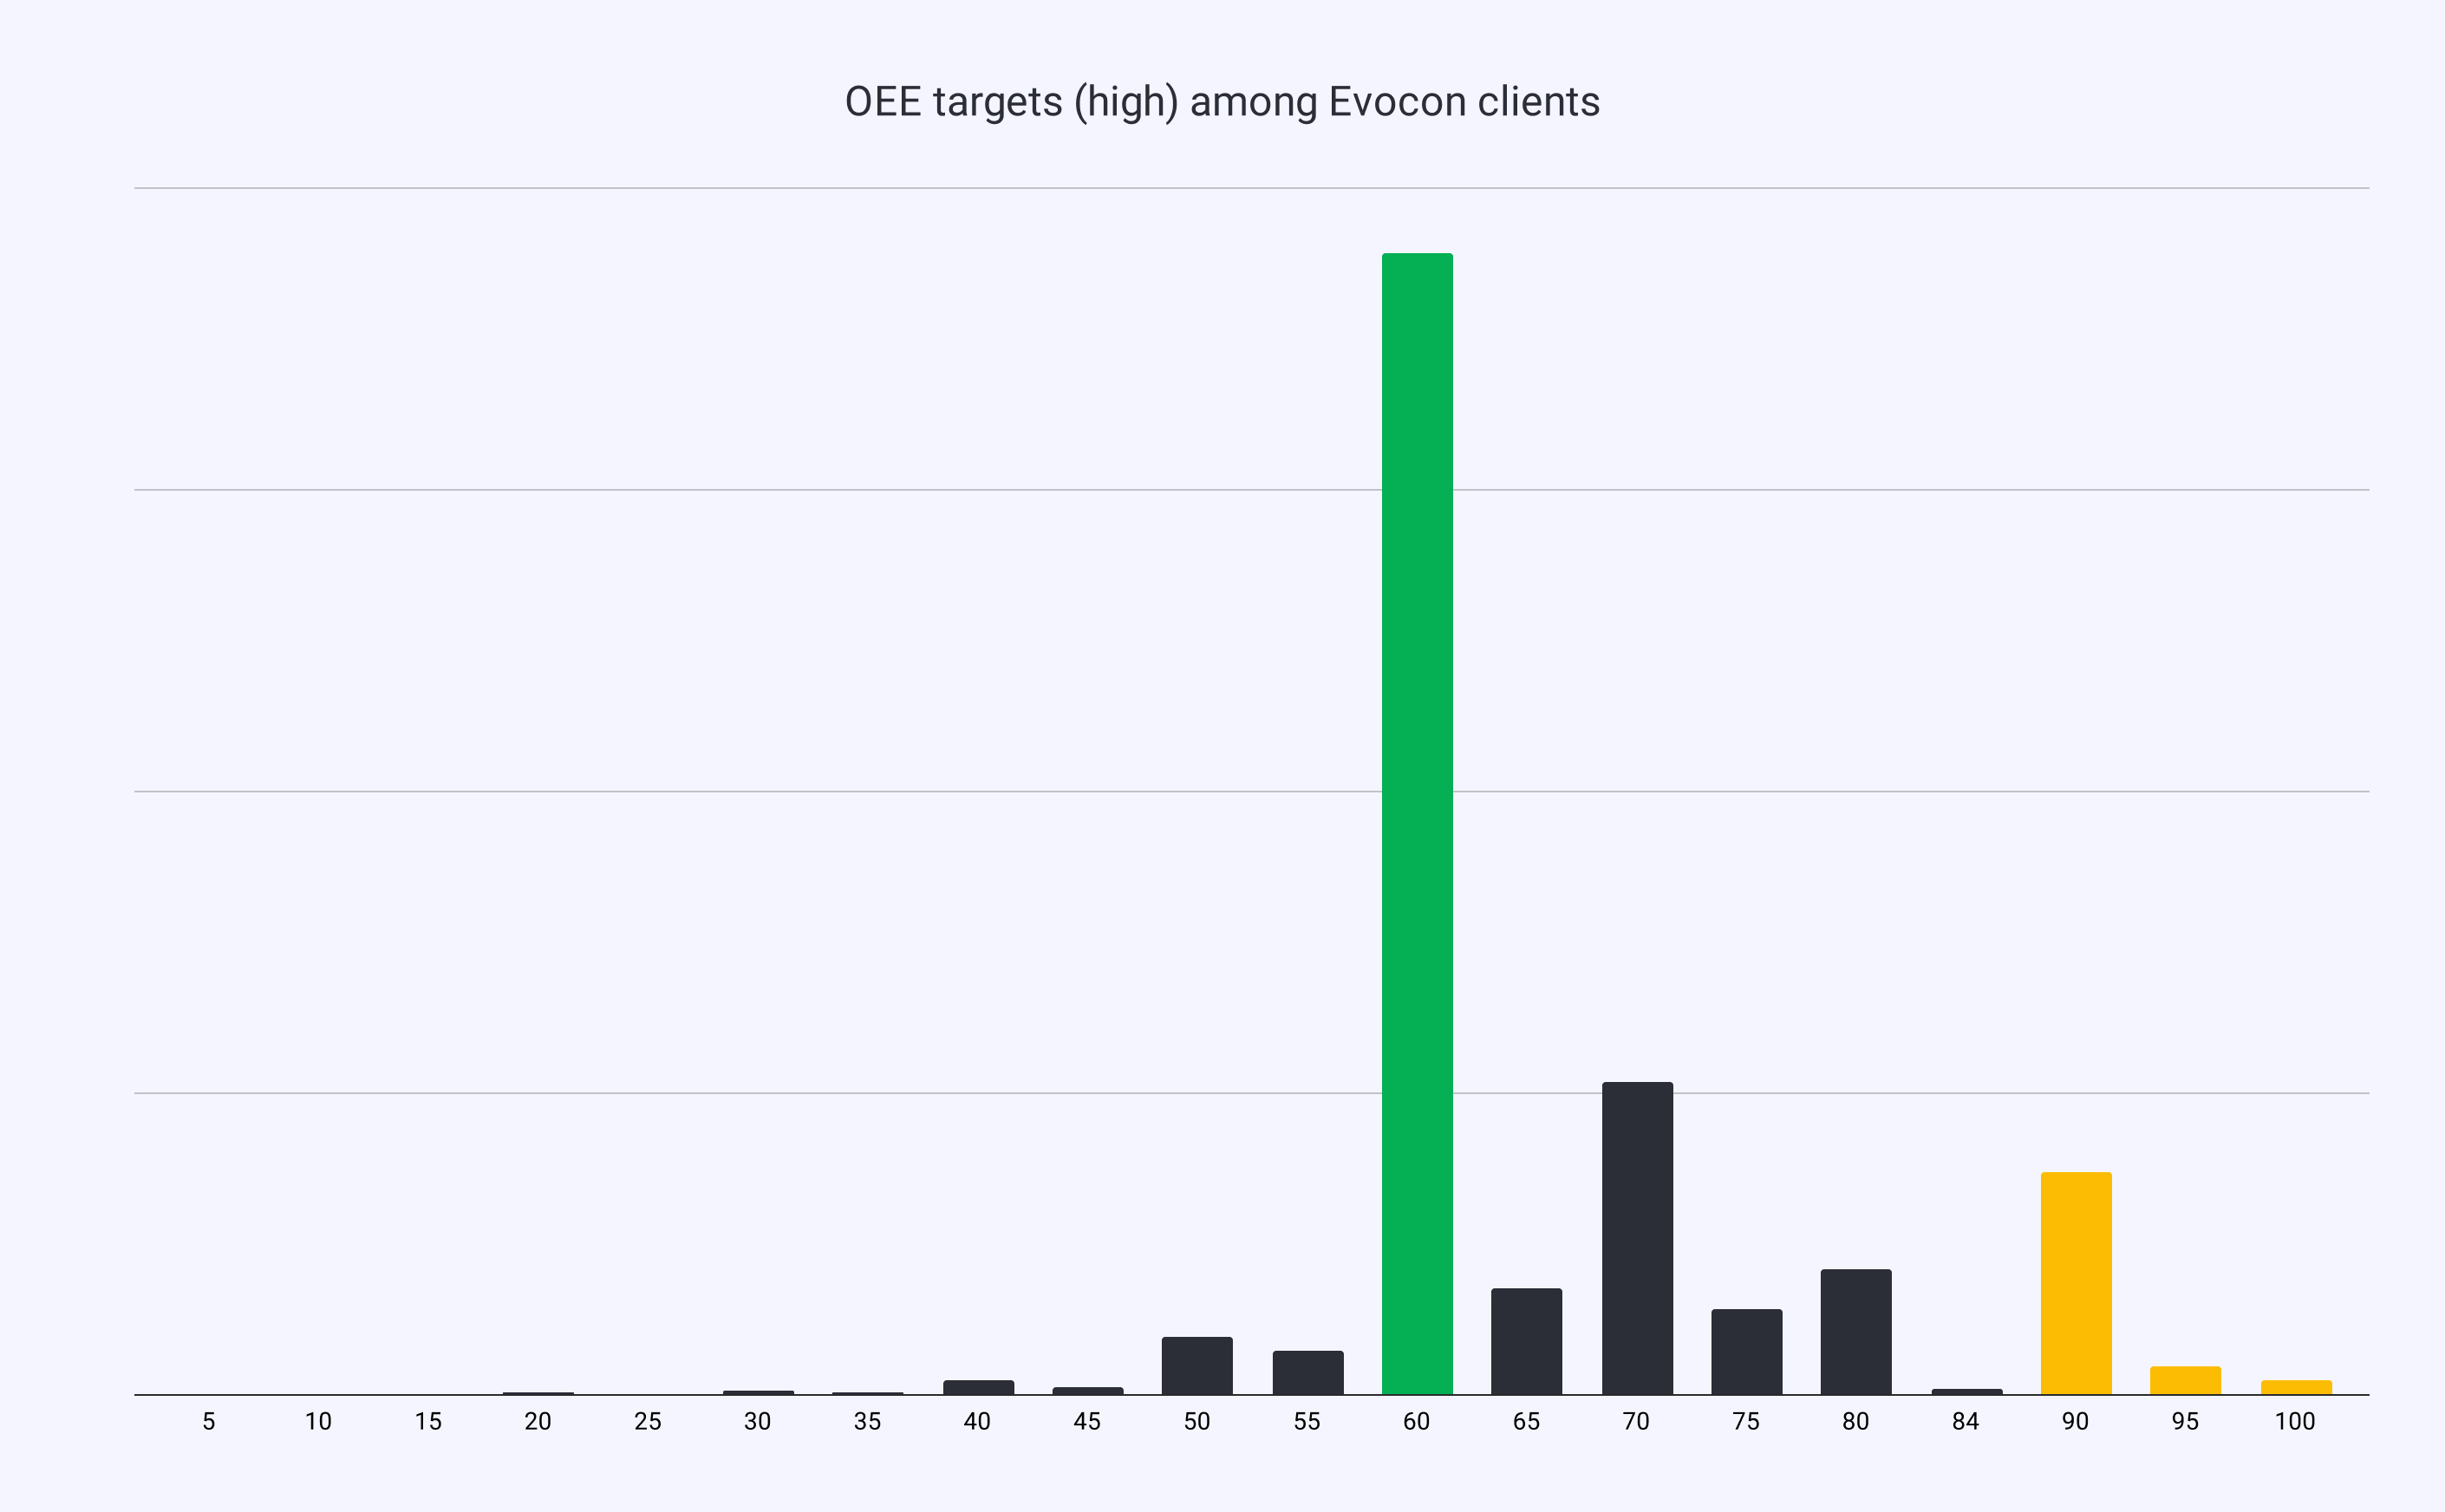
A simple conclusion to draw from the target data is that the Goldilocks zone for most manufacturers is 36-60%.
Now that we know manufacturers’ expectations, we can look at their actual OEE averages.
What are the actual OEE averages for manufacturers?
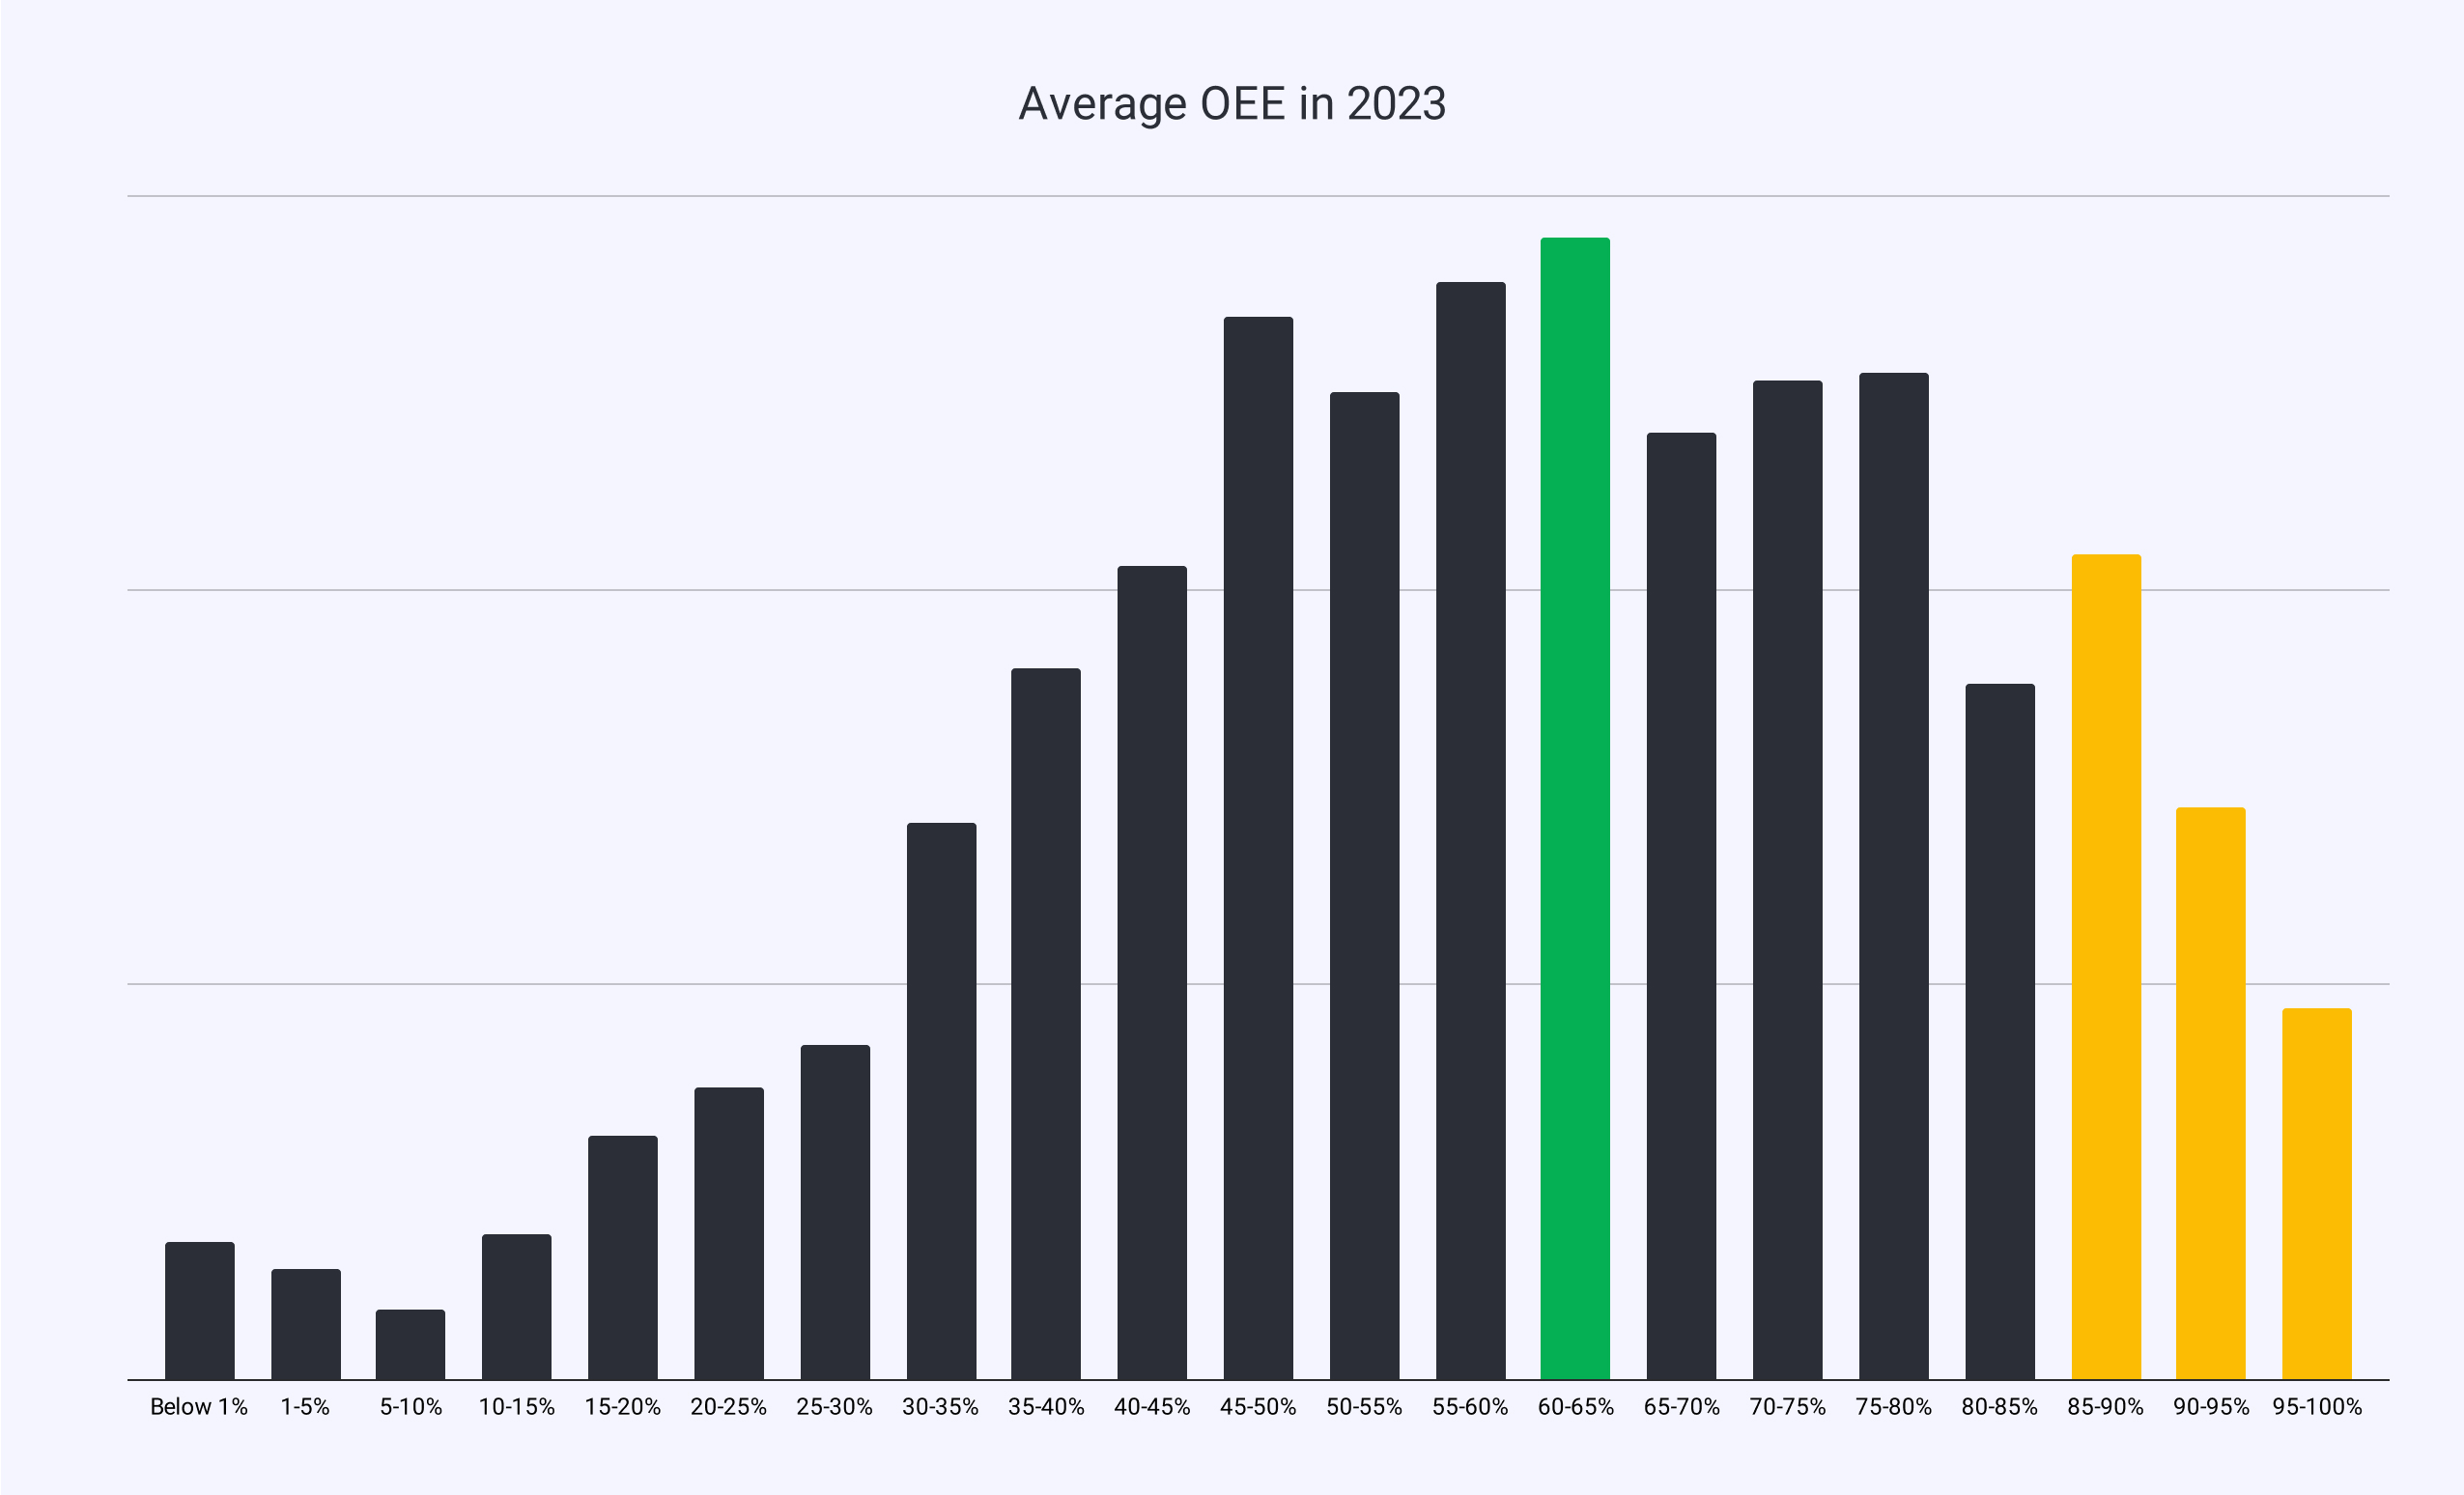
The graph below, which is based on our own data, shows the average OEE (over the last 12 months) for all machines connected to Evocon.
The chart shows the frequency of actual OEE achieved, grouped in 5% increments. Furthermore, the OEE scores have been rounded to single digits to make interpretation easier. Also, all scores above 100% are omitted from data because those are signals of incorrect calculations.
So what does the data tell us?
- We first see that all OEE scores, when averaged, tend to follow a standard distribution with a high between 60-65%. This level is a good target to have as an organization.
- Secondly, it’s also clear that the manufacturers who have a daily habit of tracking their OEE do reach significantly good levels.
- Finally, the reality that becomes apparent is that based on yearly averages, roughly 10% of manufacturing organizations have an OEE score of 85% or above, i.e., a world-class OEE. However, while this insight is an eye-opener, it likely is even lower.
Why the % of actual world-class machines is lower?
When working with manufacturers, we often find that many tend to understate ideal cycle times. This can lead to a performance score of over 100%, which serves to skew the overall OEE score and make it higher. But performance is not the only pitfall we see, and we’ll cover the other problem areas later in the article.
Factoring in the different blindspots of OEE calculation, we can be sure that the actual number of manufacturers with a world-class OEE is twice as few.
Knowing what we know from working with so many manufacturers across the globe, we can safely say the real percentage of manufacturers who achieve world-class OEE is around 5%.
This is why we mentioned earlier about not getting fixated on the “world-class OEE scores” we often hear about and instead focus on tangibly improving your own situation first and foremost.
The Importance Of Improving Your OEE – Two Case Studies
First and foremost, it is important to improve your OEE because doing so inevitably leads to a more efficient and productive manufacturing operation – which directly impacts your company’s bottom line.
Having helped customers in more than 50 countries implement our OEE software, we are in a fortunate position when it comes to seeing the benefits associated with improving OEE. Below we’ve outlined two case studies to illustrate what the process of starting to measure your OEE and then improving on the results looks like.
Case study #1: How HKScan Uses Evocon to Maximize Machine Utilization
In 2017, we started working with HKScan, one of the biggest meat and food product manufacturers in Scandinavia, to help it maximize machine utilization.
Like many manufacturers, HKScan’s desire to start monitoring its production equipment was driven by a need to better understand and visualize the current state of production, identify reasons for waste, and find ways to improve its processes.
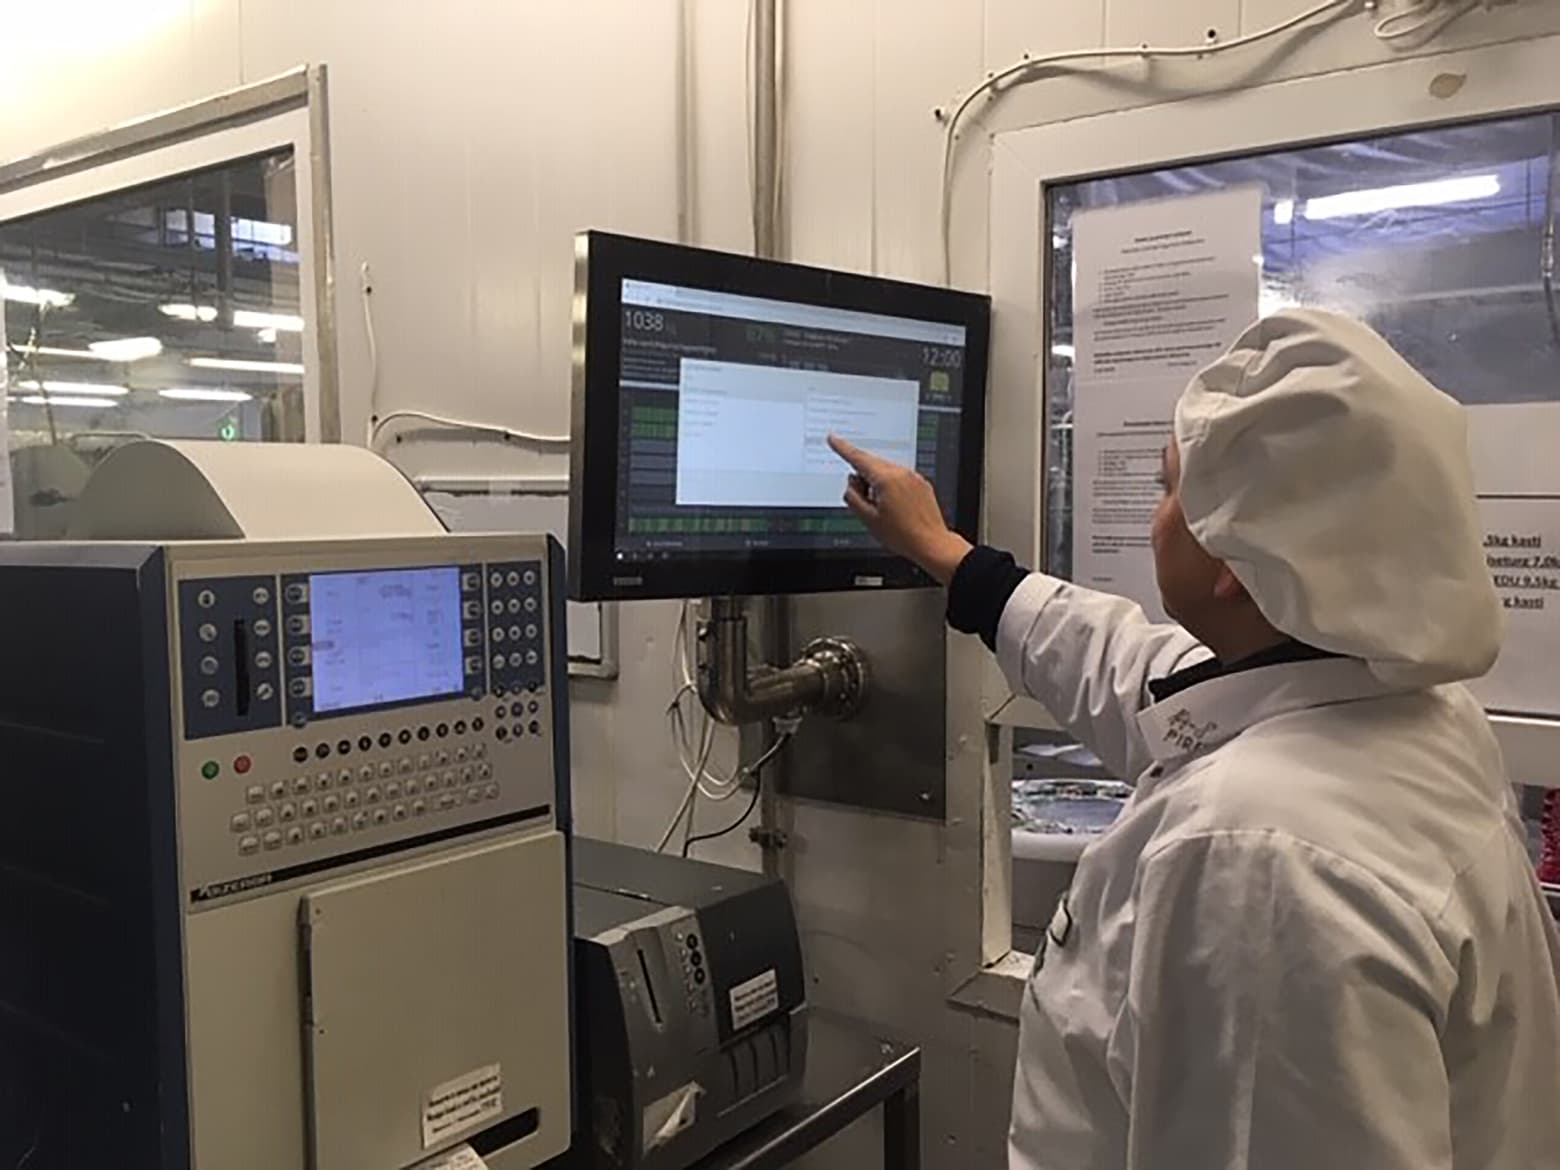
By switching from paper-based production monitoring and OEE calculation to Evocon, HKScan’s packaging lines improved their OEE scores by, on average, 20% in six months. Furthermore, the team can now quickly analyze performance by machine, crew, shift, or product. And based on the analysis, determine when and where performance issues are occurring.
Read the full HKScan case study
Case study #2: Toftan Creates a Bonus System Around OEE
Toftan AS, the second biggest wood processing company in Estonia and the third largest in the Baltics, was looking for a metric for success that could be linked to staff bonuses to drive performance. As Peeter Põder, Mill Manager at Toftan 2, said: “We decided to place our bets on OEE.”
To start tracking OEE at the state-of-the-art Toftan 2 facility, the company implemented Evocon. As Peeter points out, “You can only drive change if everyone understands, in a unified way, what is happening in production and what the problems are.”
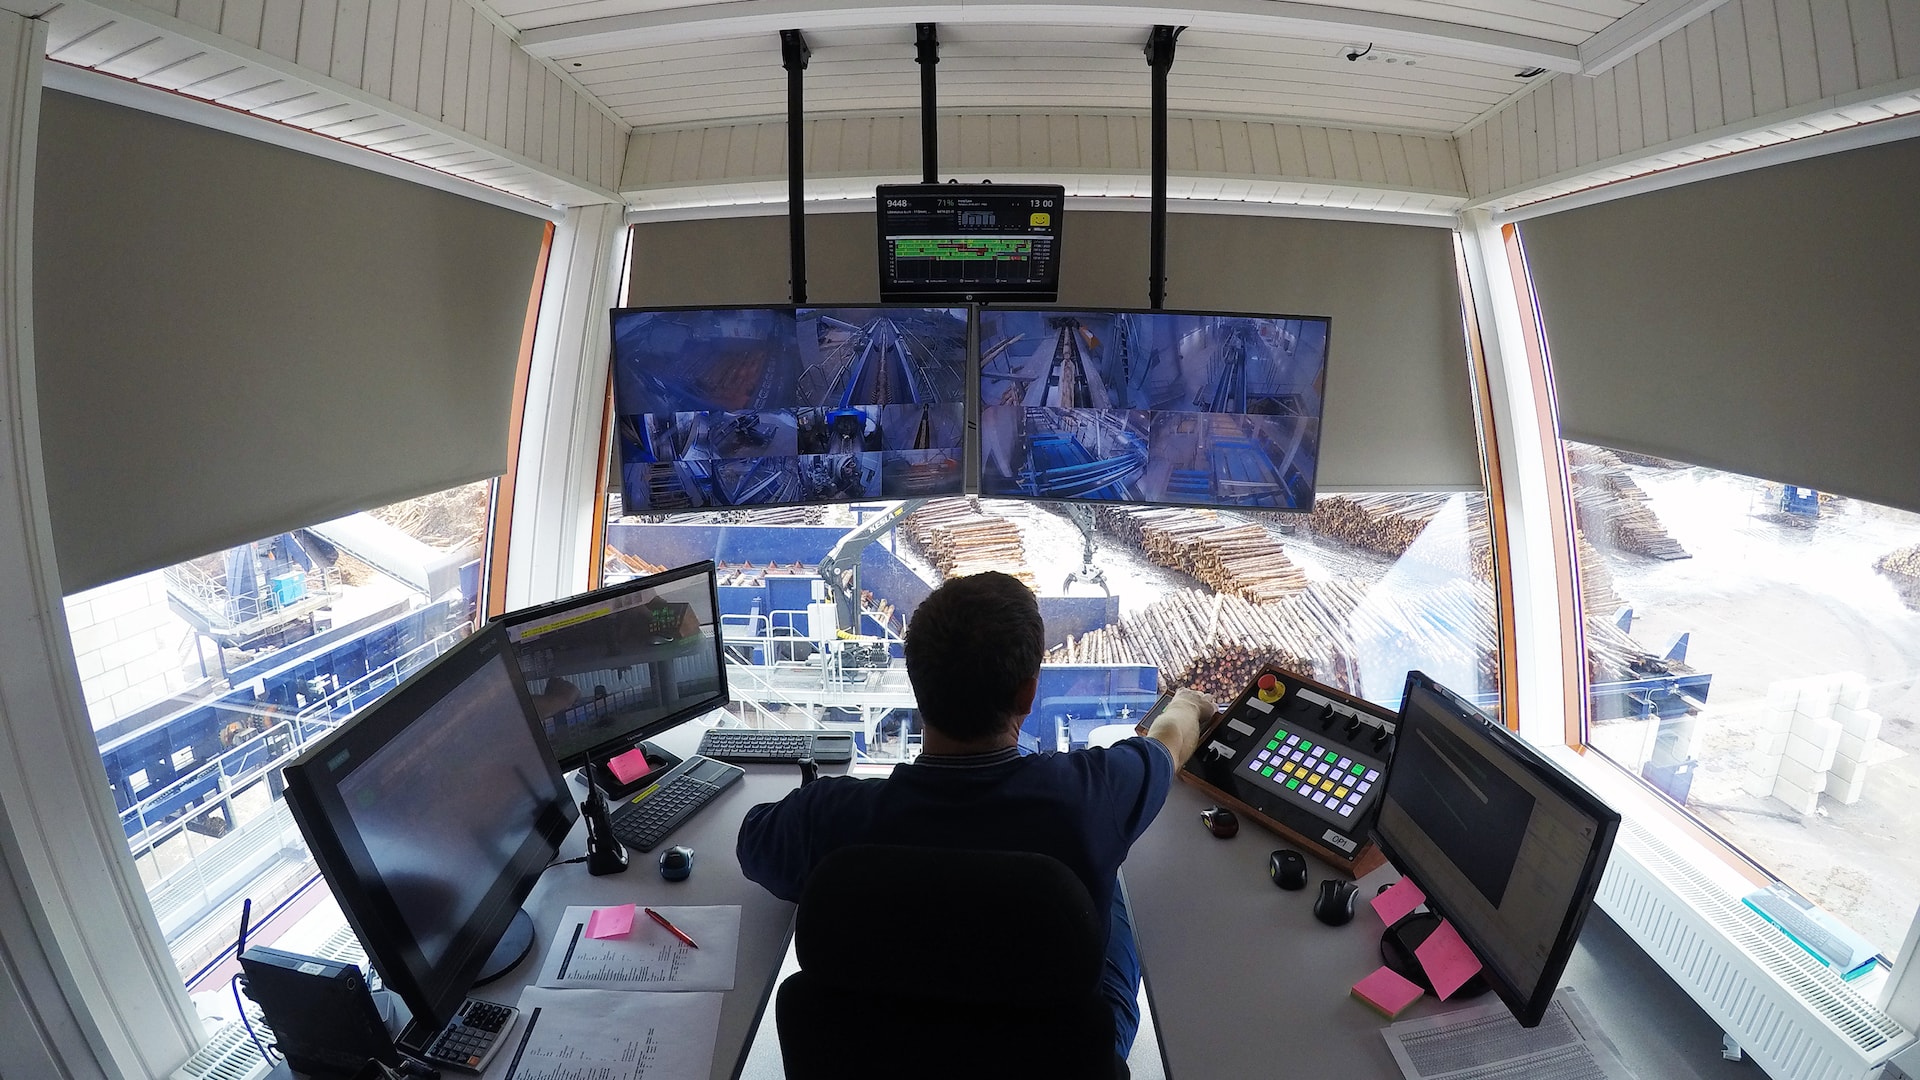
After implementing Evocon, collected data on OEE became easily understandable and was visualized for everyone using an OEE dashboard. With a clear traffic light system in place, each production worker could immediately see if any issues needed investigating.
Toftan then took the step of linking OEE to a bonus system in a bid to incentivize each worker to proactively help improve OEE, and it worked.
Implementing the bonus system improved OEE by 10-15% in a very short time.
Peeter Põder, Mill Manager at Toftan 2
Suddenly pauses that previously went unnoticed in production started to disappear. For example, lunch breaks used to be 2-4 minutes longer. But this soon ceased.
Peeter added: “When we first started with the bonus system, our OEE was at 40%. We then increased it by 10%, then another 10%. Four months later, our OEE was at 60%. A year later, it stood at 75%.”
Read the full Toftan case study
Now that we’ve looked at a few examples of OEE improvement, let’s consider what is important to ensure you have an accurate OEE reading.
Make Sure Your OEE Calculation Is Correct
In the section about average industry OEEs, we mentioned that there are possible pitfalls when measuring OEE. So if you want to benchmark the OEE of your production lines and machines, you must ensure that you get the calculations right.
First things first – OEE calculation is based on machine availability, the speed of the process (performance), and the output quality (yield).
The OEE estimate needs to know:
- Is the machine running? Yes or no, and for how long during any given period?
- Is the process (machine/material/person) operating at the expected rate?
- Is the output of the process acceptable?
So far, so good. But we frequently see instances where manufacturers have OEE blindspots, which skew their overall scores.
Top 3 OEE blindspots we see from working with our customers
- Getting availability right – We often see a tendency to classify too many stops as planned, thus excluding them from the OEE calculation. As a result, the OEE score tends to be higher than it should be. Setting limits to planned stops so the process doesn’t ignore them, and if operators take longer, immediately contributes to a reduction in OEE.
- Getting cycle times right – Another blindspot we often see is the tendency to underestimate the optimal speed at which products can be produced. As mentioned earlier, this results in performance scores above 100%, again skewing the OEE to the upside.
- Understanding quality – Finally, most manufacturers, when they start out with OEE, ignore their actual quality score and don’t track it in real-time. But if the quality is always 100%, then OEE is inflated.
This is why we often see, in the first six months or so of working with a new customer, OEE readings that are artificially inflated. But once they start digging into the losses and understand what is going on in their production, a more optimal and accurate OEE score is uncovered.
The takeaway is that OEE measurement is a process that gets more accurate in time, and it’s fine to focus first on your main bottlenecks and get better bit by bit, optimizing your targets along the way.
Methods For Setting OEE Targets
Finally, let’s look at a few methods for setting OEE targets that help you get started.
Paying close attention to the process is essential because poor goals are problematic. When the OEE target is too difficult, it can demoralize teams responsible for meeting these unrealistic goals. Or, if the target is too easy, it makes the attainment of the goal meaningless.
In other words, having an 85% target right off the bat is probably not the best goal for your team, nor is a very low target.
As is the case with most performance measurement goals, there are many methods for setting your target for OEE. But there is no silver bullet that is best to use in all cases. In fact, if you roll a dice to set a goal, and the target motivates you to improve, it would be difficult to say the method was wrong. Be that as it may, we will briefly discuss two common methods popular among Evocon clients.
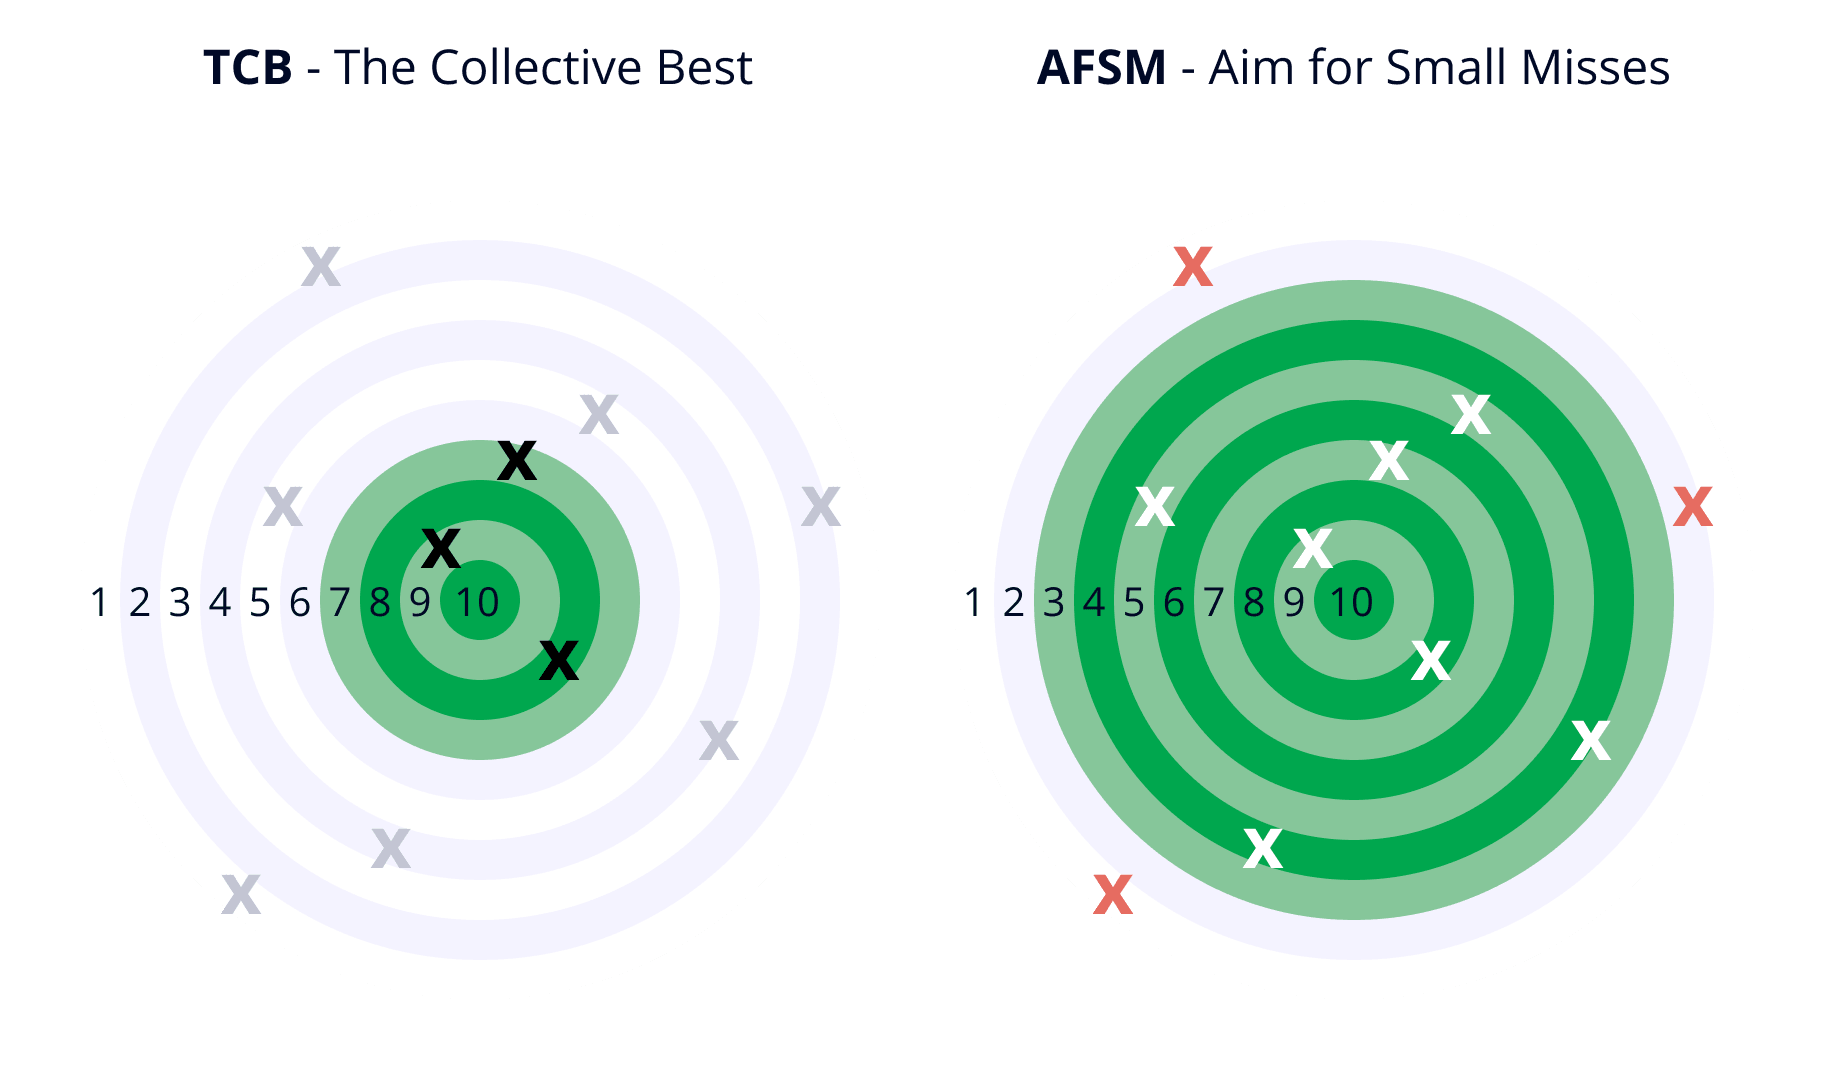
1. Set your daily OEE target to equal the best OEE score recorded in your baseline data
This method is straightforward to put into practice. Let’s refer to it as “the collective best” (TCB) method. TCB only requires you to simply review your baseline data and identify the highest OEE score. This number now becomes your OEE target, as the example below demonstrates.

Using the chart above as our baseline data, we can quickly identify the best OEE score reported as approximately 68%.
Machine operators and managers are accountable for improving the average daily performance to this point. When you reach this milestone, rewards may be in order before you begin the process of setting the next target.
The idea here is as simple as it is powerful: a relentless journey to continually improve by cycling from setting a new target, working to reach it, and then repeating the process. In theory, at least, this cycle could continue without end. Indeed, this is the mantra of continuous improvement – the goal is to take the journey, not to reach a destination.
Note: A popular alternative to TCB is to set your target equal to the average OEE score. While this certainly is an option, we prefer the more challenging TCB. Particularly if you are new to OEE, as there is likely to be a considerable amount of low hanging fruit to harvest.
2. Set your daily OEE target to allow a small number of daily “misses”
This method is about setting a target that the plant can “pass” on most days. Or, put another way, to ensure that you cannot always hit the target.
Though counter-intuitive, your target with this method will allow a small number of daily OEE “misses” each month. Let’s call this method “aiming for small misses” (AFSM).
It may help to think of AFSM as the opposite of the TCB. With TCB, you are setting a target that will require performance improvement before the plant will be able to reach the goal each day. With AFSM, you are setting a target that the plant will be able to achieve on most days, but not every day.
The point of this method is to turn your attention to times when your performance is lowest. To further illustrate, let’s compare the performance gap that each method will focus on.
3. Using industry averages as your benchmark
As a bonus method, you can use the actual data of all our clients, outlined above, to set your targets. But whichever method you use, the important thing is to analyze your data continuously and make corrections to targets when needed. A goal should not be something you set and forget.
Start Calculating Your OEE Now
Many manufacturers still aren’t calculating their OEE scores across their production lines because they either do not know where to start or feel daunted about what is involved. Others simply estimate their OEE scores based on best guesses and production line feedback.
The good news is that there are several ways manufacturers can calculate OEE, none of which require significant capital investment or specific in-house expertise.
OEE can be calculated:
- Using an online calculator
- Doing it manually on a spreadsheet
- Implementing an OEE software – the most accurate and least labor-intensive option.
Using a standard OEE solution, such as Evocon, offers a common way to visualize the production process. And it provides a universal language. The shared influence on the separated processes from a connected system allows managers to monitor the changes, in real-time, without the need to create new methods to measure and share results.
While every manufacturing company is unique, to set OEE targets, the first step is the same: have a clear OEE implementation plan.
