 Enterprise Package
  Integrations
  Security
  Hardware
 How Evocon Works
  OEE Monitoring
  Increasing Productivity
 OEE Calculator
  Evocon
  Join us
 “Visual Factory” is a lean manufacturing term that refers to the use of visual elements to convey information and data in a manufacturing environment. It includes an extensive set of tools, physical as well as digital: signs, boards, andons, charts, graphics, and on-screen data visualizations.
In lean manufacturing, time and resources spent displaying information are considered a form of waste (a necessary waste, of course). Visual factory tools reduce waste and, as shown in systematic reviews like The Value of Novel Technologies in Context to Performance Measurement and Management (2023), improve communication and safety.
In this article, we provide a comprehensive list of visual factory tools, a practical implementation guide, and visual examples.
What are the Tools of a Visual Factory?
Visual factory tools can be categorized into three types of information:
- Process-related metrics
- Work instructions and guidelines
- General information
1. Process-related metrics
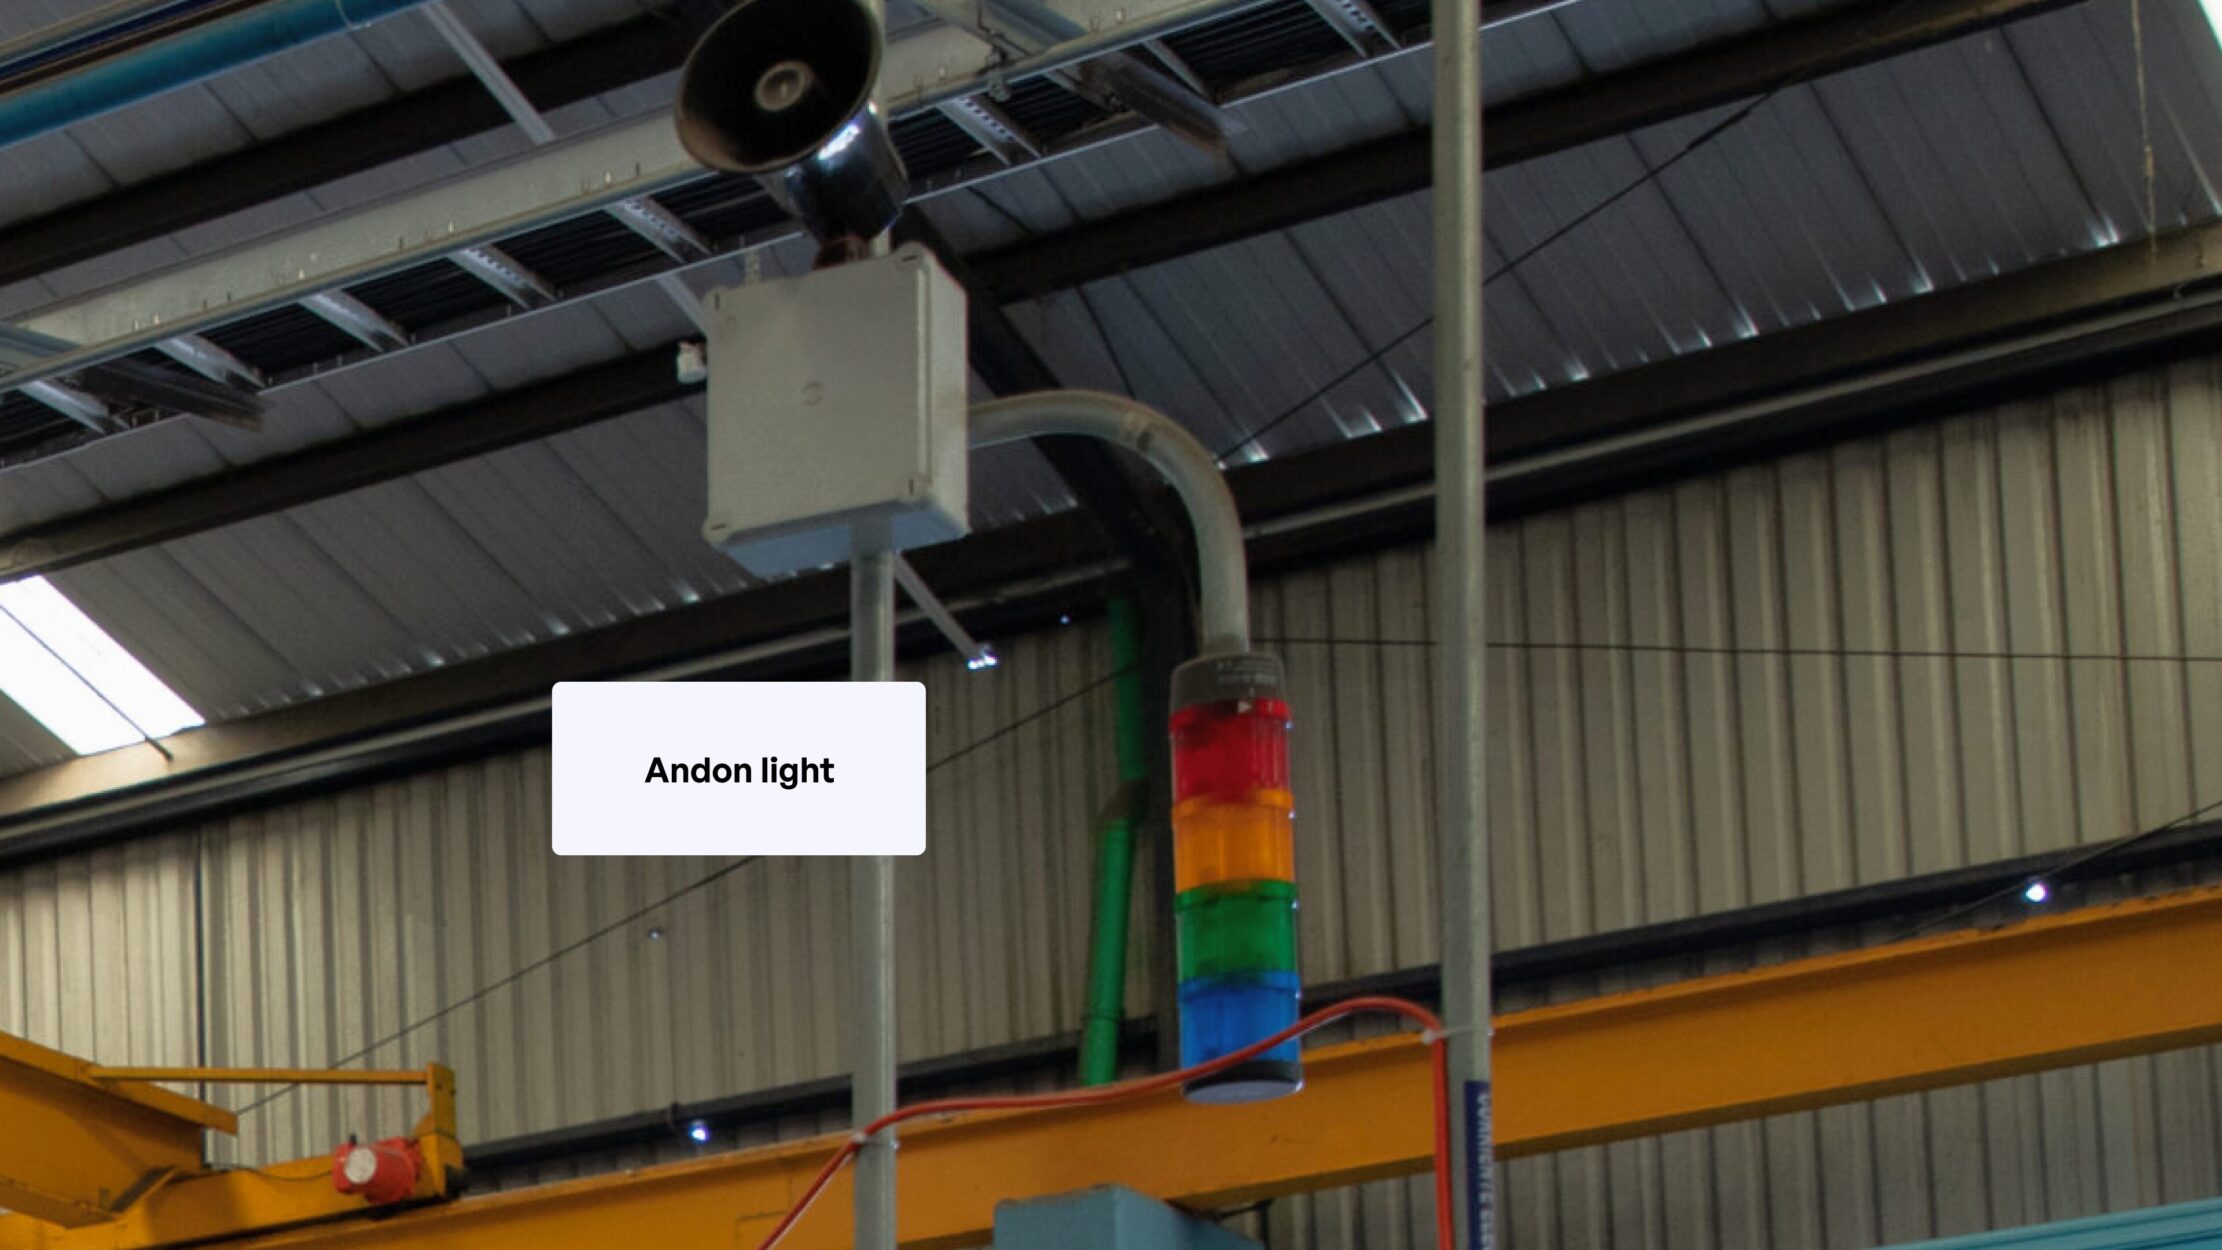
Typically displayed near the machine or production line, real-time data enhances improvement. This is a result of implementing automated data collection. A prime example of this is the Andon system, which uses visual indicators, such as red or green lights, to signal problems.
Kanban boards help manage workflow, and track inventory and work-in-process (WIP).
KPI boards, or on-screen process metrics, display data such as OEE (Overall Equipment Effectiveness). This allows workers to keep track of metrics throughout shifts.
Our clients are increasingly asking for additional production data to be displayed in real time next to their machines, such as cycle times, energy consumption, and production counts in relation to targets.
2. Work instructions and guidelines
To minimize errors and improve communication, instructions with photos, charts and graphics are posted in locations where they are needed.
Displaying instructions with photos, charts, and graphics minimizes errors and improves communication. Here are the types of tools in this category:
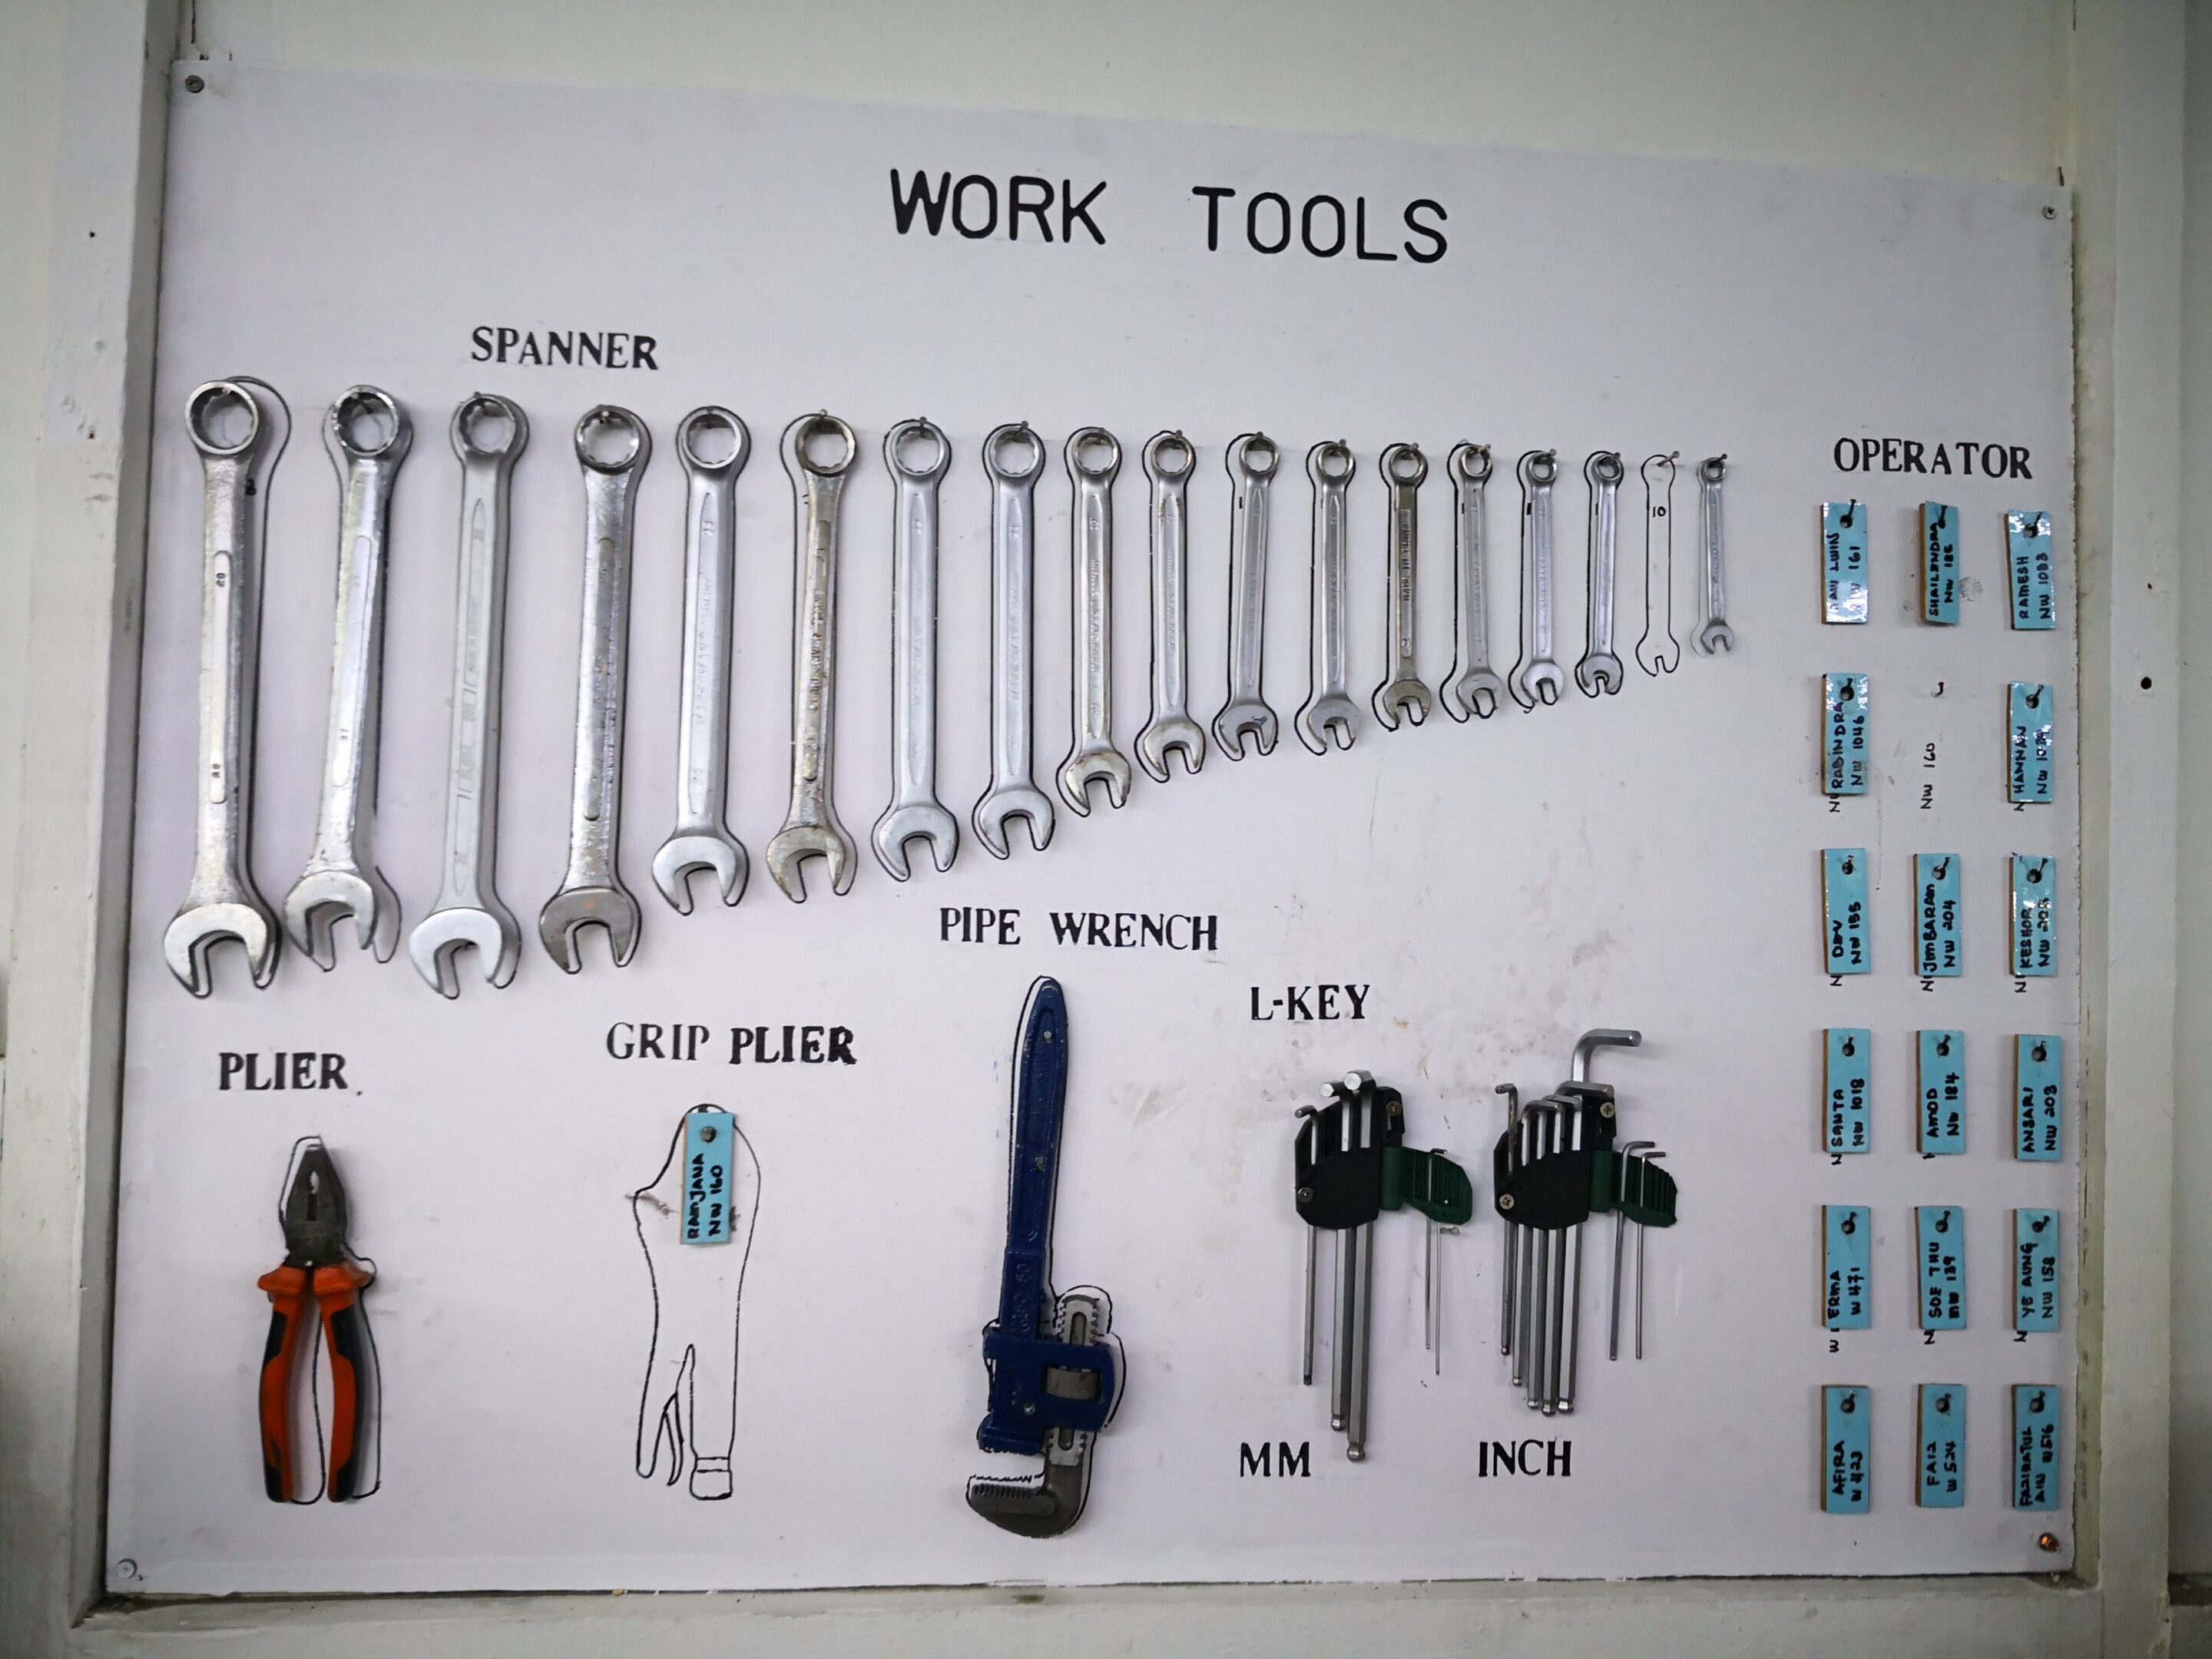
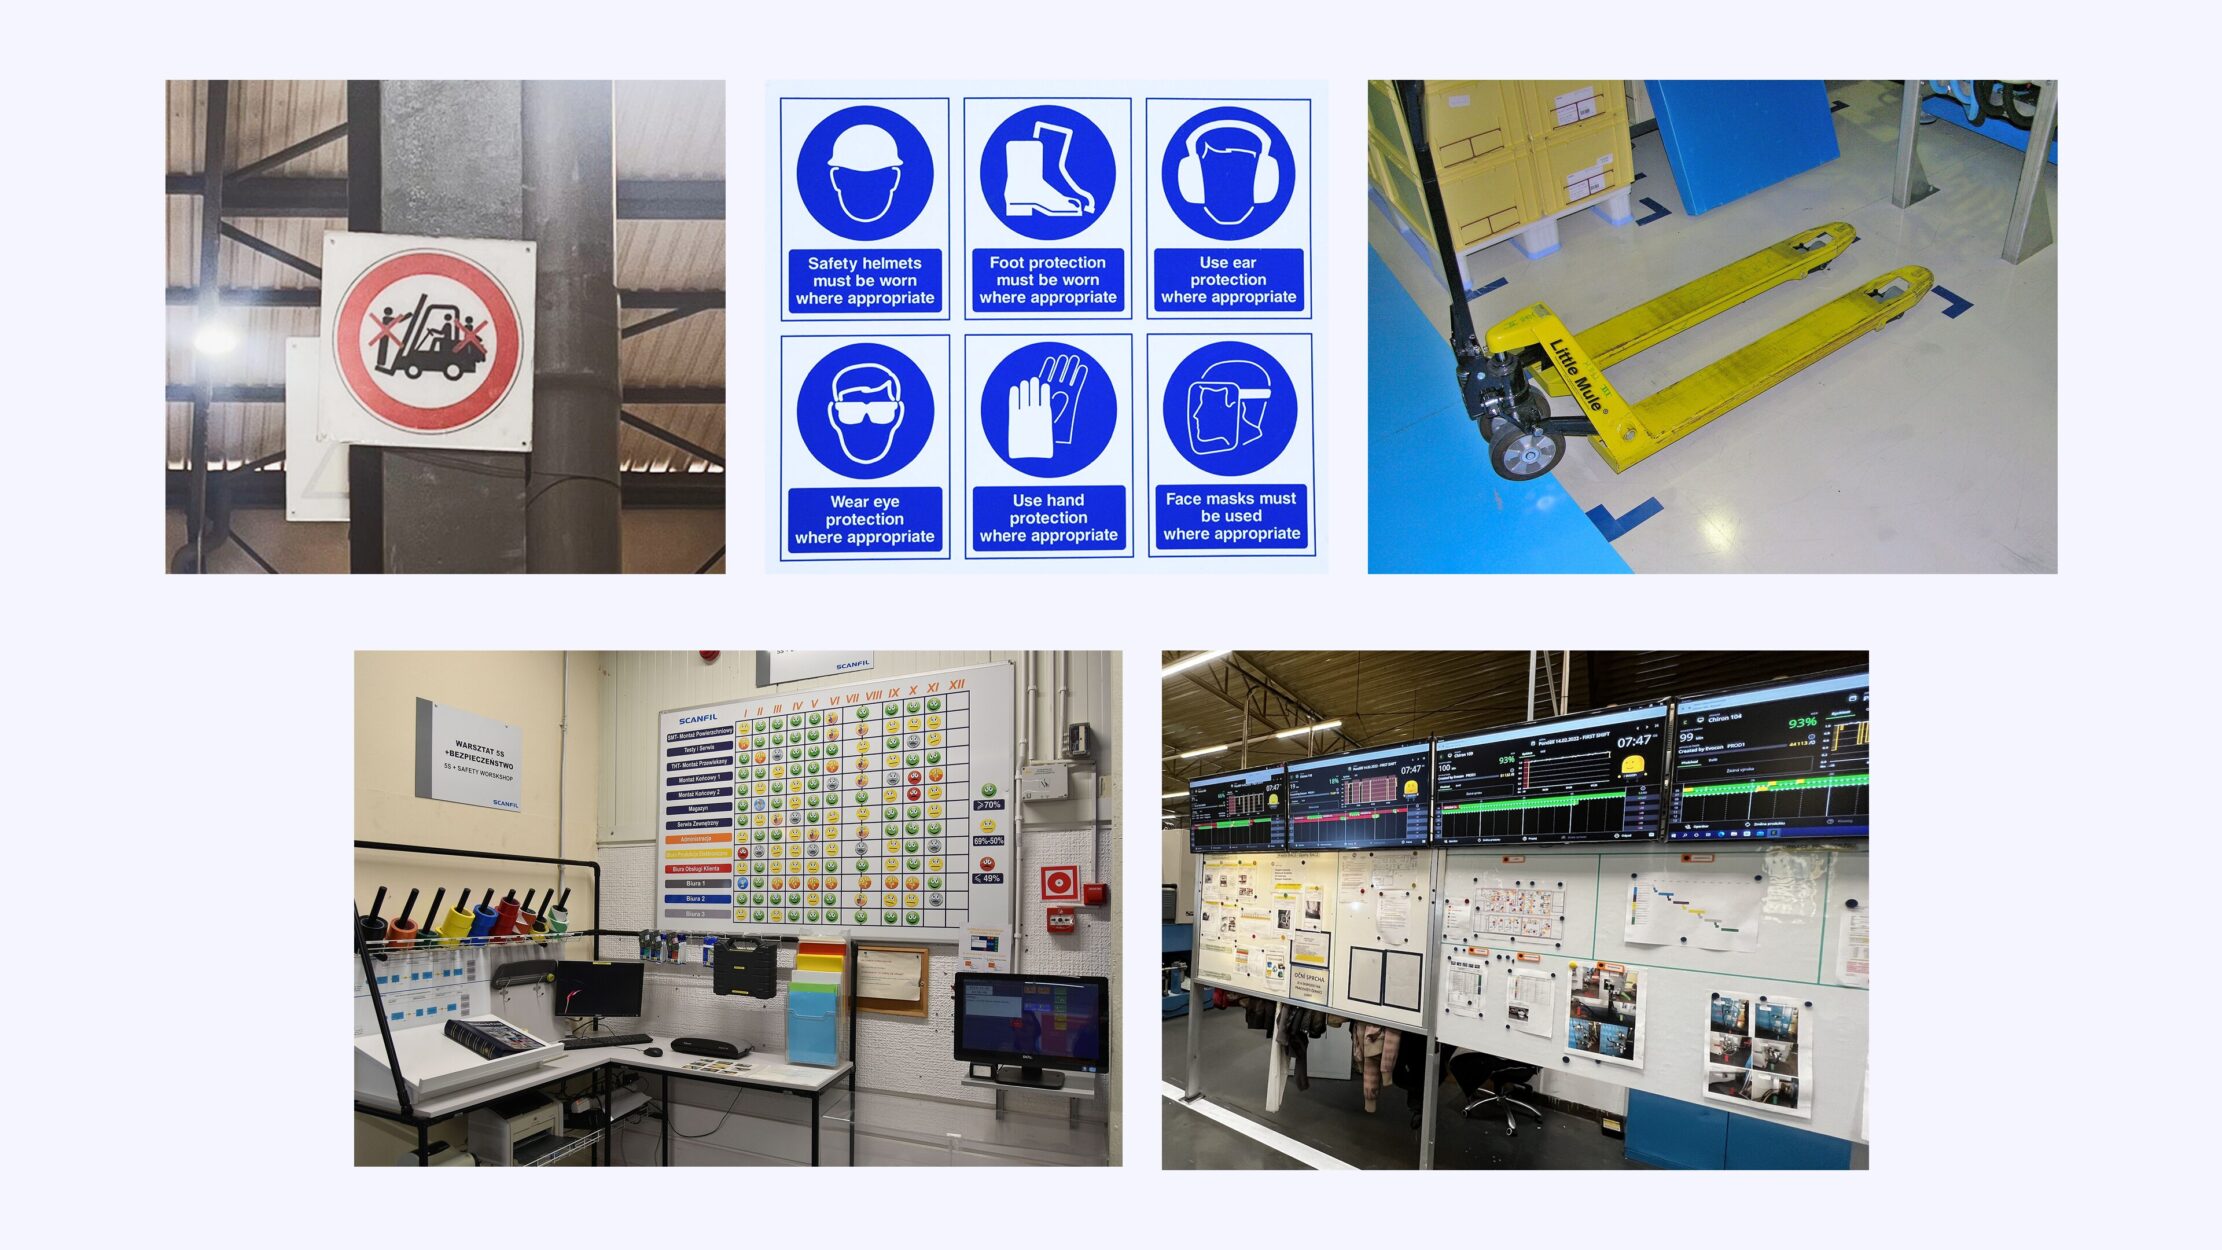
- Shadow boards, color-coded labels, and signs are used to mark tools, materials, and work areas.

- Standard Operating Procedure (SOP) boards are used to display key operational procedures, guidelines, and best practices in a workplace
- Process flow diagrams visually represent the overall flow of work and the role of employees at each step.
- Visual checklists ensure all procedure steps are followed or all quality standards are adhered to.

- One-Point Lessons (OPLs) are short visual guides that focus on a single specific aspect of a task and highlight critical points or common errors.
- “Before and after” photos show the correct/incorrect state of the work area or task completion.
3. General information
Visual tools are essential when displaying general information in the working area. They are meant to keep everyone informed about important updates, safety protocols, and overall operational status. Here are some examples:
- Safety posters (warnings, safety procedures, emergency contacts)
- Wayfinding signage (directions to restrooms, breakrooms, emergency exists)
- Maintenance schedule and log boards
- Production plans and schedules
- Performance dashboards (production output, defects, on-time delivery KPIs)
- Employee recognition boards
- Notice/bulletin boards, company news
- Company values, mission statements
Practical Implementation Guide
In practice, there are two phases to implement a visual factory:
- Identify which information needs to be visualized
- Visualize the chosen information
1. Identifying which information needs to be visualized
Not everything needs to be visualized — sometimes, it can be counterproductive. To decide on the priority, use this process:
- Define the current state of operations compared to the desired state
- List goals you need to achieve to get to the desired state
- Choose the information most relevant to the goals identified
2. Visualizing chosen information
To make implementation easier, use frameworks that provide visual tool templates as part of their system:
- 5S methodology is a well-known framework that relies heavily on visual tools and creates a visually organized environment
- Lean manufacturing, in general, includes many visual tools (Kanban, Andon, etc.)
- Six Sigma uses tools like control charts and process maps
- Total Productive Maintenance (TPM) provides visual tools like equipment status displays, maintenance checklists, and visual indicators of equipment condition
Implementing these visual tools and systems enhances operations and supports lean continuous improvement.
The Benefits of a Visual Factory
Visual factories improve collaboration by providing real-time information shared by everybody, reducing the necessity for frequent meetings. This visibility also minimizes errors and improves safety, because it makes any irregularities immediately apparent.
With this increased visibility, KPIs become clear and allow instant assessment of status and opportunities to make decisions faster. Overall Equipment Effectiveness (OEE) is an essential KPI that provides actionable insights. With OEE being our area of expertise, we provide more information in a later chapter.
Continuous Improvement (Kaizen) as a whole, benefits from visuals directly since it relies on making areas of improvement obvious.
Equipment maintenance is also more effective due to clear schedules and real-time machine status updates.
And last but not least, staff training is much easier, employee engagement is much higher, thanks to visual instructions and performance displays.
All of this leads to:
- increased uptime
- reduced waste
- better customer satisfaction
Research supporting these benefits
Strategic use of visual tools within physical working environments has been a research subject in the area of lean manufacturing for decades, with abundance of published papers. If you are interested to dive into evidence, we recommend the following research papers that you can download from the source for free, prioritizing more recent ones, that are relevant to the points made in this article.
- The Value of Novel Technologies in Context to Performance Measurement and Management: A Systematic Review and Future Research Directions (2023) systematically reviews the impact of emerging technologies on performance measurement and management, outlining their value and suggesting future research directions.
- Benefits of Visual Management in The Automotive Industry (2023) explores how visual tools and techniques enhance efficiency and reduce waste in automotive manufacturing processes.
- Patterns for Visual Management in Industry 4.0 (2021) reviews how Industry 4.0 technologies enhance the effectiveness of visual management by inspiring new or improving existing software tools.
OEE Software as a Key Aspect in a Visual Factory
OEE is a critical metric to know and track in any factory. It can also significantly contribute to a visual factory by quantifying production in a visual and understandable format.
Visual language is just as important in digital products, such as machine monitoring and OEE software, as on the shop floor. Even small visual tweaks can make a big difference in how easy it is to use digital products.
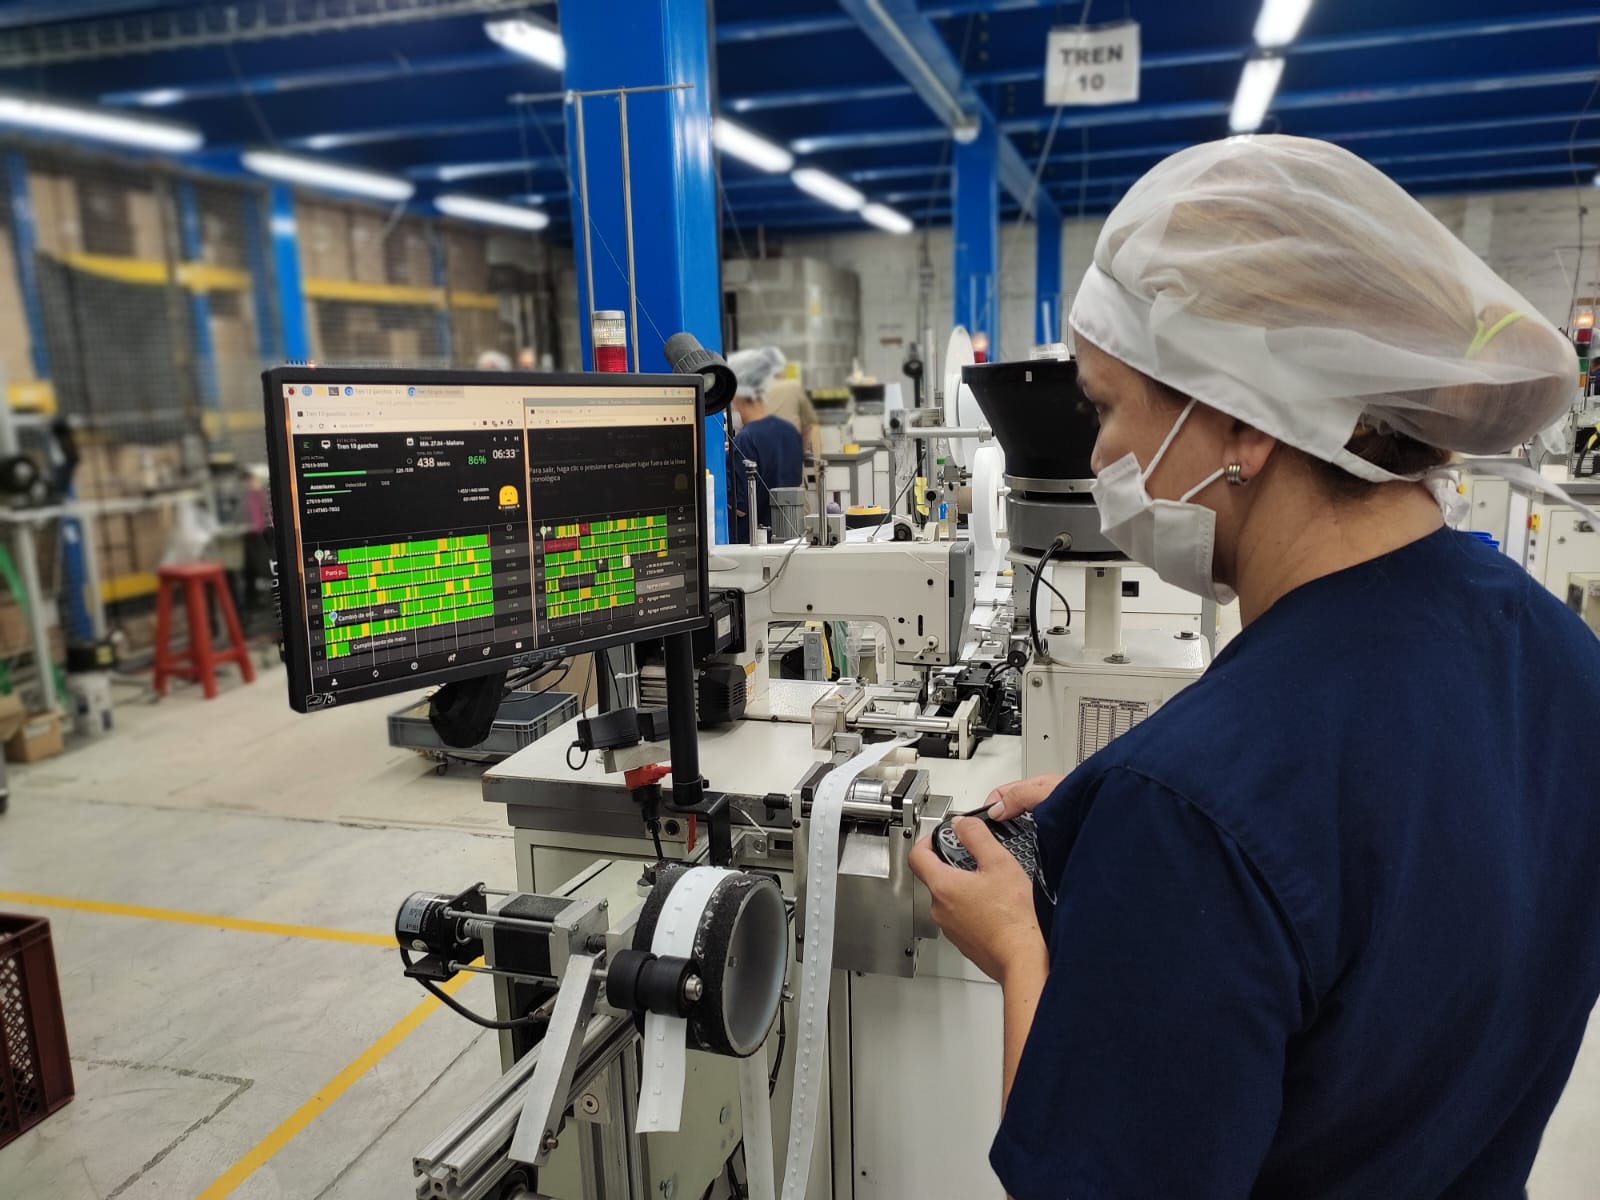
Many of our clients prioritize putting up multiple screens around the shop floor — some for a general KPI overview, others for each machine to visualize real-time production of that machine.
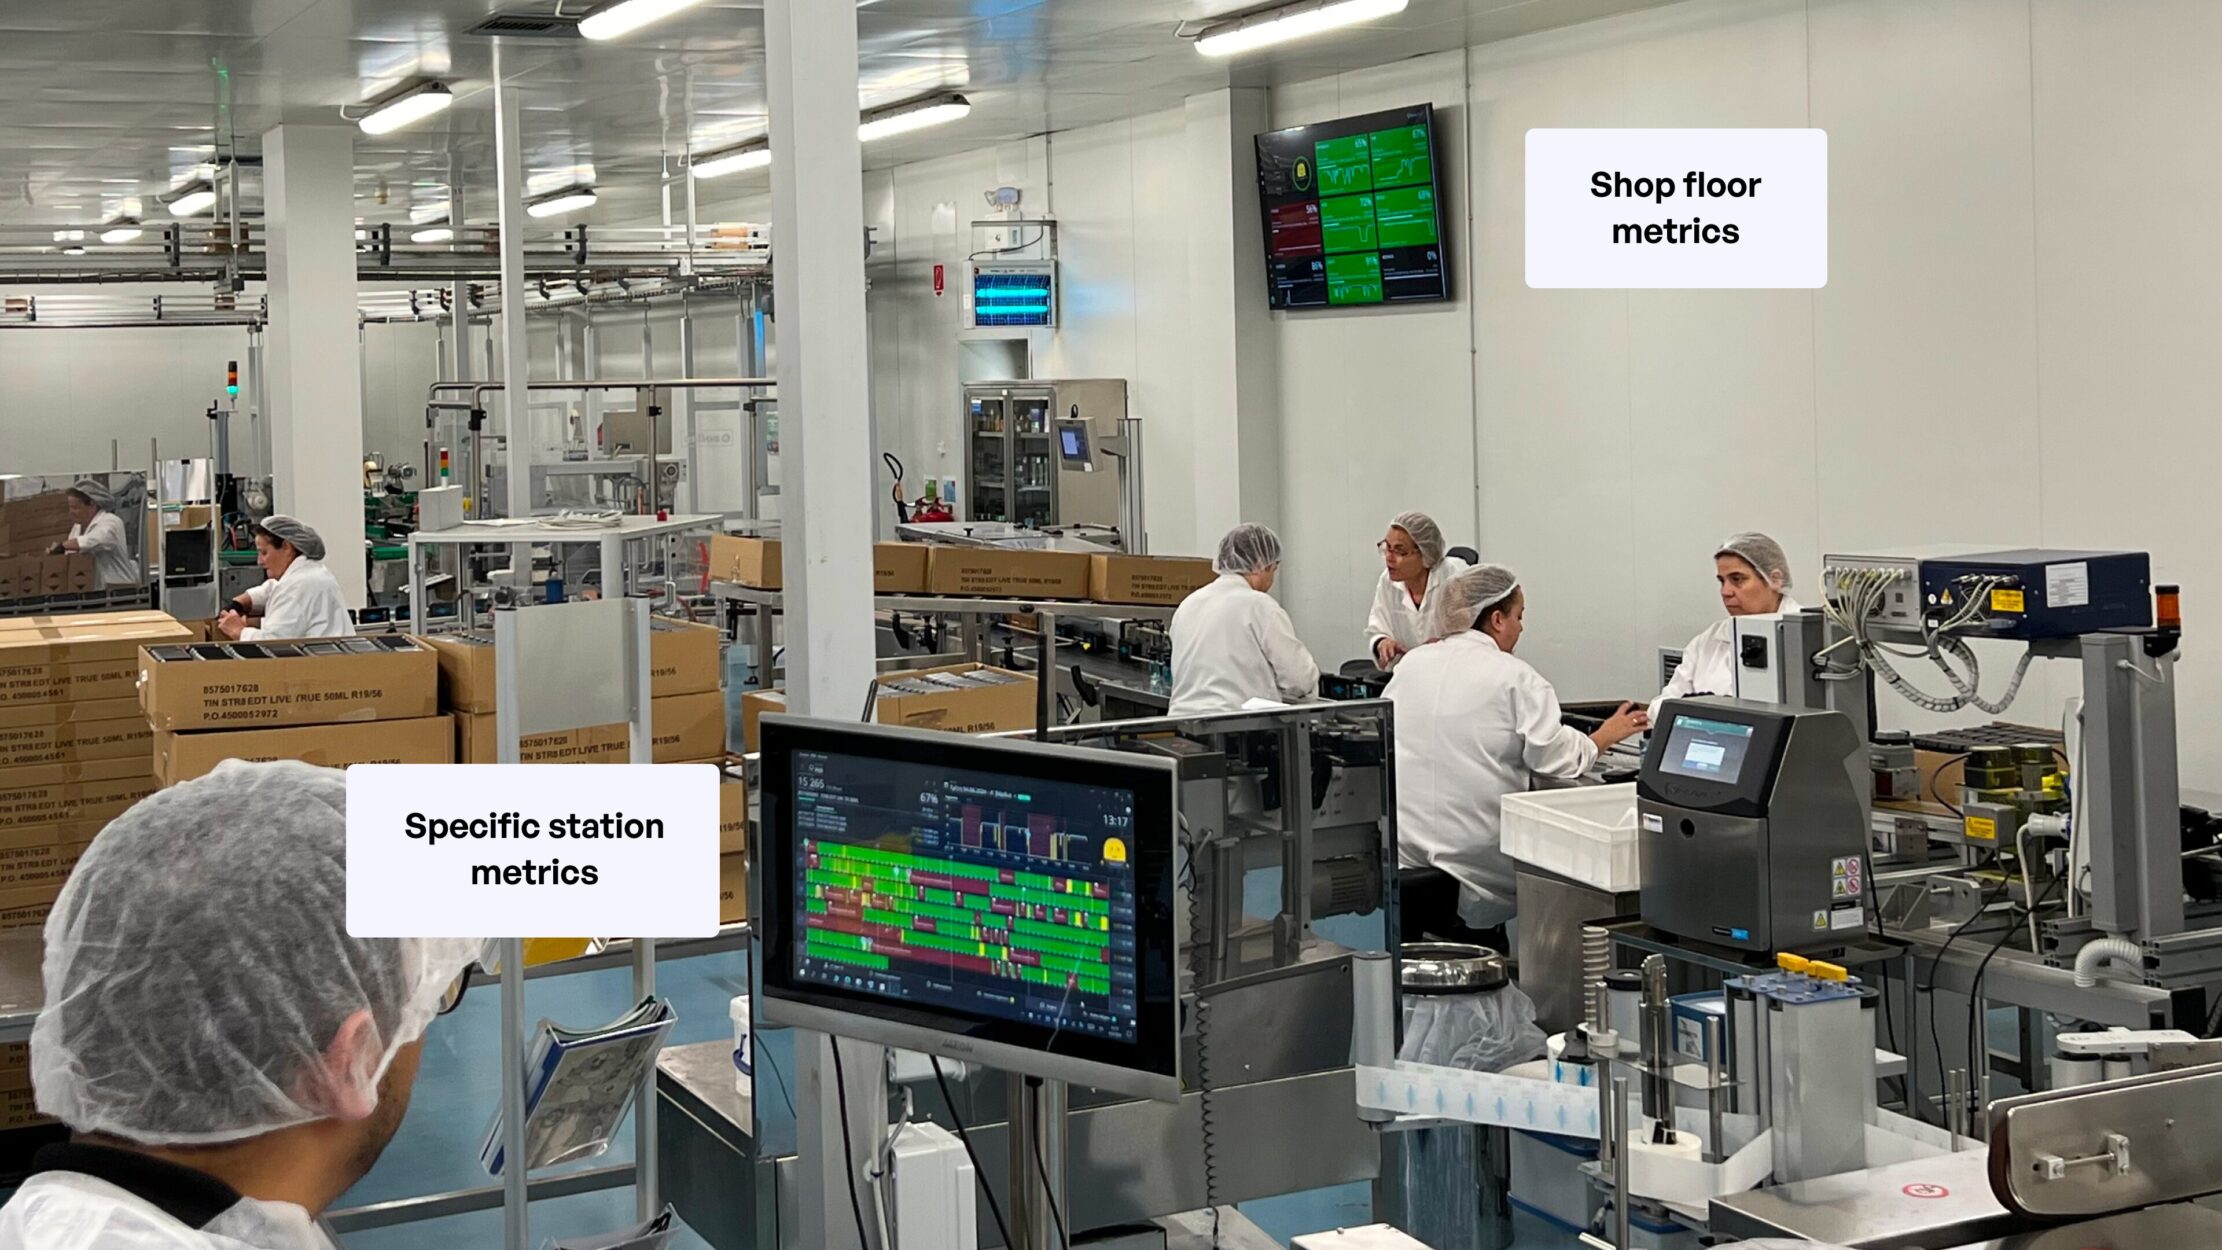
It’s particularly valuable on the shop floor, where we see increased engagement among operators.
In addition, Evocon contributes to visual factory in a couple of other ways:
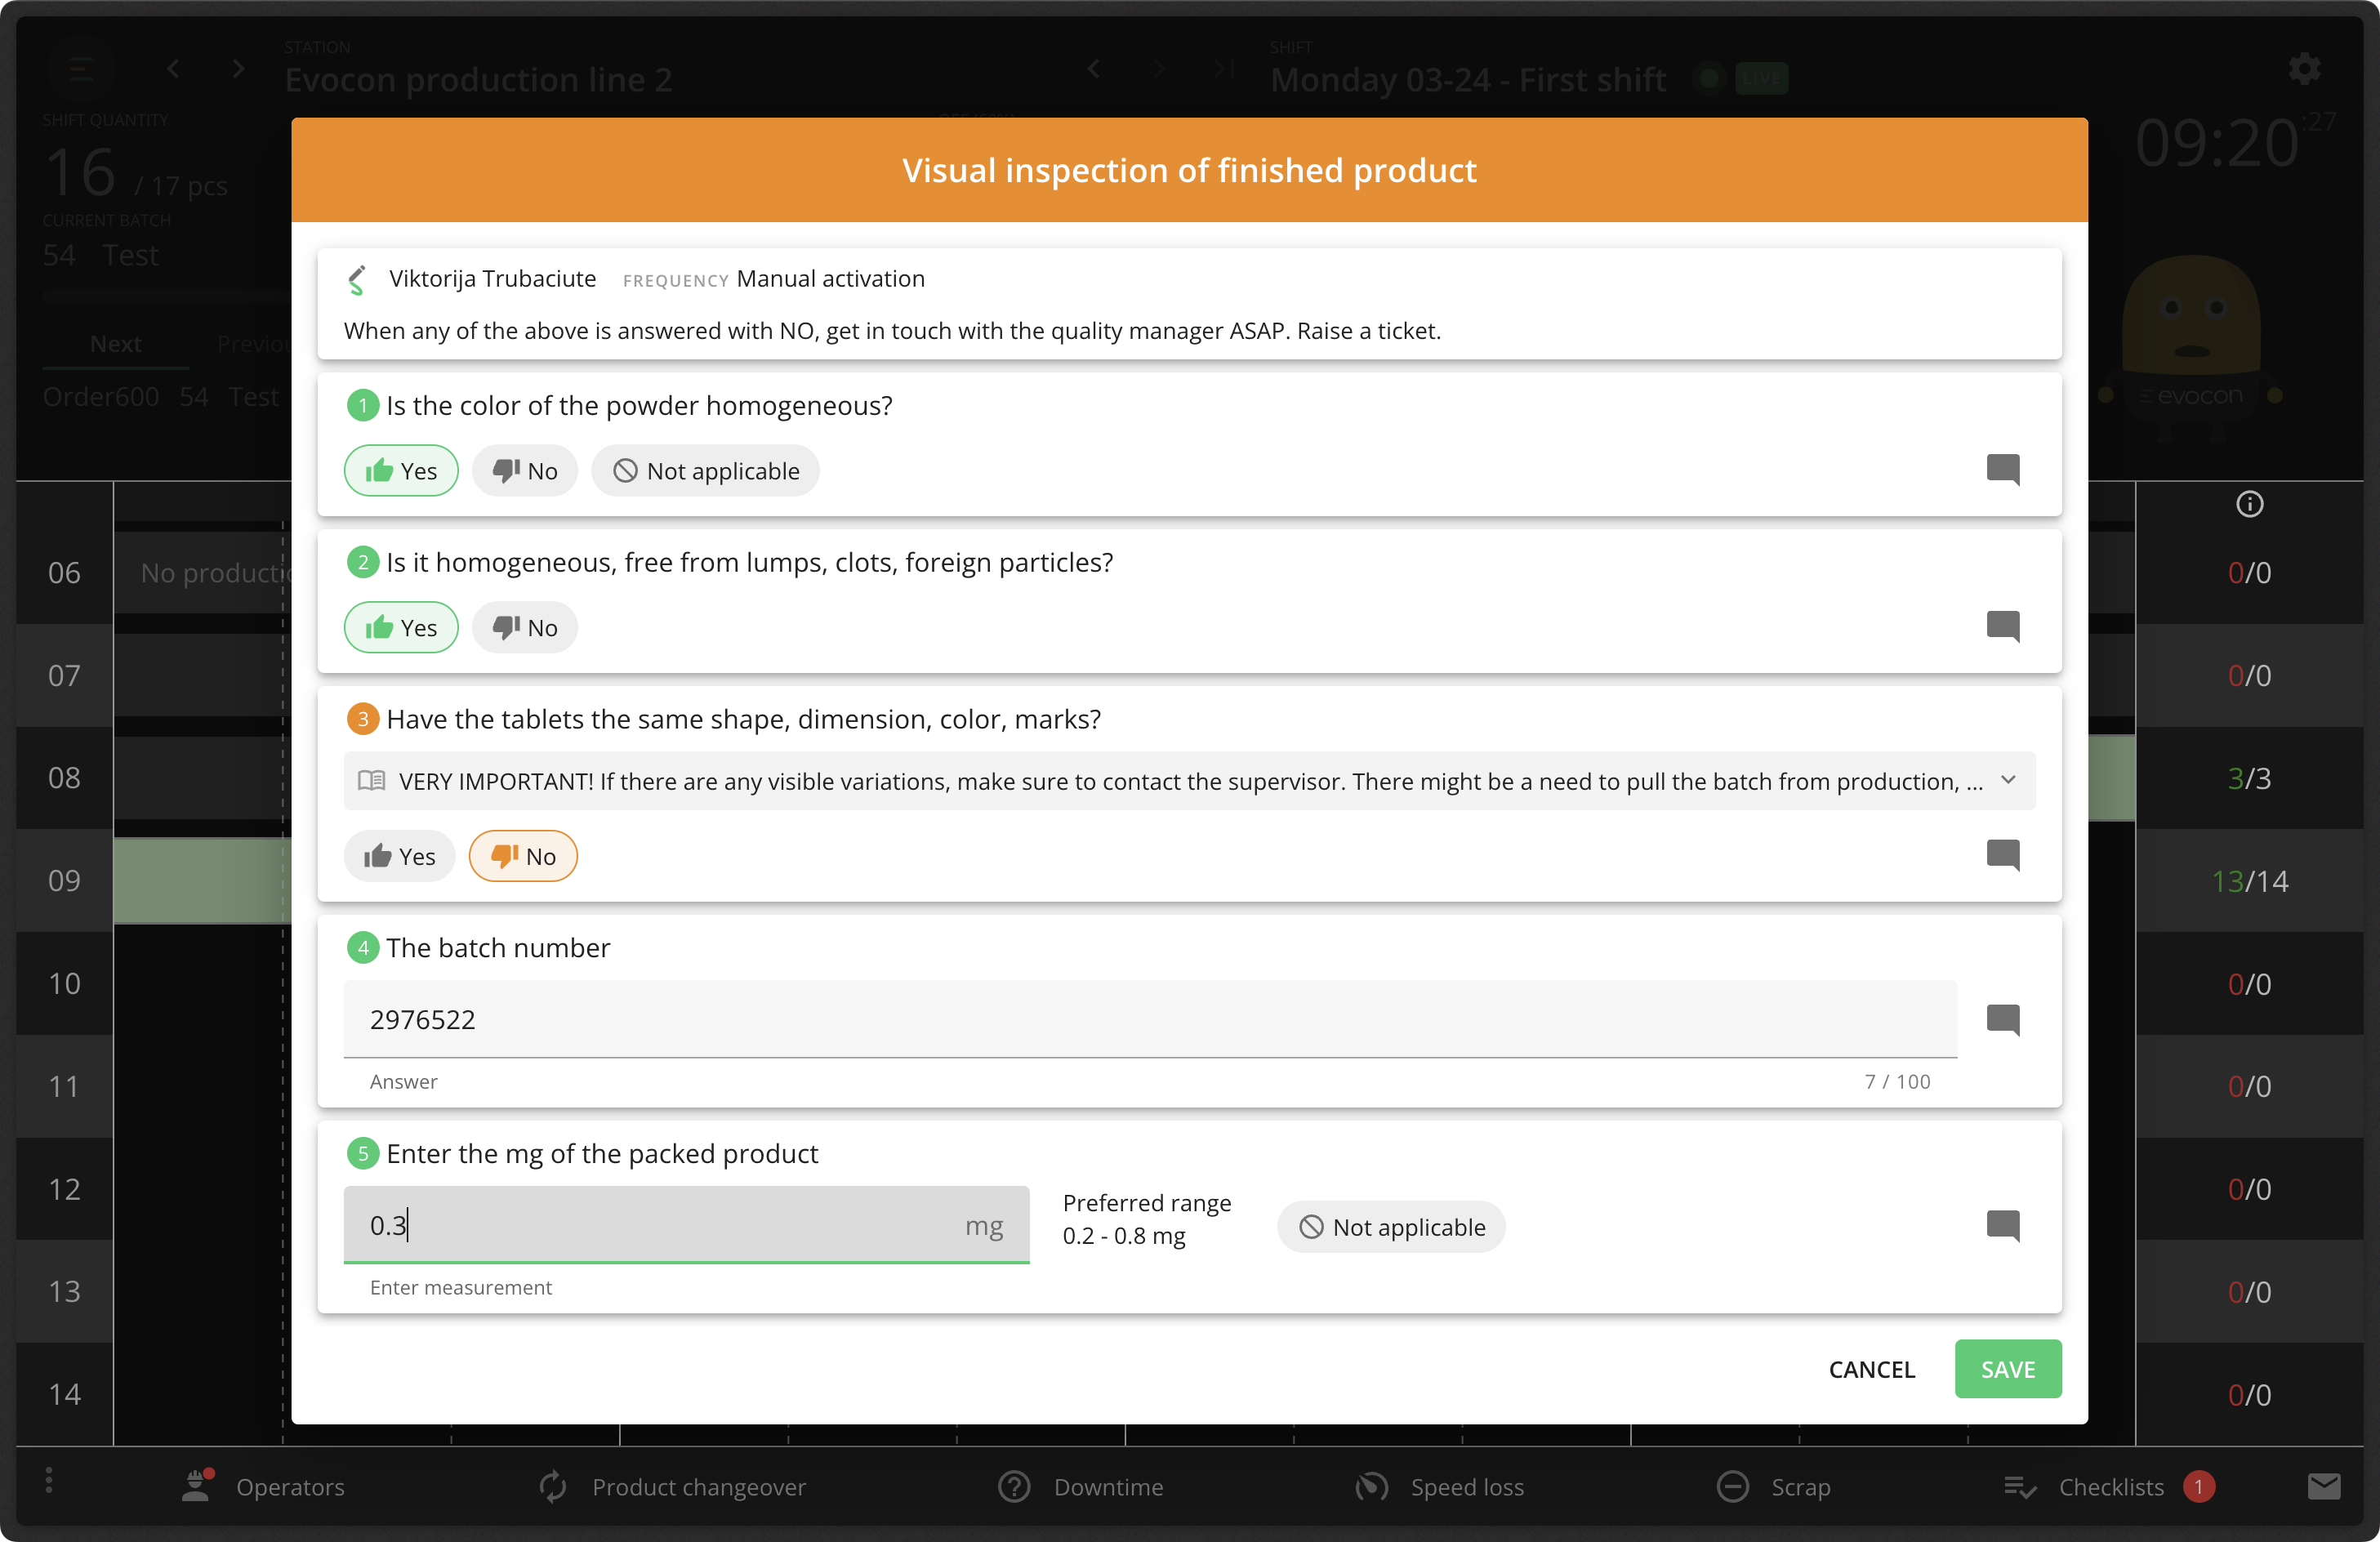
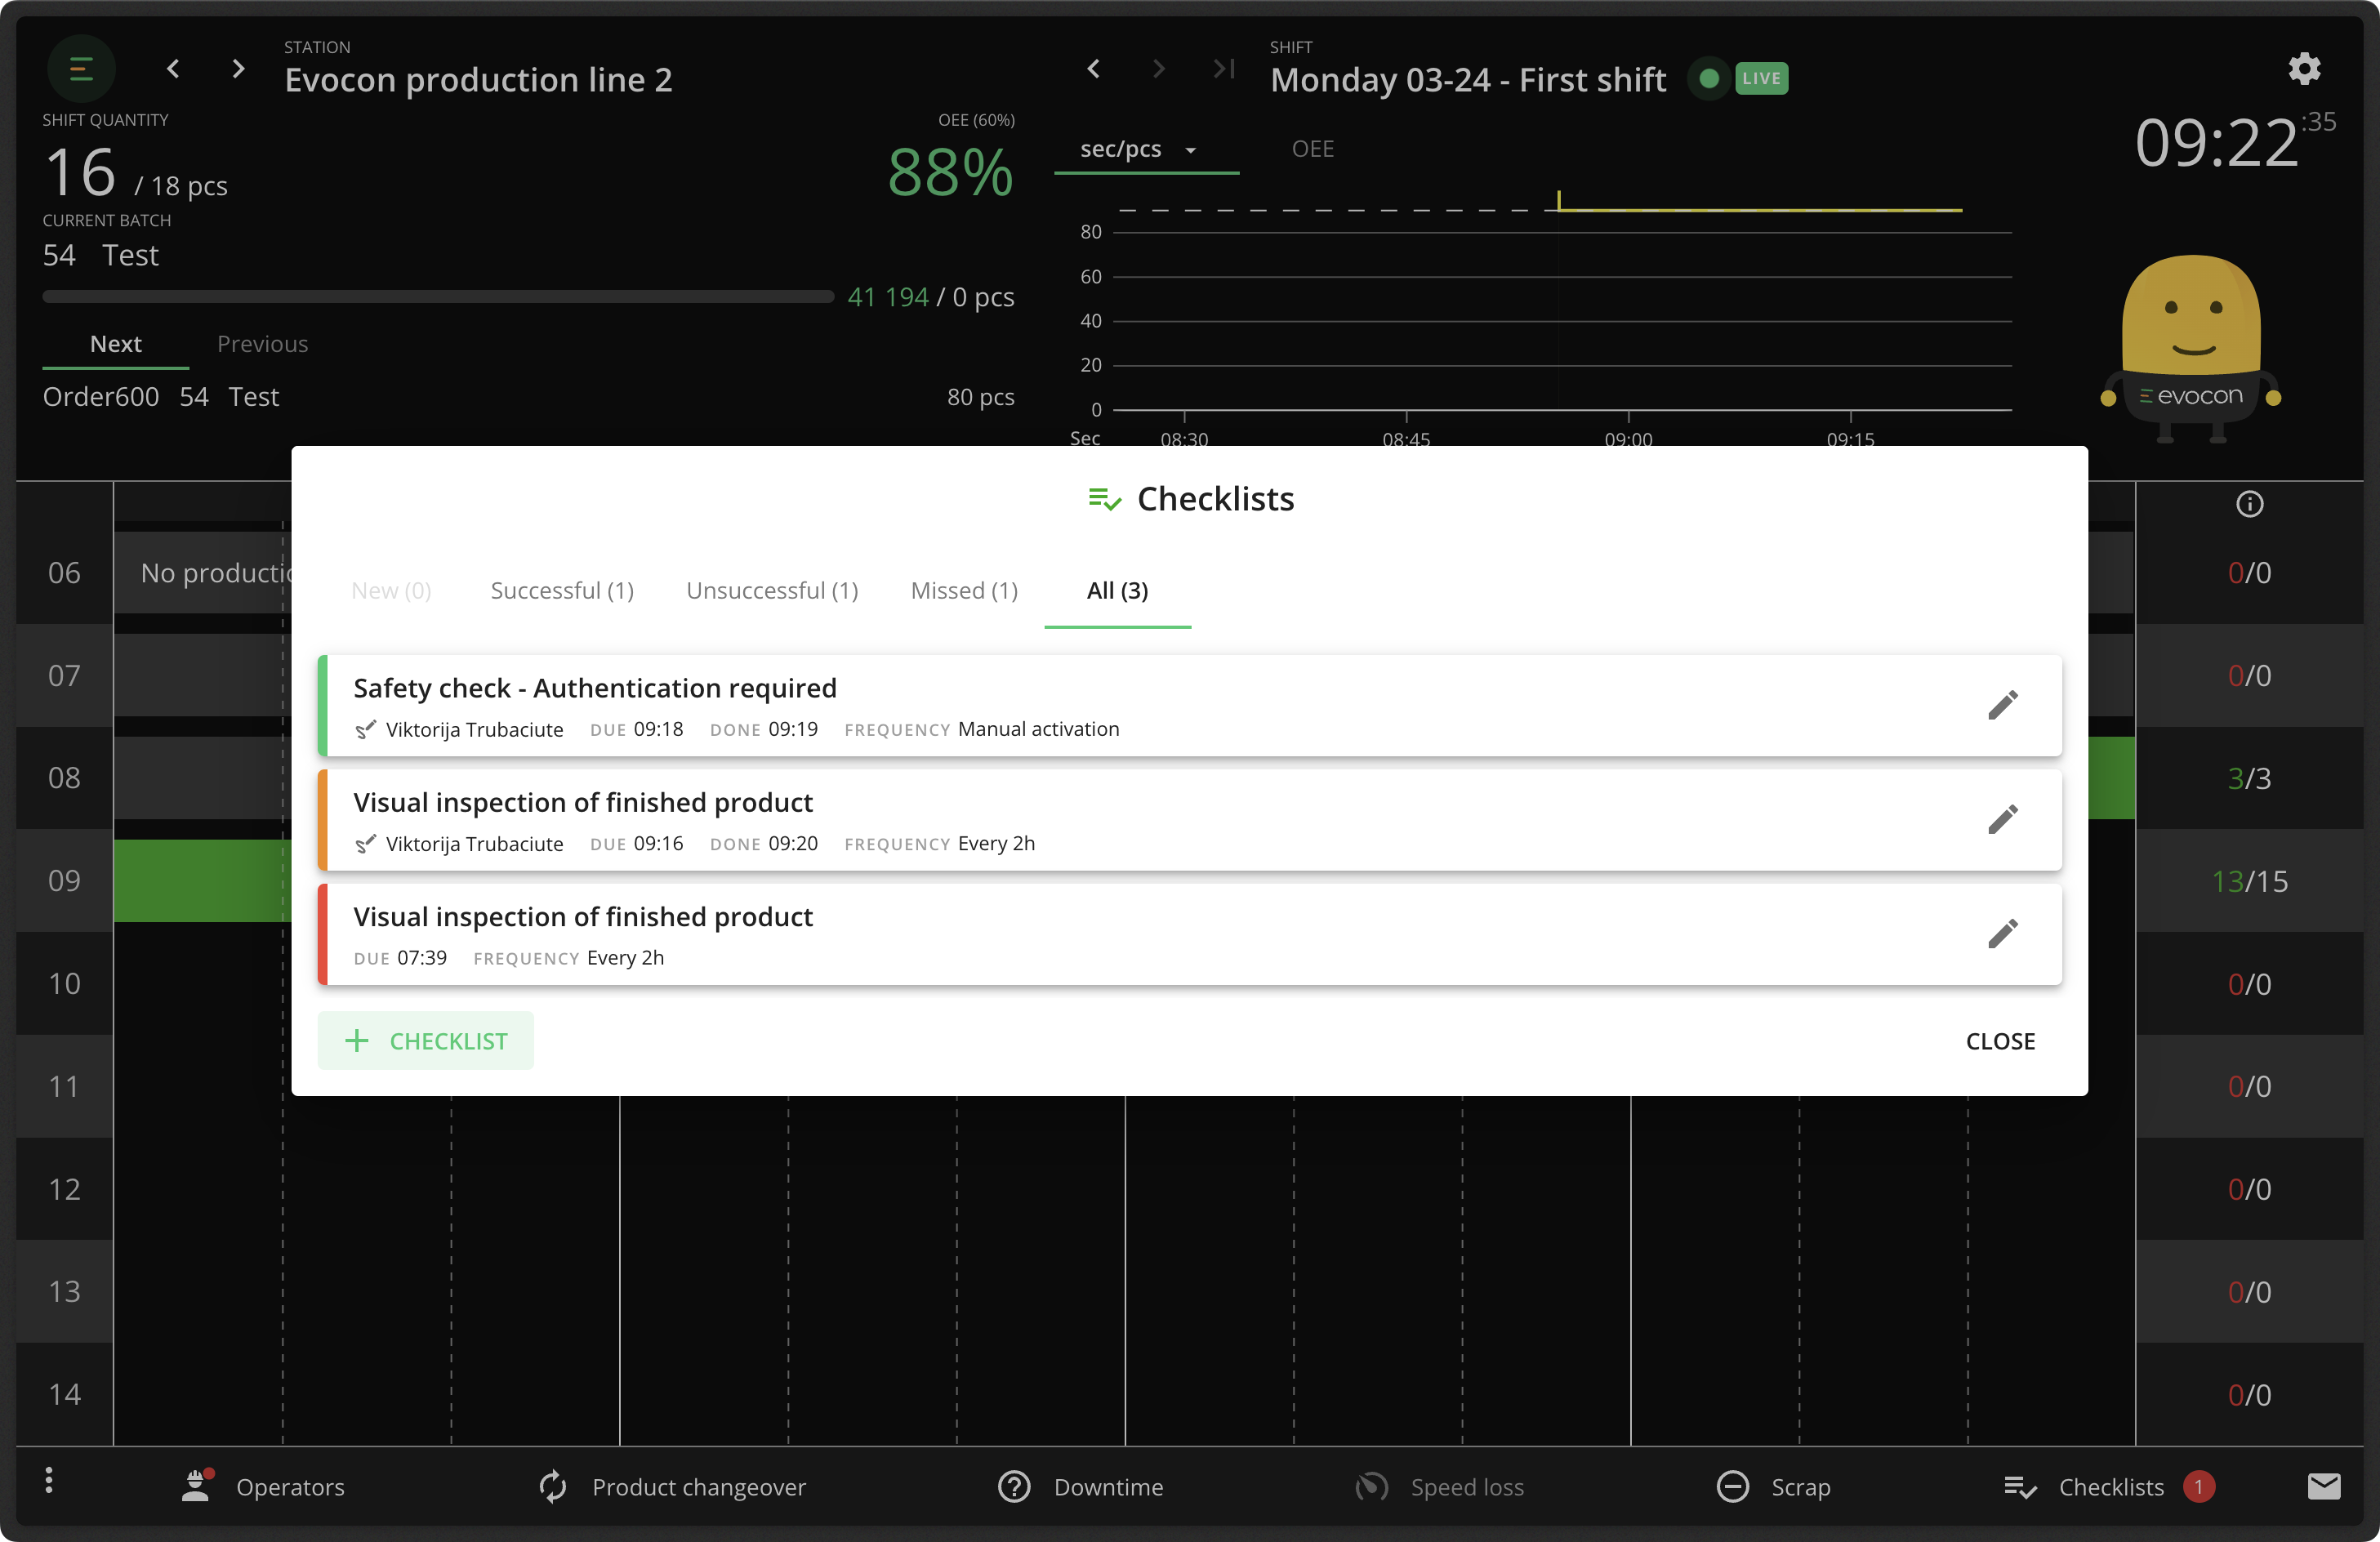
- Evocon’s Checklists feature is a visual cue that appears on the screen for operators to perform a quality check.
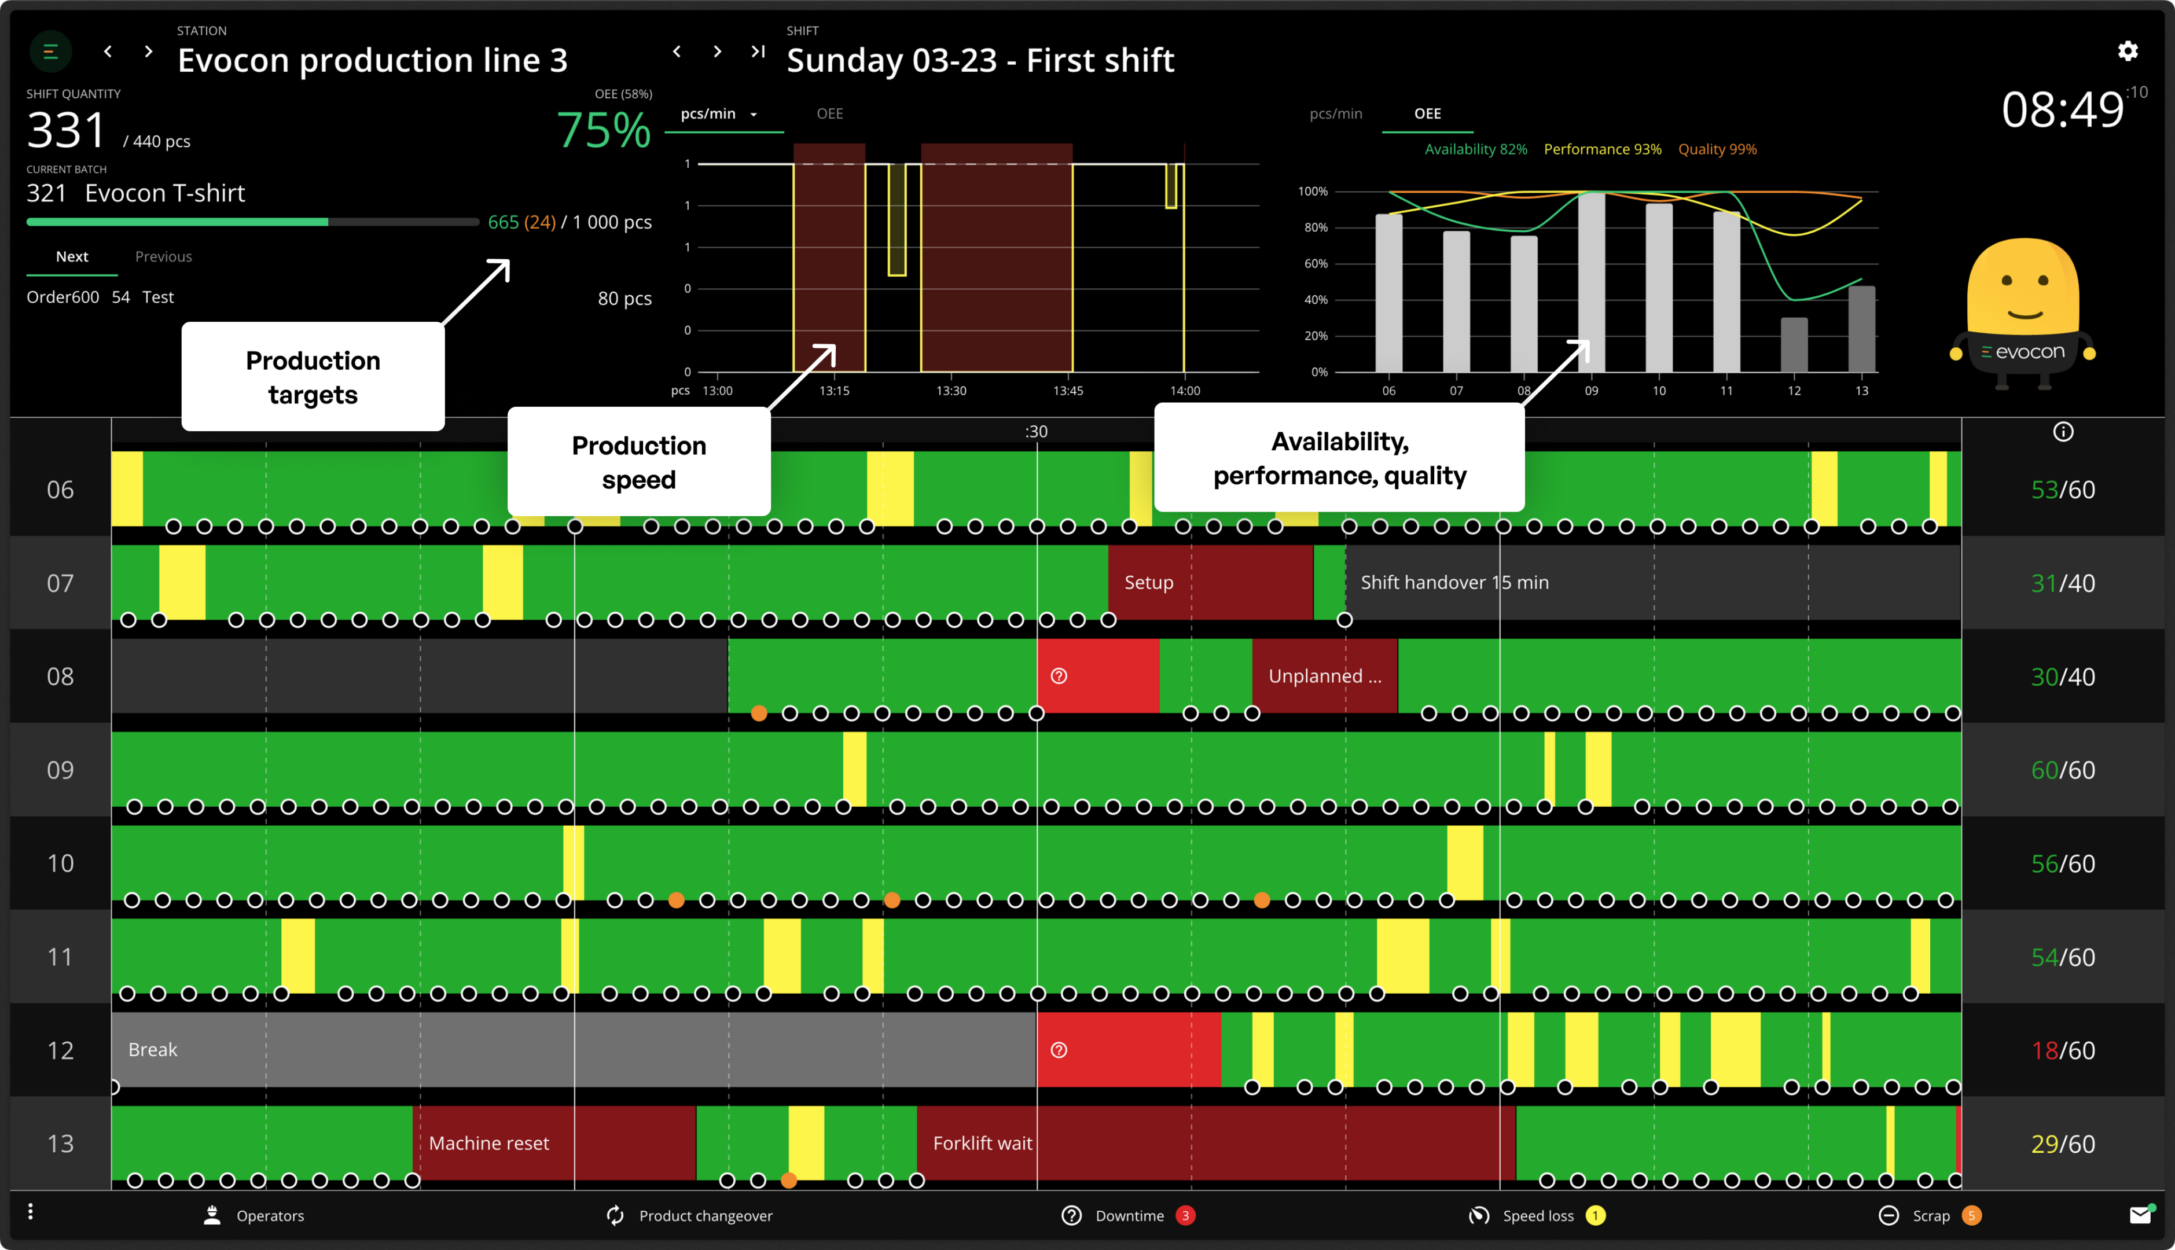
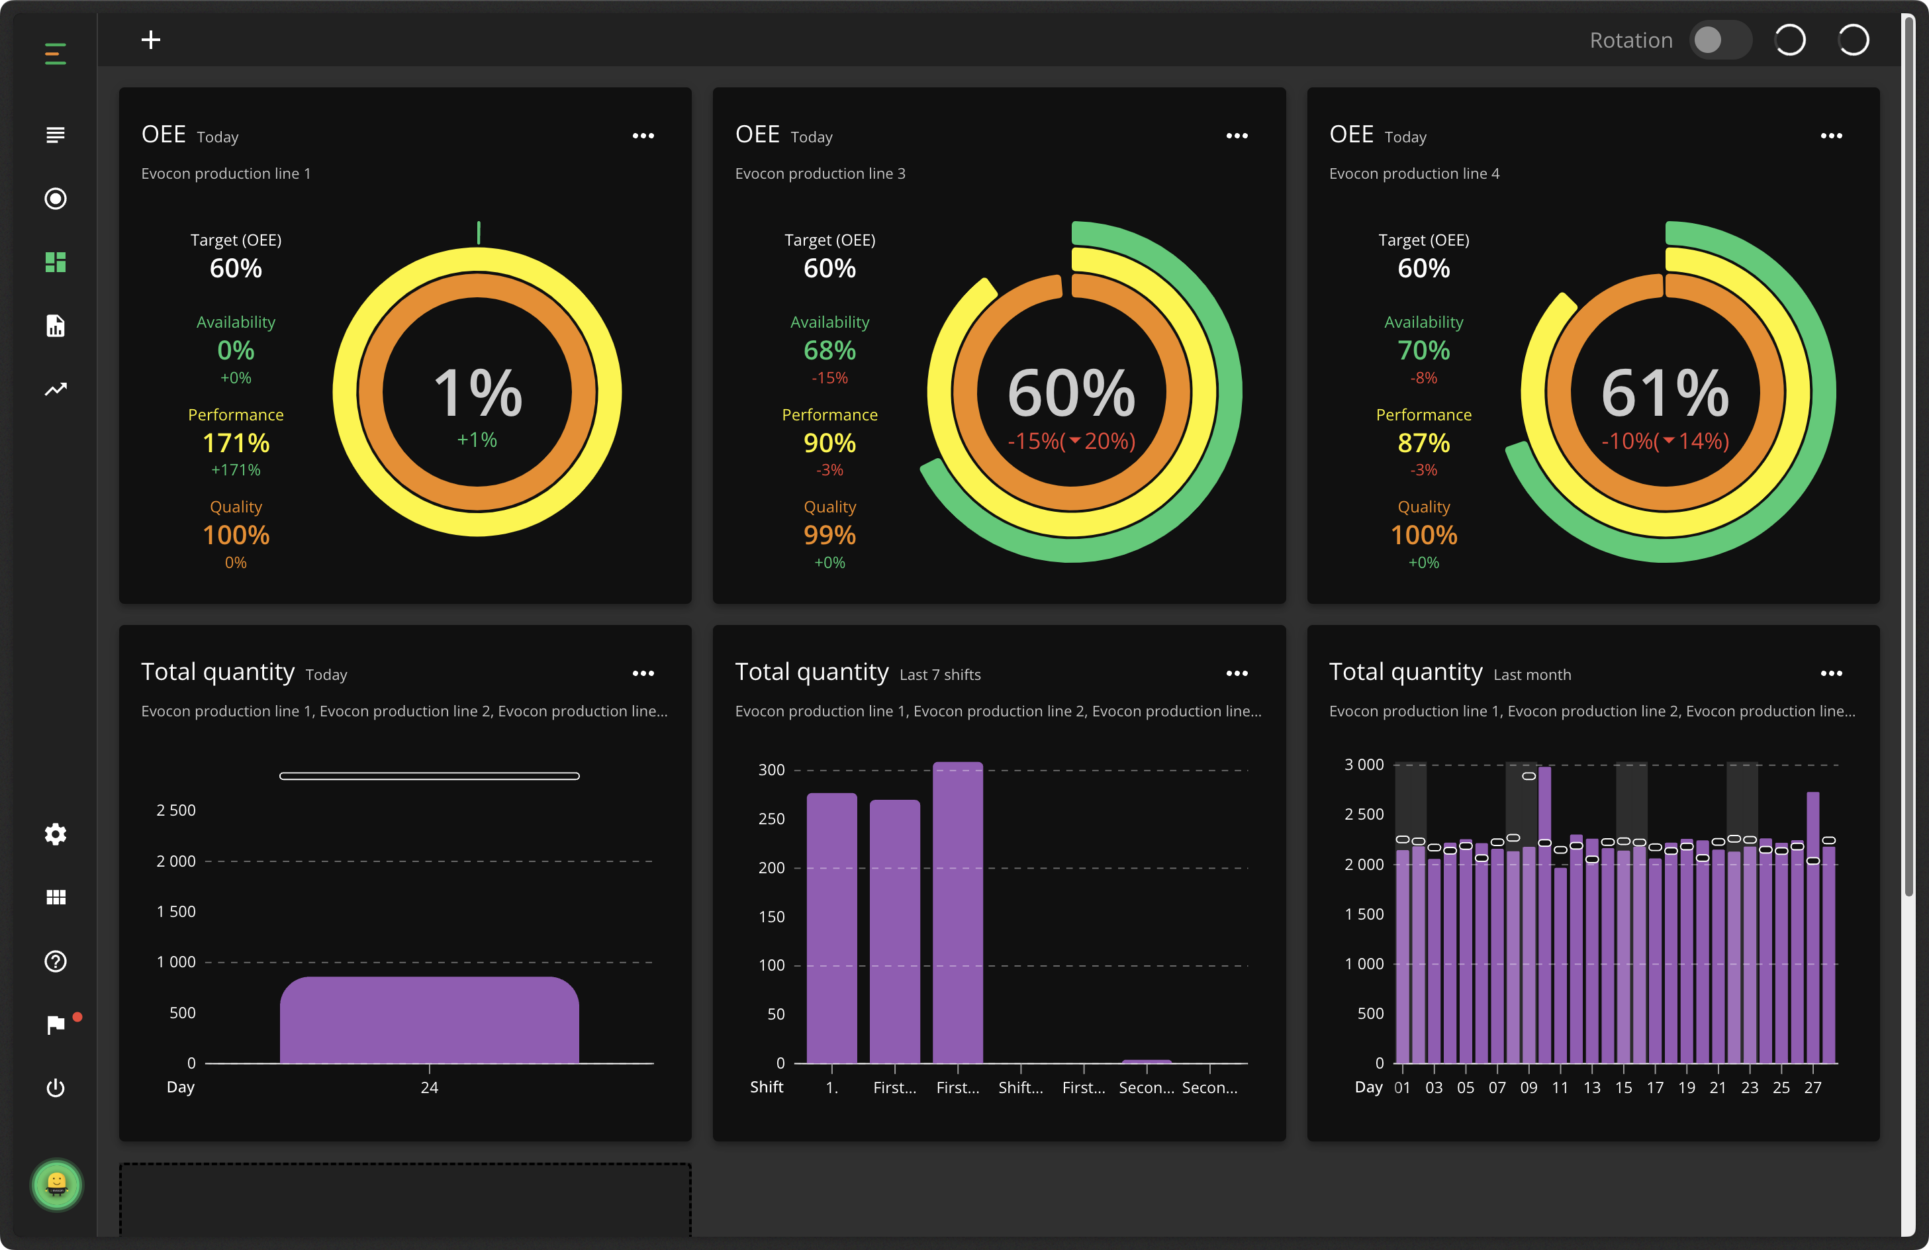
- The color-coded Shift View makes machine status visible: green, yellow, and red colors indicate what is going on in real-time as well as providing the performance history of the ongoing shift.
- Additional process metrics are also visualized, such as energy consumption, production counts, and production targets.
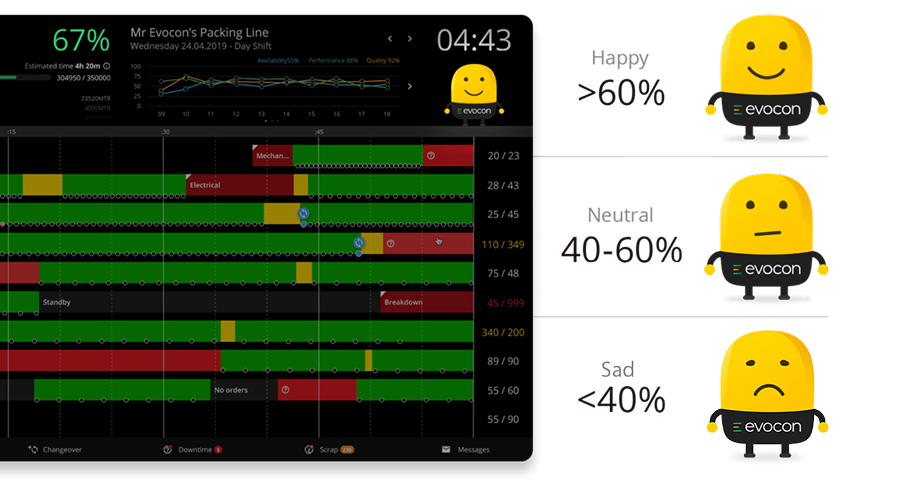
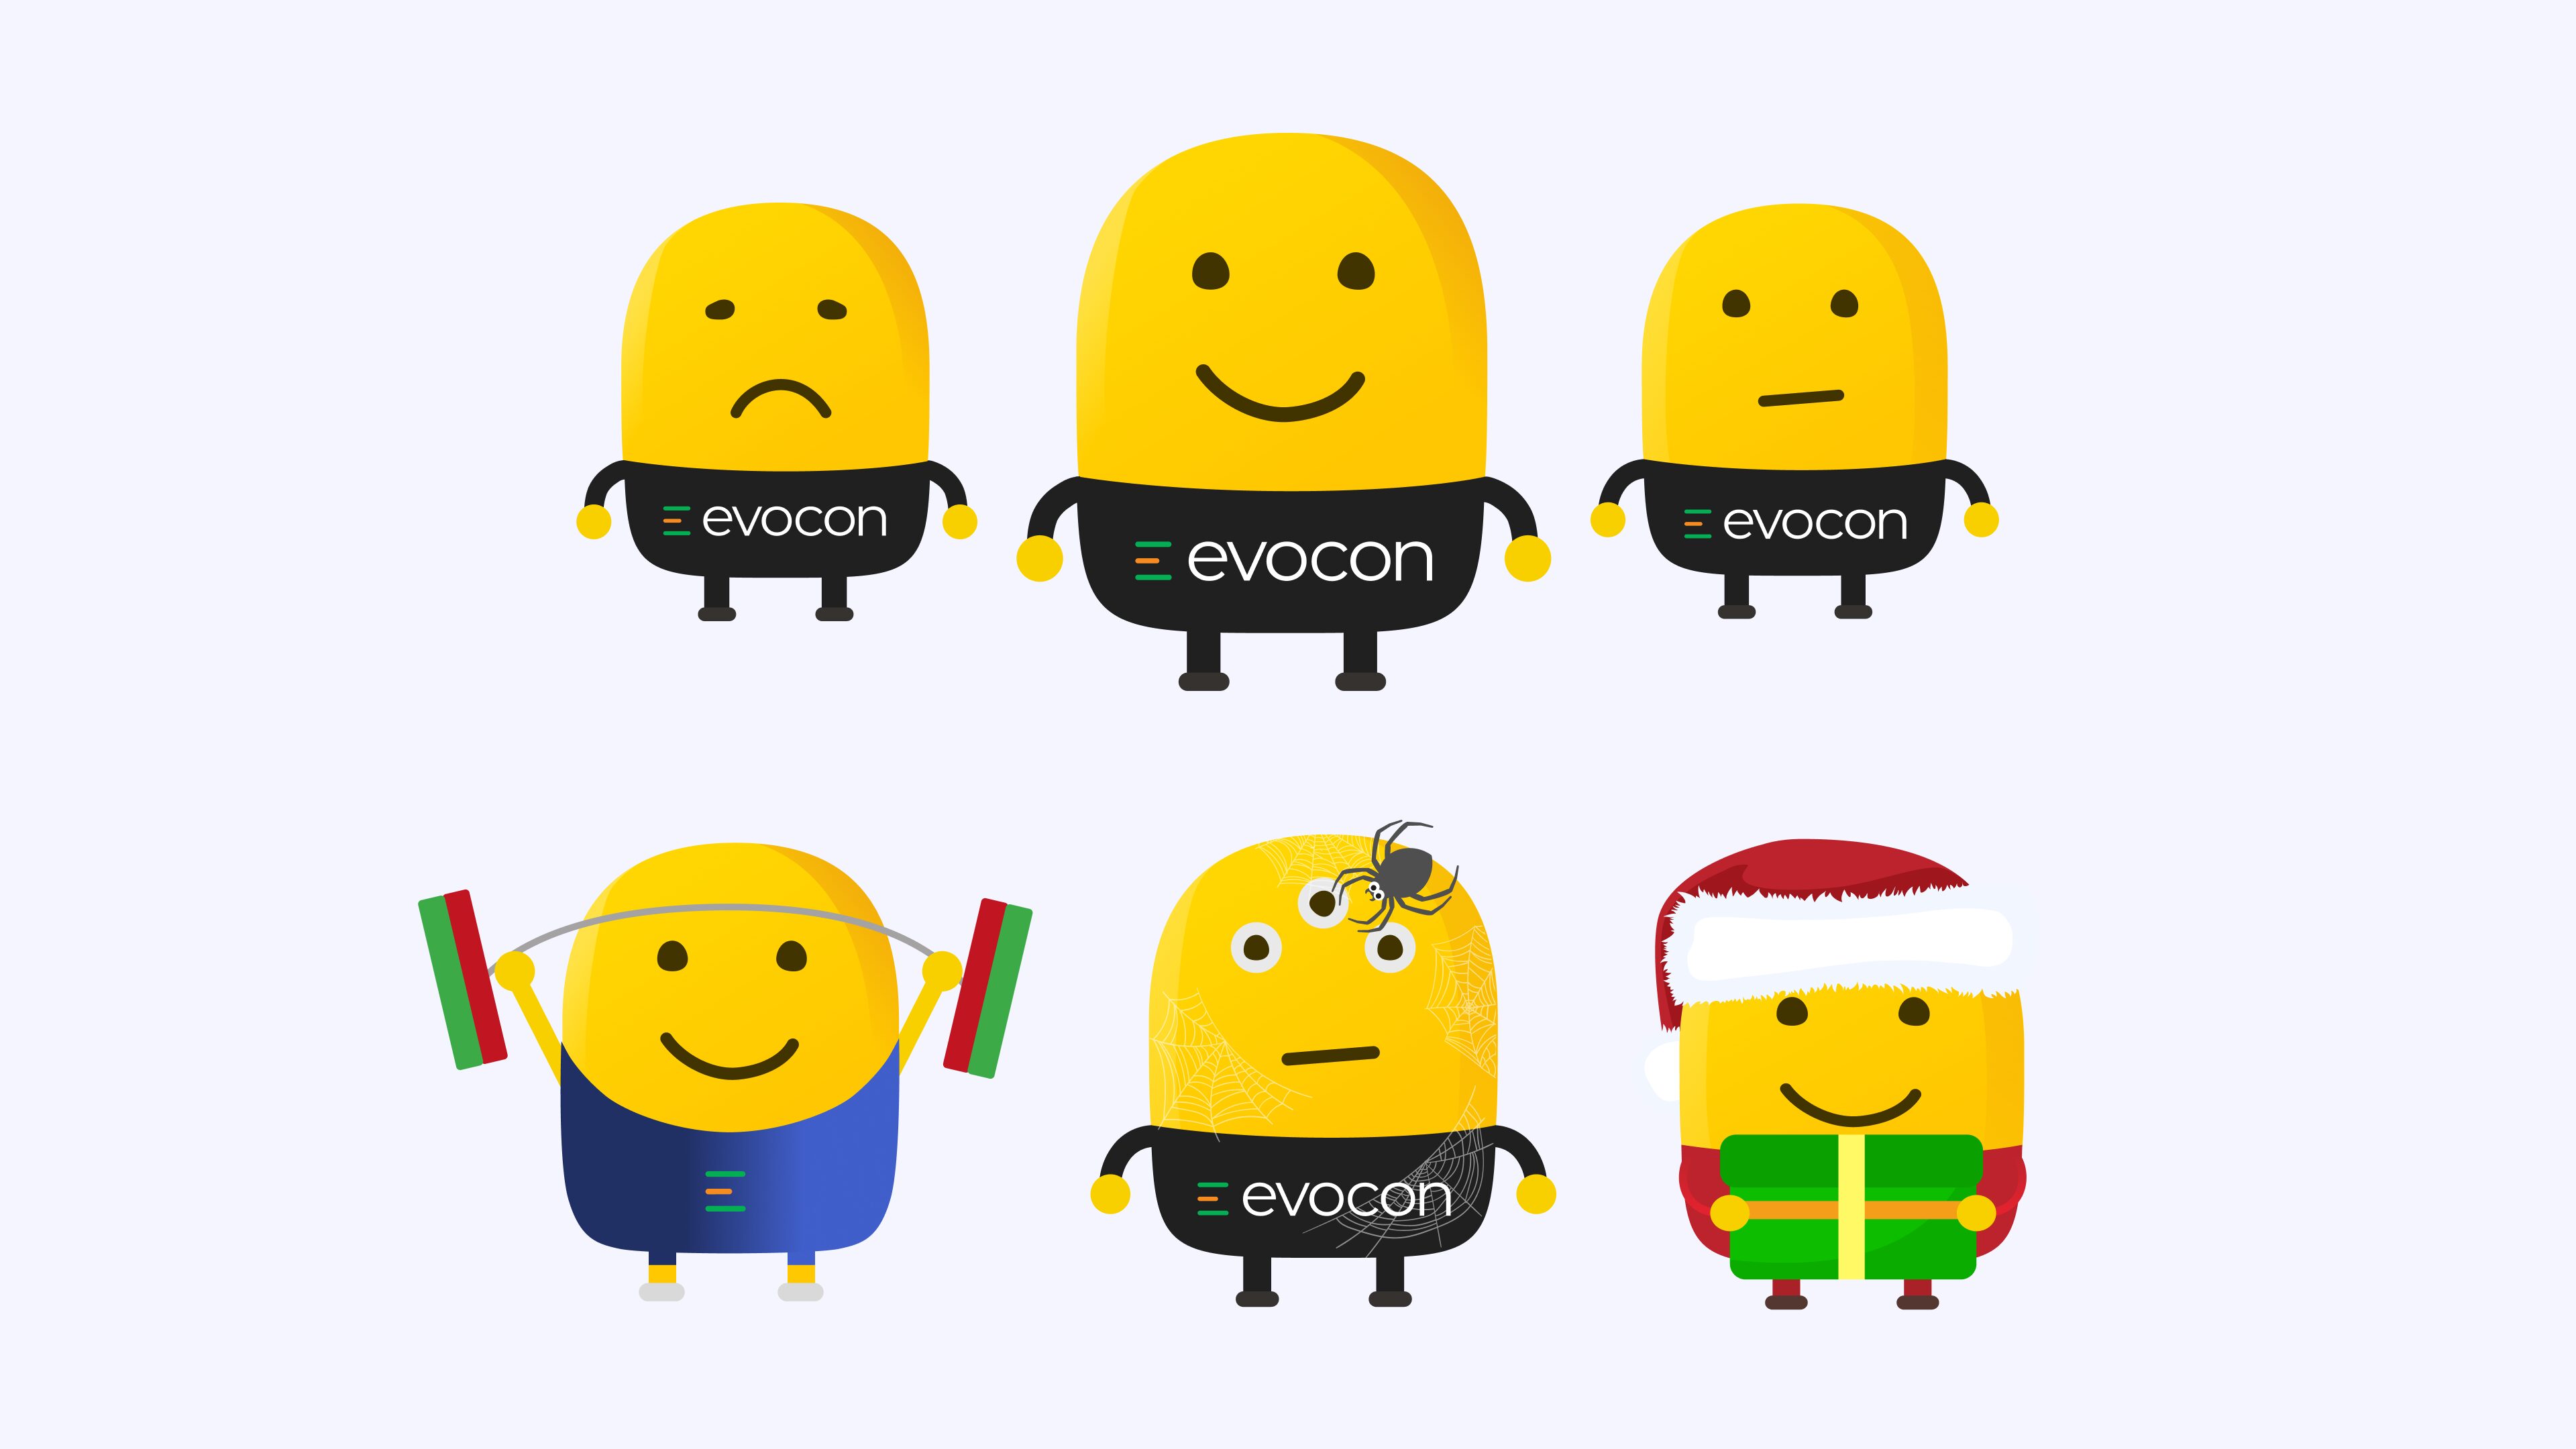
- Last but not least, Mr. Evocon is a symbol of how powerful and engaging visual tools can be. In addition to the practical purpose of indicating when OEE targets are reached or exceeded, he also takes on different outfits during different celebrations of the year, such as Christmas, Halloween, and Olympic events, giving your team a boost in positivity.

Key Takeaways
Now that we have discussed the benefits and evidence behind them and reviewed how to implement a visual factory, we can say that even small things can make a big difference.
The key is to follow the process: define your goals, choose a framework that supports these goals, and implement visual tools step-by-step.
OEE can play and important part during this journey. If you would like to know more about how to make OEE clear and visible throughout your factory, get in touch with us.