 Enterprise Package
  Integrations
  Security
  Hardware
 How Evocon Works
  OEE Monitoring
  Increasing Productivity
 OEE Calculator
  Evocon
  Join us
 In manufacturing, data is one of the most valuable raw materials today, and like any raw material, it is valuable only when processed effectively. Imagine analytics in manufacturing as a refinery that transforms the streams of data from machines and people into actionable intelligence that provides context for smarter and faster decision-making, and it does this in real-time.
In this article, we will go over the business use cases for analytics and examine how it can be practically applied to reduce costs, improve quality, optimize the supply chain, manage energy consumption, increase workforce retention, and even create new business models and products.
What is Analytics in Manufacturing?
Manufacturing analytics is the application of data analysis tools and techniques to the information generated within an industrial environment.
A helpful way to understand this is to think of the data coming from machines, systems, and people as raw material, where analytics acts as the refinery, using analytical tools to process this raw material into a finished product: actionable intelligence. The result is a complete, 360-degree view of operations.
How manufacturing analytics works
First, we collect data from multiple sources. On the shop floor, IIoT (Industrial Internet of Things) sensors on equipment provide operational data, from physical parameters like temperature or vibration to production data like product counts or scrap rates.
At the same time, business systems (such as ERP or MES) provide context: data on work orders, inventory, product specifications. In addition, direct input from operators and engineers should not be underestimated.
Finally, external data can be incorporated, such as supply chain disruptions, market trends, or even weather patterns, if they impact operations.
All of this data is sent to a central repository, typically a cloud platform, and aggregated into one unified dataset. Now, analytics software can process the data to identify patterns, predict events, or flag issues.
Key benefits of analytics in manufacturing
- Faster, better business decisions
- Improved operational performance and profit margins due to more uptime, higher productivity, savings on energy, labor and material costs.
- A more resilient and adaptable supply chain that can function despite disruptions, ensuring reliable delivery.
- New commercial growth due to accelerated product innovation and testing.
- Improved employee retention resulting from a safer environment where management proactively addresses hazards, and from the culture of transparency where having objective data reduces finger-pointing and encourages problem-solving.
Use Cases of Manufacturing Analytics
- Predictive maintenance: Use real-time data from equipment sensors to forecast failures before they happen, allowing for just-in-time maintenance that reduces unplanned downtime and optimizes repair costs.
- Quality control: Shift from reactive inspection to proactive prevention by using AI to analyze production data, identify potential quality issues in real-time, and limit the scale of product recalls.
- Production process improvement: Accelerate methodologies like Lean and Six Sigma by using automated, objective data to uncover hidden inefficiencies, track OEE, and create a data-driven culture focused on process improvement rather than blaming individuals.
- Supply chain optimization: Create end-to-end visibility by breaking down data silos, which enables more accurate demand forecasting, intelligent inventory optimization, and proactive risk management to build a more resilient supply network.
- Energy management: Move from passive savings to active optimization by using analytics to monitor energy consumption in real-time, identify waste, and make targeted adjustments to reduce costs and meet sustainability goals.
- Workforce management, safety, and productivity: Apply analytics to improve employee safety by identifying hazards with video and wearable sensors, improve morale by rectifying poor working conditions, and boost productivity by reducing idle time.
- New business models, price optimization, and data-driven product development: Connect operational data directly to commercial outcomes. This is done by enabling data-driven product development through simulation, optimizing pricing based on precise cost models, and creating new recurring revenue streams through Product-as-a-Service (PaaS) business models.
1. Predictive maintenance
Predictive Maintenance (PdM) is a proactive strategy that uses real-time data and advanced analytics to forecast equipment failures before they happen. Unlike reactive maintenance (fixing things after they break) or preventive maintenance (servicing equipment on a fixed schedule), PdM uses data from IIoT sensors to continuously monitor operational parameters like vibration, temperature, and pressure. Machine learning algorithms analyze this data to detect subtle signs of developing problems, predicting not only if a component will fail, but when. This allows maintenance to be performed at the optimal moment — before a breakdown occurs, but without the waste of premature intervention.
Key applications and benefits
- Prevent unscheduled downtime
By interpreting sensor data, manufacturers can get an advanced warning of a likely equipment failure and perform maintenance to keep production lines running on schedule.
- Optimize maintenance costs
PdM reduces costs by allowing technicians to perform repairs at the machine’s optimal time, stage the necessary parts, and avoid paying for unnecessary service on healthy equipment.
- Enhance safety
Predicting and preventing catastrophic equipment failures helps create a safer working environment for employees.
- Lower energy consumption
Equipment that is well-maintained runs more efficiently. Addressing issues like friction or misalignment before they become critical helps reduce the energy consumption of industrial assets.
👉 General Motors (Automotive): The company implemented a predictive maintenance (PdM) system that integrates Industrial Internet of Things (IIoT) sensors and AI/Machine Learning analytics to monitor the health of its assembly line robots. This proactive approach allows maintenance teams to address potential wear and tear before failures occur, resulting in a 15% reduction in unexpected downtime and $20 million in annual maintenance cost savings. The system is a key part of the company’s broader “Smart Maintenance” initiative, which uses real-time data and integration with its Enterprise Asset Management (EAM) system to optimize resource allocation — a strategy detailed in this article by the ARC Advisory Group.

2. Quality control
Traditional quality control in manufacturing relies on reactive methods like final inspections, which catch defects only after they have happened, leading to waste and rework. Manufacturing analytics shifts the focus from defect detection to defect prevention. This approach, often called predictive quality, uses AI and machine learning to analyze real-time data from the production line. By identifying patterns that signal a potential quality issue, manufacturers can take corrective action before a defect ever happens, improving overall product quality and reducing the risk of recalls.
Key Applications and Benefits
- Real-time quality monitoring
Using data from sensors to analyze the production process and detect anomalies that may indicate potential defects or quality issues.
- Automated visual inspection
Deploying advanced computer vision applications, including thermal and infrared detection, to automate quality control at high speeds and with greater precision than human inspection.
- Limiting product recalls
When a quality problem does occur, analytics helps manufacturers identify exactly which production line, piece of equipment, and time frame were affected. This allows them to recall only specific product batches rather than entire shipments.
- Analyzing customer feedback
Analytics can also be used to understand customer buying habits and analyze feedback on existing products. This data can then be used to optimize future products and reduce components or processes that lead to higher warranty claims or complaints.
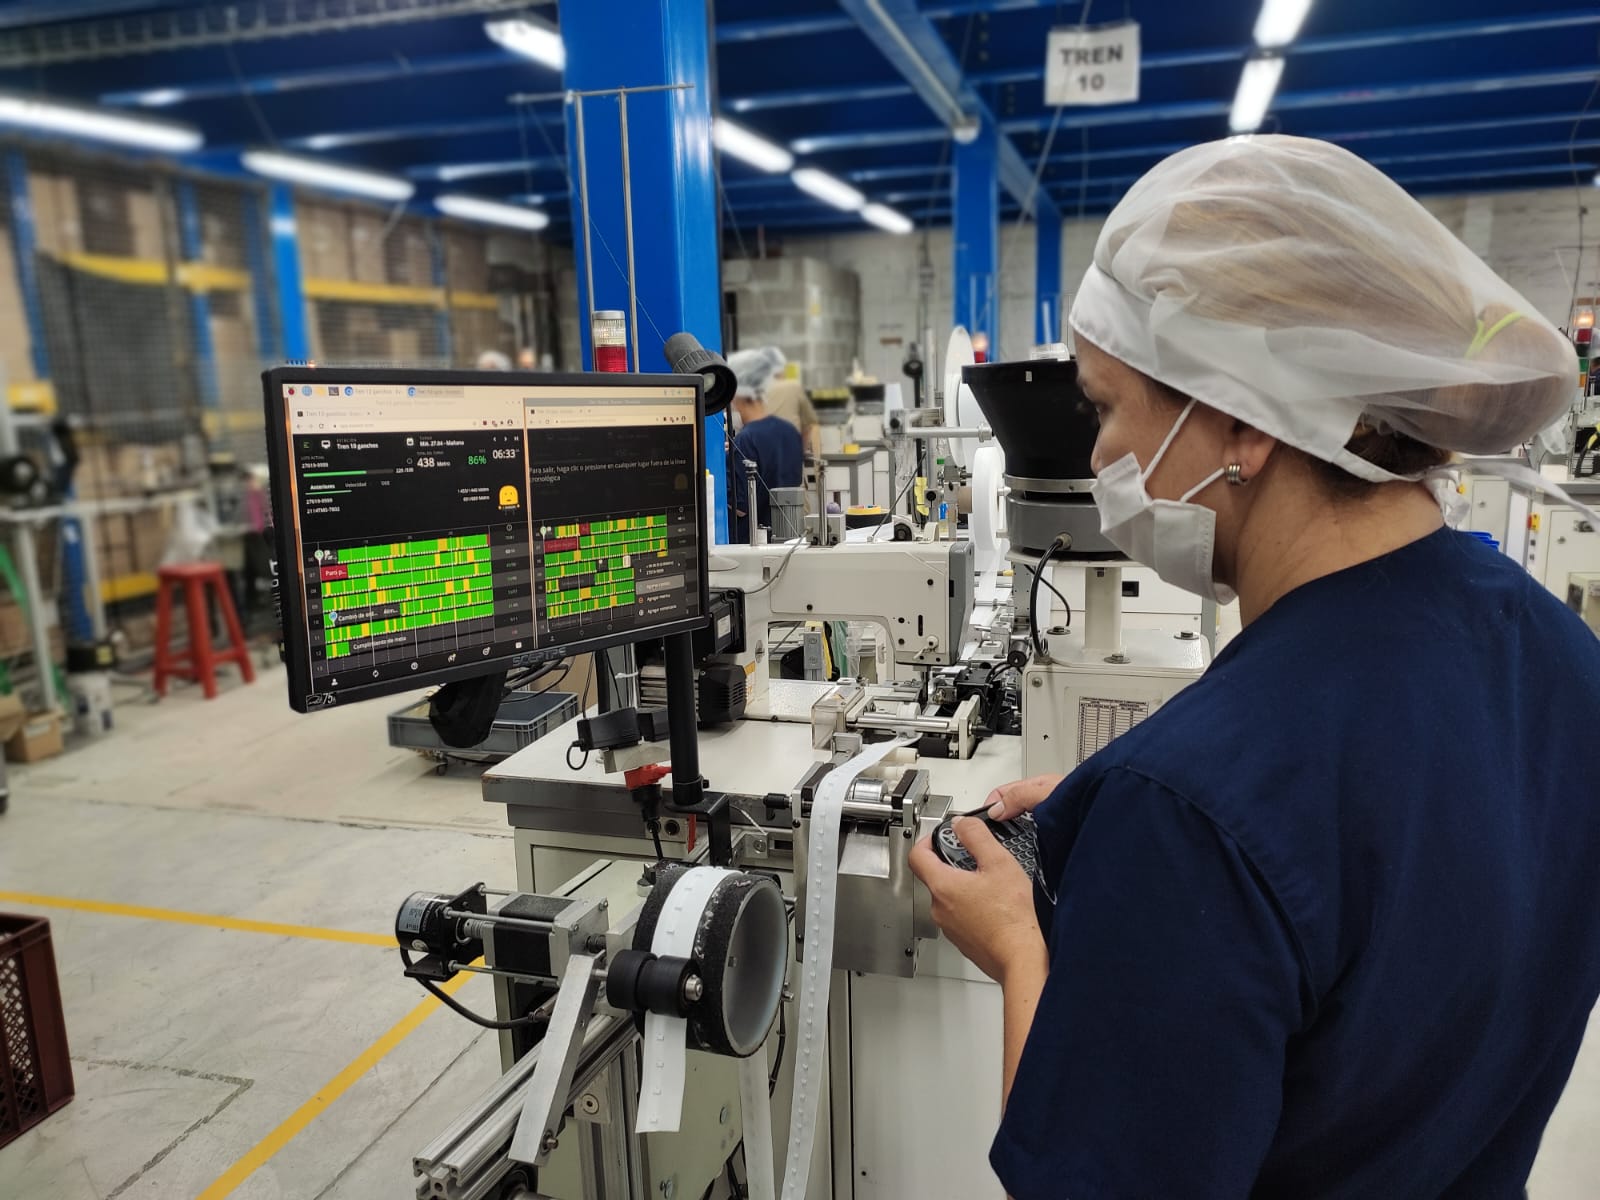
👉 Chala (garment accessories): This producer of fasteners and straps struggled with an inefficient and inaccurate manual quality control process that led to significant waste. By implementing Evocon’s digital checklist feature, they were able to trigger quality checks on each machine after a much smaller batch of product was made. This shift from a delayed, paper-based system to real-time, targeted checks helped Chala reduce potential scrap by three times and deliver improved quality to its customers.
3. Production process improvement
For decades, manufacturers have used methodologies like Lean Manufacturing and Six Sigma to improve operations. However, these efforts were often limited by manual data collection, which can be time-consuming and inaccurate. Manufacturing analytics accelerates these improvements by replacing manual observation with automated, accurate, and detailed data streams. A dedicated production monitoring solution, such as Evocon, can capture the activity of every station, batch, and production stop, creating an objective digital record of the entire production process. This provides the precise evidence needed to execute improvement frameworks with greater speed and accuracy.
Key applications and benefits
- Uncovering hidden inefficiencies
Analytics can identify the root causes of lost production that are often invisible to the naked eye. A dashboard might reveal that low equipment availability is not due to major breakdowns but to frequent, short “micro-stoppages” on a particular machine, pointing engineers to a specific, fixable problem.
- Improving OEE
Analytics platforms provide real-time, granular data on Overall Equipment Effectiveness (OEE) — a key metric combining equipment availability, performance, and quality. This allows managers to see exactly where and why production losses are occurring. Some organizations that implement tracking like this have seen OEE improvements of 20-30%.
- Prioritizing work orders
By comparing work orders, sales orders, and real-time inventory levels, supervisors can determine which projects to prioritize to optimize for business impact rather than simply following a first-in-first-out sequence. For example, a plant manager might decide to run a more recent but high-value work order for a premium customer first.
- Creating a data-driven culture
By providing a single source of truth, analytics depersonalizes problem-solving. The focus shifts from asking “who is to blame?” to “what does the data show?”, creating a more collaborative environment where teams work to fix the process, not blame the person.
👉 Nova Packaging began its journey by implementing a system to visualize production and monitor Overall Equipment Effectiveness (OEE) in real-time. However, the benefits quickly expanded beyond simple performance tracking and had a profound impact on fostering a data-driven culture. The new, transparent platform broke down the information silos that had previously existed, creating a single source of truth that enabled different departments to collaborate effectively and speak the same language.
“Every department and every chief had their own reports. We didn’t have something neutral, something common to speak the same language, and that’s one of the huge benefits of Evocon.”
— Vasilis Anastadiasis, Deputy Production Manager, Nova Packaging
4. Supply chain optimization
Modern supply chains are complex global networks, but they are often hindered by data that is spread across different systems. This creates poor visibility and leads to reactive, inefficient decision-making. Manufacturing analytics breaks down these data silos, creating a unified “control tower” that provides end-to-end visibility of the entire value chain. This holistic view enables proactive management, allowing manufacturers to anticipate issues and optimize the flow of materials from suppliers to customers.
Key applications and benefits
- Demand forecasting
Instead of relying only on historical sales, advanced analytics uses AI and machine learning to generate highly accurate demand predictions. These models can incorporate various inputs, including market trends, economic indicators, and even weather patterns. According to McKinsey & Company, companies using these methods have improved forecasting accuracy by as much as 85%.
- Inventory optimization
Accurate forecasting is essential for intelligent inventory management. Analytics enables a dynamic model that optimizes inventory levels by balancing predicted demand against supplier lead times and reliability, minimizing carrying costs while preventing stockouts.
- Logistics and transportation analytics
By analyzing shipping data, traffic patterns, and carrier performance, manufacturers can optimize transportation routes, improve truck load planning, and reduce overall freight costs.
- Supplier performance tracking
Analytics allows manufacturers to identify which suppliers consistently deliver parts or raw materials on time. It can also be used to monitor the quality of suppliers’ products and their compliance with labor and environmental standards.
- Building resilience
A By analyzing external data on potential disruptions — such as port congestion, geopolitical risks, or natural disasters — companies can proactively mitigate risk by adjusting sourcing strategies or securing alternative transportation routes.
👉 Bonnell Aluminum (Custom Aluminum): With 80% of its business in custom manufacturing, Bonnell Aluminum struggled to meet delivery schedules due to disparate data across its five plants. This lack of unified information made it impossible to accurately track material shortages or effectively prioritize customer orders. By implementing a new cloud-based ERP and analytics platform, the company connected crucial data across its enterprise, providing the visibility needed to make better purchasing and inventory decisions. This transformation, detailed in an Oracle customer success story, allowed Bonnell to better meet the precise demands of its custom business.
5. Energy management
With rising energy costs and increasing pressure to meet sustainability goals, energy management has become a critical focus for manufacturers. Analytics provides the tools to move from passive energy-saving measures to active, data-driven optimization. By deploying sensors and integrating data from utility meters and building management systems, companies can monitor energy consumption in real-time, identify waste patterns, and predict future energy loads.

Key applications and benefits
- Real-time monitoring
By deploying sensors and integrating data from utility meters, companies can monitor energy consumption in real-time to identify patterns of waste.
- Cost reduction
A targeted, analytics-driven approach can significantly reduce overall energy consumption, resulting in cost savings and a smaller carbon footprint.
- Process optimization
Analytics can identify major inefficiencies in energy-intensive processes, allowing for targeted adjustments to be made.
- Sustainability and compliance
Data-driven energy management is a cornerstone of modern sustainability initiatives, helping manufacturers meet their ESG (Environmental, Social, and Governance) goals.
👉 An academic paper published in the International Journal of Energy Engineering offers a peer-reviewed case study of an unnamed (due to confidentiality) industrial pharmaceutical site in France. This facility faced significant energy consumption from its HVAC systems, which were responsible for 57% of its electrical emissions. They implemented a four-step methodology involving energy audits and real-time performance monitoring. By strategically reducing air quantities, optimizing treatment periods, and improving system design and management, they achieved a 24% reduction in HVAC-related carbon emissions within three years without compromising critical operational standards. For full details, download the paper as a PDF.
6. Workforce management, safety, and productivity
Beyond machines and processes, analytics is being applied to enhance the safety, productivity, and retention of the human workforce. By analyzing data from sources like video cameras, wearable sensors, and machinery logs, companies can proactively identify and mitigate workplace hazards before they lead to accidents.
Key applications and benefits
- Improving workplace safety
AI-powered video analytics can monitor work areas for unsafe behaviors, while wearable sensors can track ergonomic strain and exposure to environmental risks. This allows for real-time hazard detection and intervention.
- Boosting employee productivity
Analytics helps reduce unscheduled downtime, ensuring that production workers are rarely idle. It can also be used to adjust processes, such as shifting start and end times to coincide with materials delivery windows or other external factors.
- Reducing employee attrition
By identifying and rectifying difficult working conditions, overly long work shifts, or safety hazards, analytics can help improve employee morale and tenure.
- Optimizing talent
Analytics can help manufacturers identify employees with skills other than the ones they use for a given position. This allows for effective reassignment to different areas of the business, helping employees advance their careers and better utilize the company’s human capital.
👉 Mohammed Mouni, an Evocon partner and the founder of Beyond 4.0, applied computer vision to improve workplace safety in some of the factories he worked with. The goal was to ensure that workers consistently wore personal protective equipment (PPE), such as helmets or proper footwear, in designated zones. He implemented a solution that used cameras connected to a computer vision platform (Kibsi). It detected safety violations in real-time and sent alerts to supervisors, making it possible to intervene and prevent potential accidents.

7. New business models, price optimization, data-driven product development
The most advanced analytics strategies connect operational data directly to commercial outcomes, creating new revenue streams and competitive advantages that go beyond the factory floor. This allows manufacturers to optimize pricing, create new service-based offerings, and accelerate product innovation.
Key applications and benefits
- Price optimization
By understanding the precise cycle times and associated costs for creating parts, manufacturers can build highly accurate cost models. This data enables pricing strategies that are optimized to maximize profitability without suppressing customer demand.
- New business models, such as Product-as-a-Service (PaaS)
Analytics is the engine behind a strategic shift from selling products to selling outcomes or services. Instead of a one-time sale, manufacturers can offer a PaaS model, which creates recurring revenue streams and builds long-term customer relationships. For example, an airplane engine manufacturer might charge airlines based on the number of hours an engine flies without issues, or a medical equipment maker could charge a hospital on a usage basis, guaranteeing uptime in exchange for ongoing service fees.
- Data-driven product development
Analytics transforms the research and development process. Using “digital twins” and other modeling methods, companies can simulate how a product will perform under real-world conditions, reducing R&D costs and the need for excessive physical prototyping. Furthermore, by analyzing customer usage data, warranty information, and performance metrics from products already in the field, companies can develop new product lines that proactively address previous complaints and issues. This creates a feedback loop that links the customer experience directly to the innovation cycle.
👉 Rolls-Royce (Aerospace): Rolls-Royce provides a clear example of integrating operational data with commercial outcomes through several advanced analytics strategies.
For data-driven product development, the company uses digital twins — virtual replicas of its engines that learn from real-time sensor data. These simulations are used to predict performance, optimize testing, and reduce costly physical prototyping, which in turn enhances aviation.
In a Product-as-a-Service (PaaS) model, the company pioneered its TotalCare® program, where airlines are charged a fixed rate per flying hour. This transfers the maintenance risk to Rolls-Royce, aligning incentives on engine reliability and maximizing availability for the airline. This data-driven service model is highly successful, with around 90% of newer engines under TotalCare contracts.
Common Challenges
While the benefits of manufacturing analytics are significant, successful implementation involves navigating several common challenges. These hurdles are not just technical but are also rooted in data management practices and company culture.
Data silos
In most manufacturing environments, data is split across numerous, disconnected systems like ERP, MES, and PLM. This isolation makes it hard to get a complete view of operations, which is necessary for effective analysis.
To overcome this, organizations must develop a centralized data architecture, such as a data warehouse or data lake. This involves implementing robust data integration processes to unify information from different sources into a cohesive and accessible system.
Integrating legacy systems
Many factories operate with a mix of modern and legacy equipment — a “brownfield” environment where older machines often lack the digital connectivity needed for modern data collection. However, a complete overhaul is often unnecessary and expensive. The practical solution is to retrofit these legacy assets with modern IIoT sensors and use flexible data integration platforms to unlock significant value from existing infrastructure.
👉 A clear example of this is CHB Group, a Greek food processor, who needed to improve the performance of a can seamer that was over 50 years old. Instead of a costly replacement, they retrofitted the machine with Evocon’s IIoT device for automated data collection and a tablet for data visualization. This straightforward solution gave operators and managers real-time access to OEE data, production counts, and reasons for stops. It proves that even decades-old machinery can be integrated into a modern analytics system, enabling the company to diagnose issues and process fresh products efficiently.

Lack of skilled workforce
The demand for professionals with skills in data science, statistics, and machine learning often outstrips the available supply. Many manufacturing companies struggle to find and retain the talent needed to build and manage analytics systems.
To address this, companies should adopt a multi-pronged talent strategy. This includes targeted hiring and investing heavily in upskilling and reskilling the existing workforce. The adoption of no-code and low-code machine learning platforms can also empower existing employees to contribute to analytics initiatives without formal data science backgrounds.
Cultural resistance to change
One of the most significant hurdles in applying analytics is cultural resistance from employees who may be skeptical of new, data-driven approaches. Overcoming this requires strong leadership and framing the change as a benefit to the operators themselves. When new systems are user-friendly and clearly designed to help employees solve problems rather than just monitor them, potential skepticism can be turned into active engagement.
👉 A practical example of this is the case of H+H, a building materials provider. When introducing a new OEE monitoring system, management emphasized to their operators that the tool was there to help them. By engaging the team directly and implementing a user-friendly tool to identify and prove production issues, the company fostered a sense of ownership. This bottom-up approach, where operators saw the immediate benefits, was key to the successful adoption of the new system.
How to Implement Data Analytics in Manufacturing
Successfully implementing manufacturing analytics is a strategic business transformation, not a simple IT project. It’s a journey that methodically builds a company’s capability to turn data from all corners of the enterprise into a powerful asset.
Step 1: Define business objectives
Before starting, define your most important business goals. Focus on clear outcomes that range from high-level strategic targets to more focused operational goals. For example, a strategic goal might be to build a more resilient and agile supply chain, while a more focused goal could be to optimize end-to-end production costs. Choosing a few key goals gives your project a clear purpose.
Step 2: Audit data and systems
Next, map all the data sources you need. Find where important information is stored, including operational systems, enterprise systems, legacy assets, and external sources.
Step 3: Design the data architecture
To connect your data, design a central system, like a data warehouse or data lake. Your goal is to create a single source of truth. This platform must be scalable enough to support not just your initial use cases, but also future analytics initiatives. Also, create data governance rules for quality, access, and security to make sure the data is reliable.
Step 4: Integrate and contextualize data
Connect your data sources to the central system and automate the data flow. As data comes in, it must be contextualized. This means adding details from other systems. For example, a temperature reading is linked to the product batch and quality specs, giving it useful meaning. Or, an old machine, retrofitted with modern sensors and an IIoT device, is connected to your ERP system, so that production is automatically connected to orders and their associated costs. The goal is to break down the data silos.
Step 5: Analyze data for insights
With your data system ready, start analyzing. Use descriptive analytics and dashboards to get a clear view of operations, tracking KPIs like OEE, throughput, lead time, and others. The real value, however, comes from analyzing the connections between these data sources. For example, you can now see not just that OEE is low, but that it drops specifically for one product when using materials from a certain supplier. This deeper insight allows you to find root causes that were previously hidden in separate systems.
Step 6: Use predictive and prescriptive pnalytics
Once your team is ready, move from understanding past events to predicting future ones. Use historical data to train machine learning models for tasks like predictive maintenance. The next step is prescriptive analytics, which uses these predictions to recommend actions, like the best machine settings for quality and output.
Step 7: Create a data-driven culture
Technology alone does not create transformation. To succeed, make analytics a part of how your company works. Give everyone easy-to-use tools that help them make better decisions. This creates a feedback loop: insights lead to actions, results are measured, and new insights are found. Making this loop part of daily work makes your company truly data-driven.
Key Takeaways
As we wrote this article, we have taken the practical angle of focusing on business applications and examples of data analytics in manufacturing. We have examined how companies worldwide improve everything from equipment maintenance and product quality to energy management and commercial strategy. We also addressed the common challenges, such as integrating legacy systems, encouraging a data-driven culture, and provided a step-by-step implementation framework.
The applications detailed throughout this article demonstrate a clear and consistent pattern: when data is treated as a strategic asset, it creates tangible value. Whether it is used to predict a machine failure, prevent a quality defect, or reroute a shipment to avoid a disruption, analytics transforms information into a powerful tool for building a more efficient and resilient operation. For manufacturing leaders, the mission is to continuously improve their ability to refine raw data into the insights that will protect their business today and define their success tomorrow.