Enterprise Package
  Integrations
  Security
  Hardware
 How Evocon Works
  OEE Monitoring
  Increasing Productivity
 OEE Calculator
  Evocon
  Join us
 Production monitoring is the systematic observation, tracking, and analysis of manufacturing processes, covering everything from machine uptime to energy consumption. This article offers a comprehensive overview, detailing the strategic, tactical, and operational benefits of this practice. We’ll walk through a step-by-step implementation approach with concrete examples, and conclude with a bonus section outlining the future of production monitoring in manufacturing.
What Is Production Monitoring?
Production monitoring is the systematic observation, tracking, and analysis of manufacturing processes.
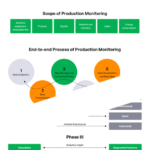
Full scope of production monitoring
Here is everything that can be tracked in a production environment:
- Machine/equipment/production line monitoring
Uptime, downtime, idle time, cycle time, speed, output rate vs. target, sensor data, and maintenance schedules - Process monitoring
Jobs/orders moving through different stages and critical process settings (oven temperature, conveyor speed, or pressure in a mold) - Quality monitoring
Defects (scrap), their types and rates, and pass/fail data from inspections - Material and inventory monitoring
Raw material usage per job or unit, and inventory levels between stages - Labor monitoring
Time spent on specific tasks or machines - Energy consumption monitoring
Energy usage per machine, line, or shift
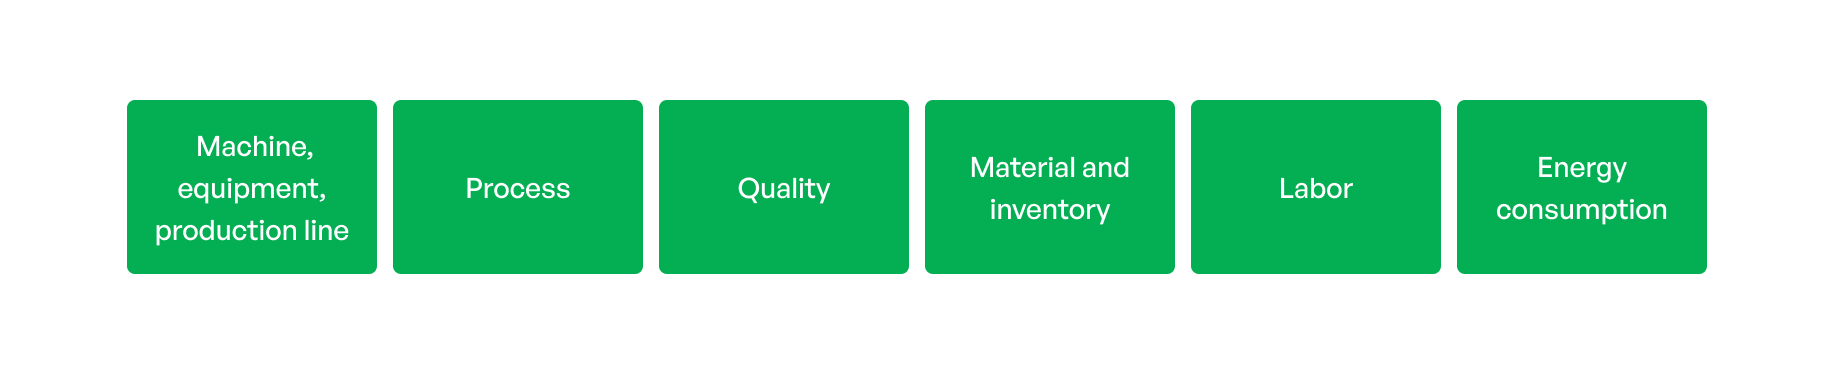
End-to-end process of production monitoring
- Data collection
Gathering raw data using sensors, PLC I/O or data protocols, barcode scanners, terminals for operator input, connections to other business systems – see our complete guide to manufacturing data collection - Data transmission
Moving data towards processing and storage using networks, wireless technologies, or even manual transfer - Data storage and contextualization
Storing unprocessed data in databases and adding context, for example, linking temperature recording to a specific machine, batch number, product, and timestamp - Data processing and analysis
Transforming data into meaningful information using calculations (i.e., OEE calculation), running statistical analyses, identifying trends, comparing performance against targets or standards, or using machine learning algorithms (see our article dedicated to data analytics in manufacturing) - Data visualization and reporting
Presenting information through real-time dashboards, historical reports, email/SMS alerts, and visual controls on the shop floor - Decision-making and action
Adjustments by the operators and supervisors on the shop floor, improving processes, allocating resources, and making strategic choices about capacity or investments
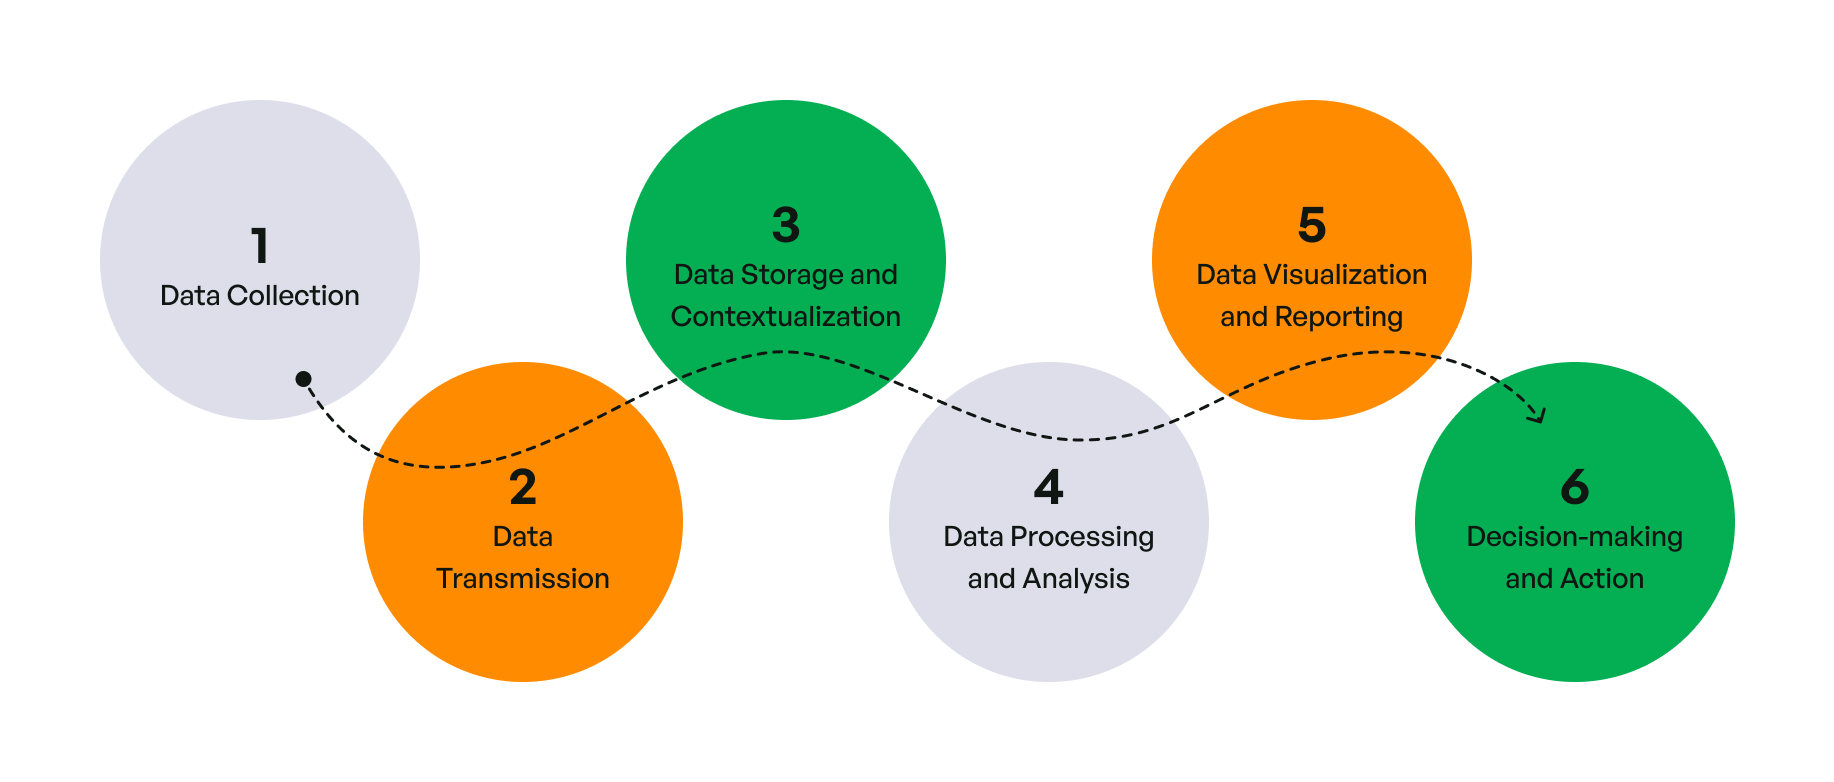
Example: How Evocon Monitors Production
Even though there are multiple ways Evocon can track production, let’s look at one specific example.
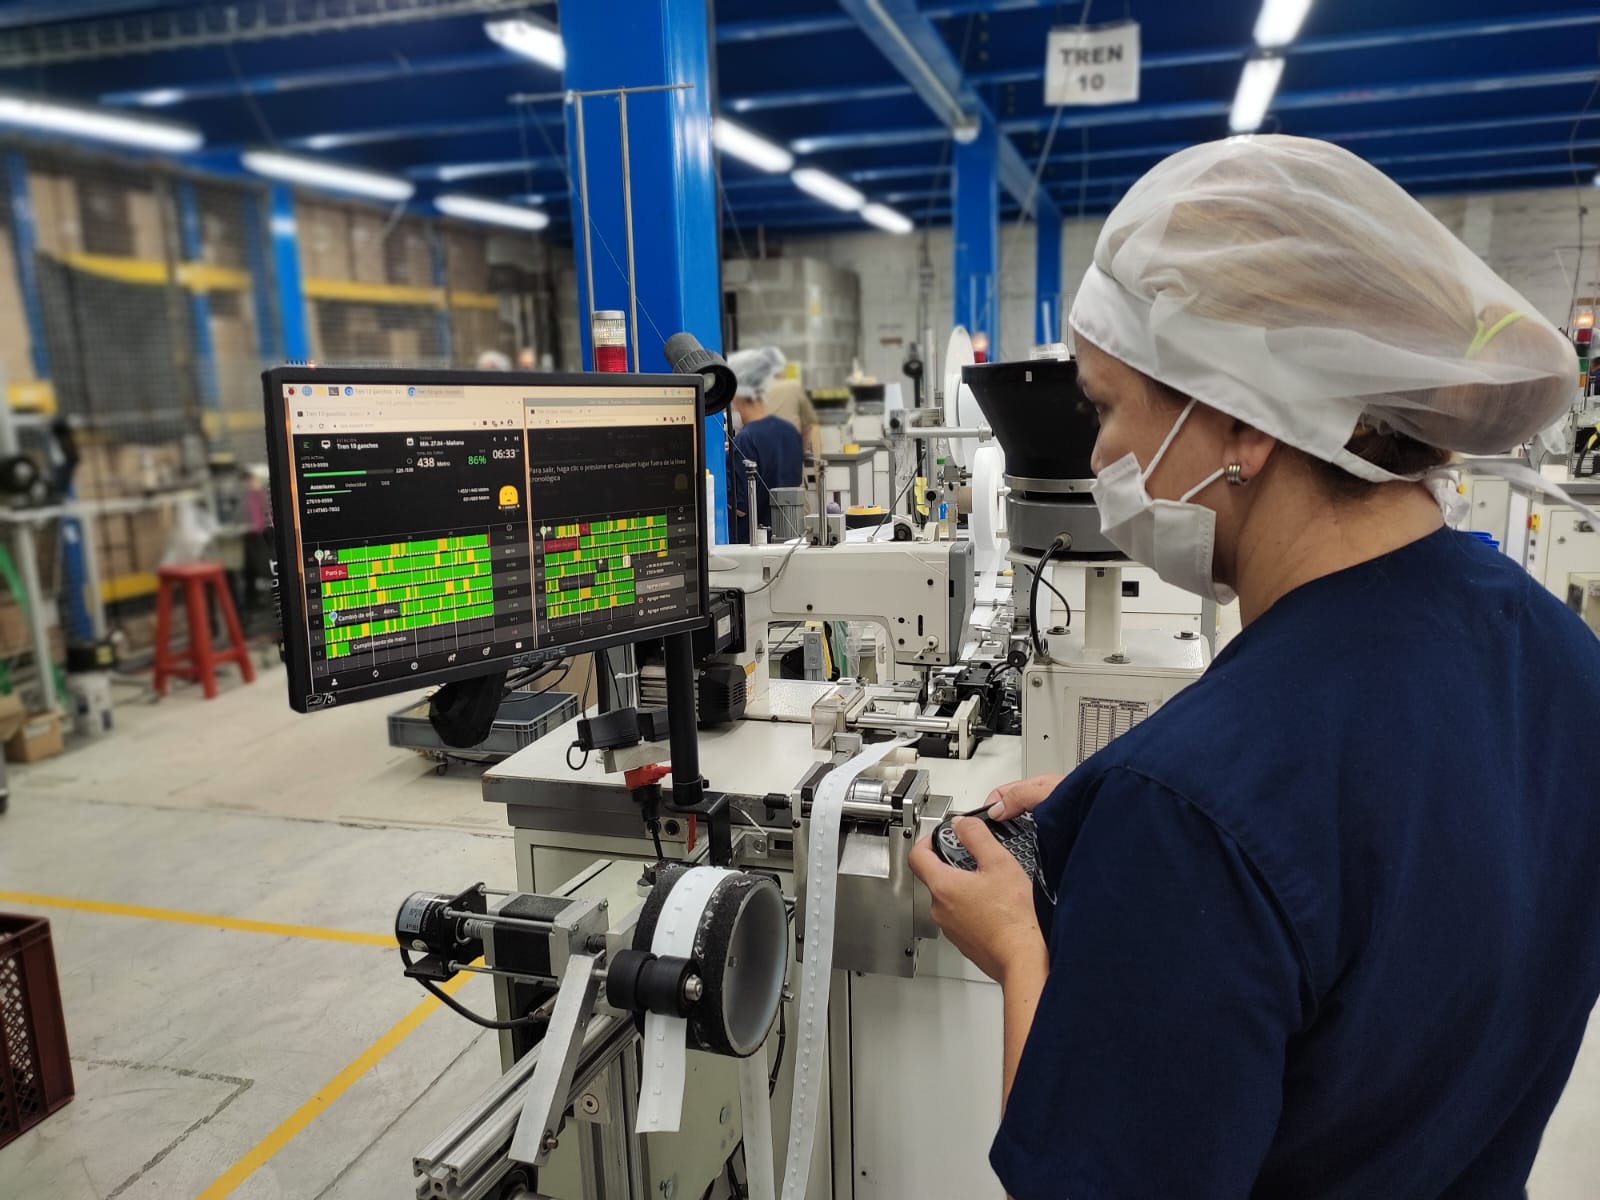
- Data collection:
A manufacturer fastens an optical sensor on the production line which counts individual products passing through. Information about batches and production targets comes from their ERP system. Beside the line is a display and keyboard for operators to enter downtime reasons when downtime happens and when a quality check is due. - Data transmission:
Signals from the sensor are pre-processed and sent to Amazon AWS along with extra information entered by operators.
- Data storage and contextualization:
Signal data, batch information, downtime reasons, and quality check results are stored and interlinked. - Data processing and analysis:
Evocon manufacturing data collection software calculates OEE, tracks progress toward production targets, and measures quality check success rate, production capacity, and more.
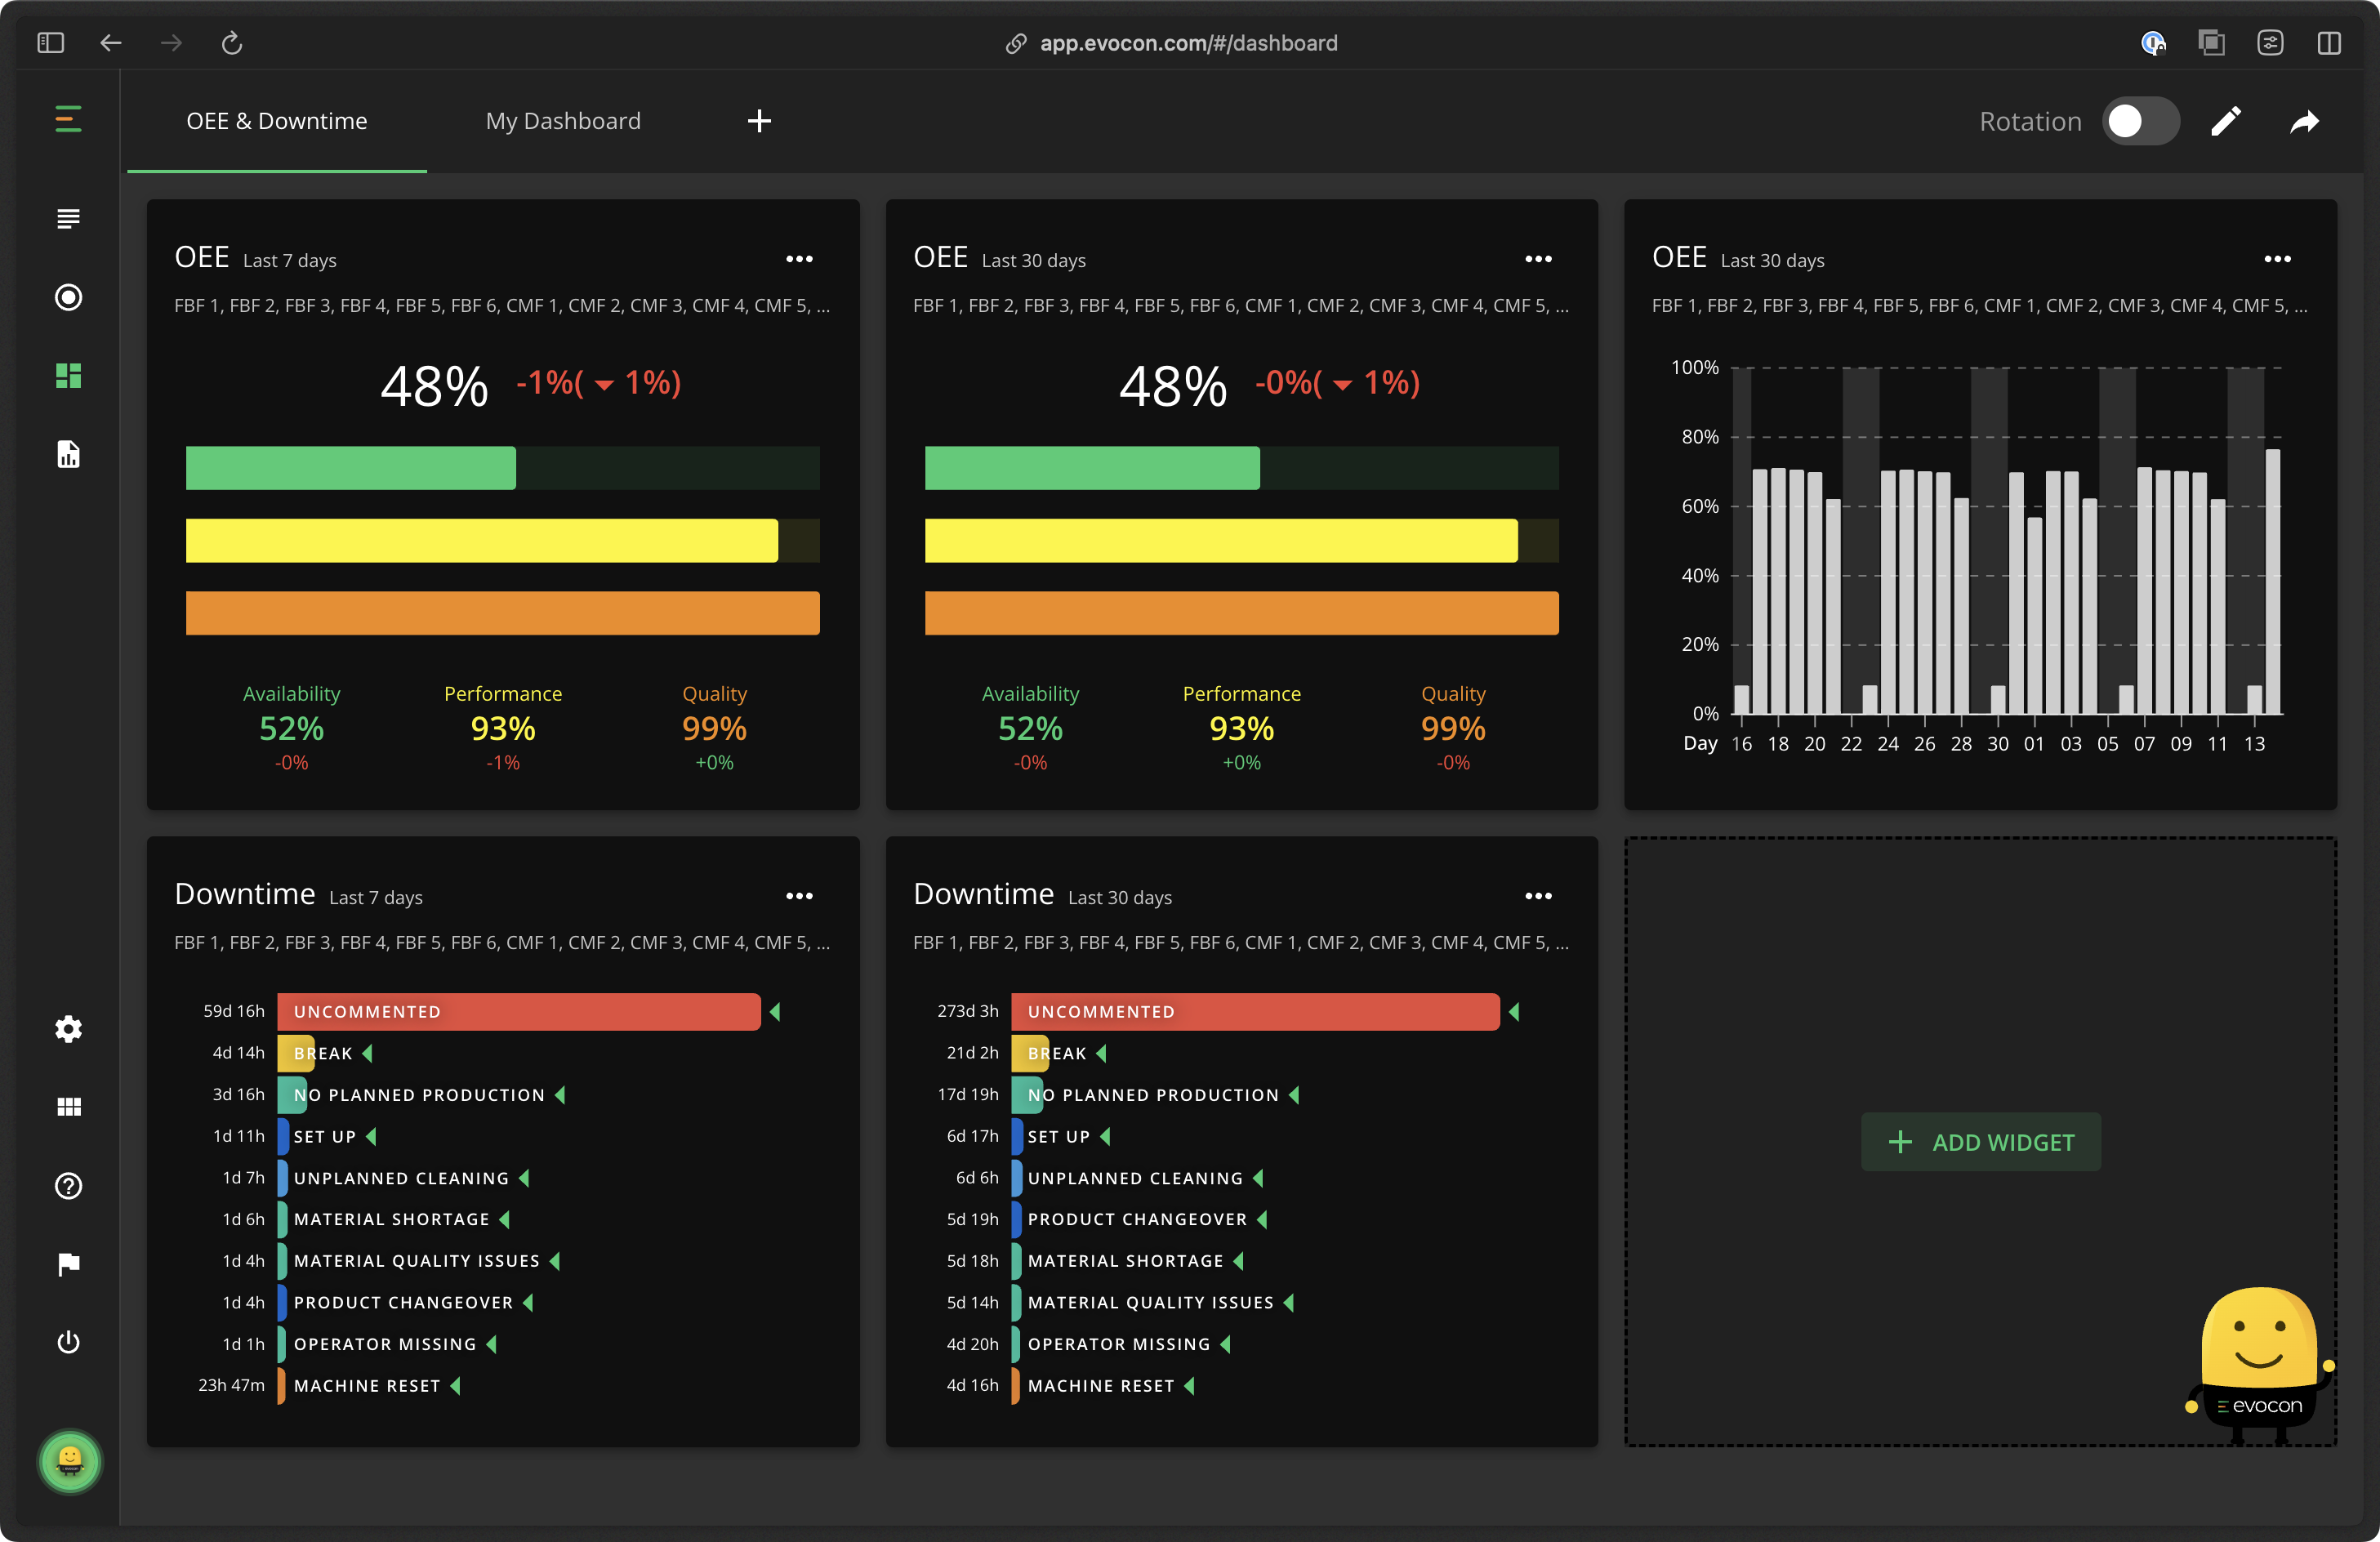
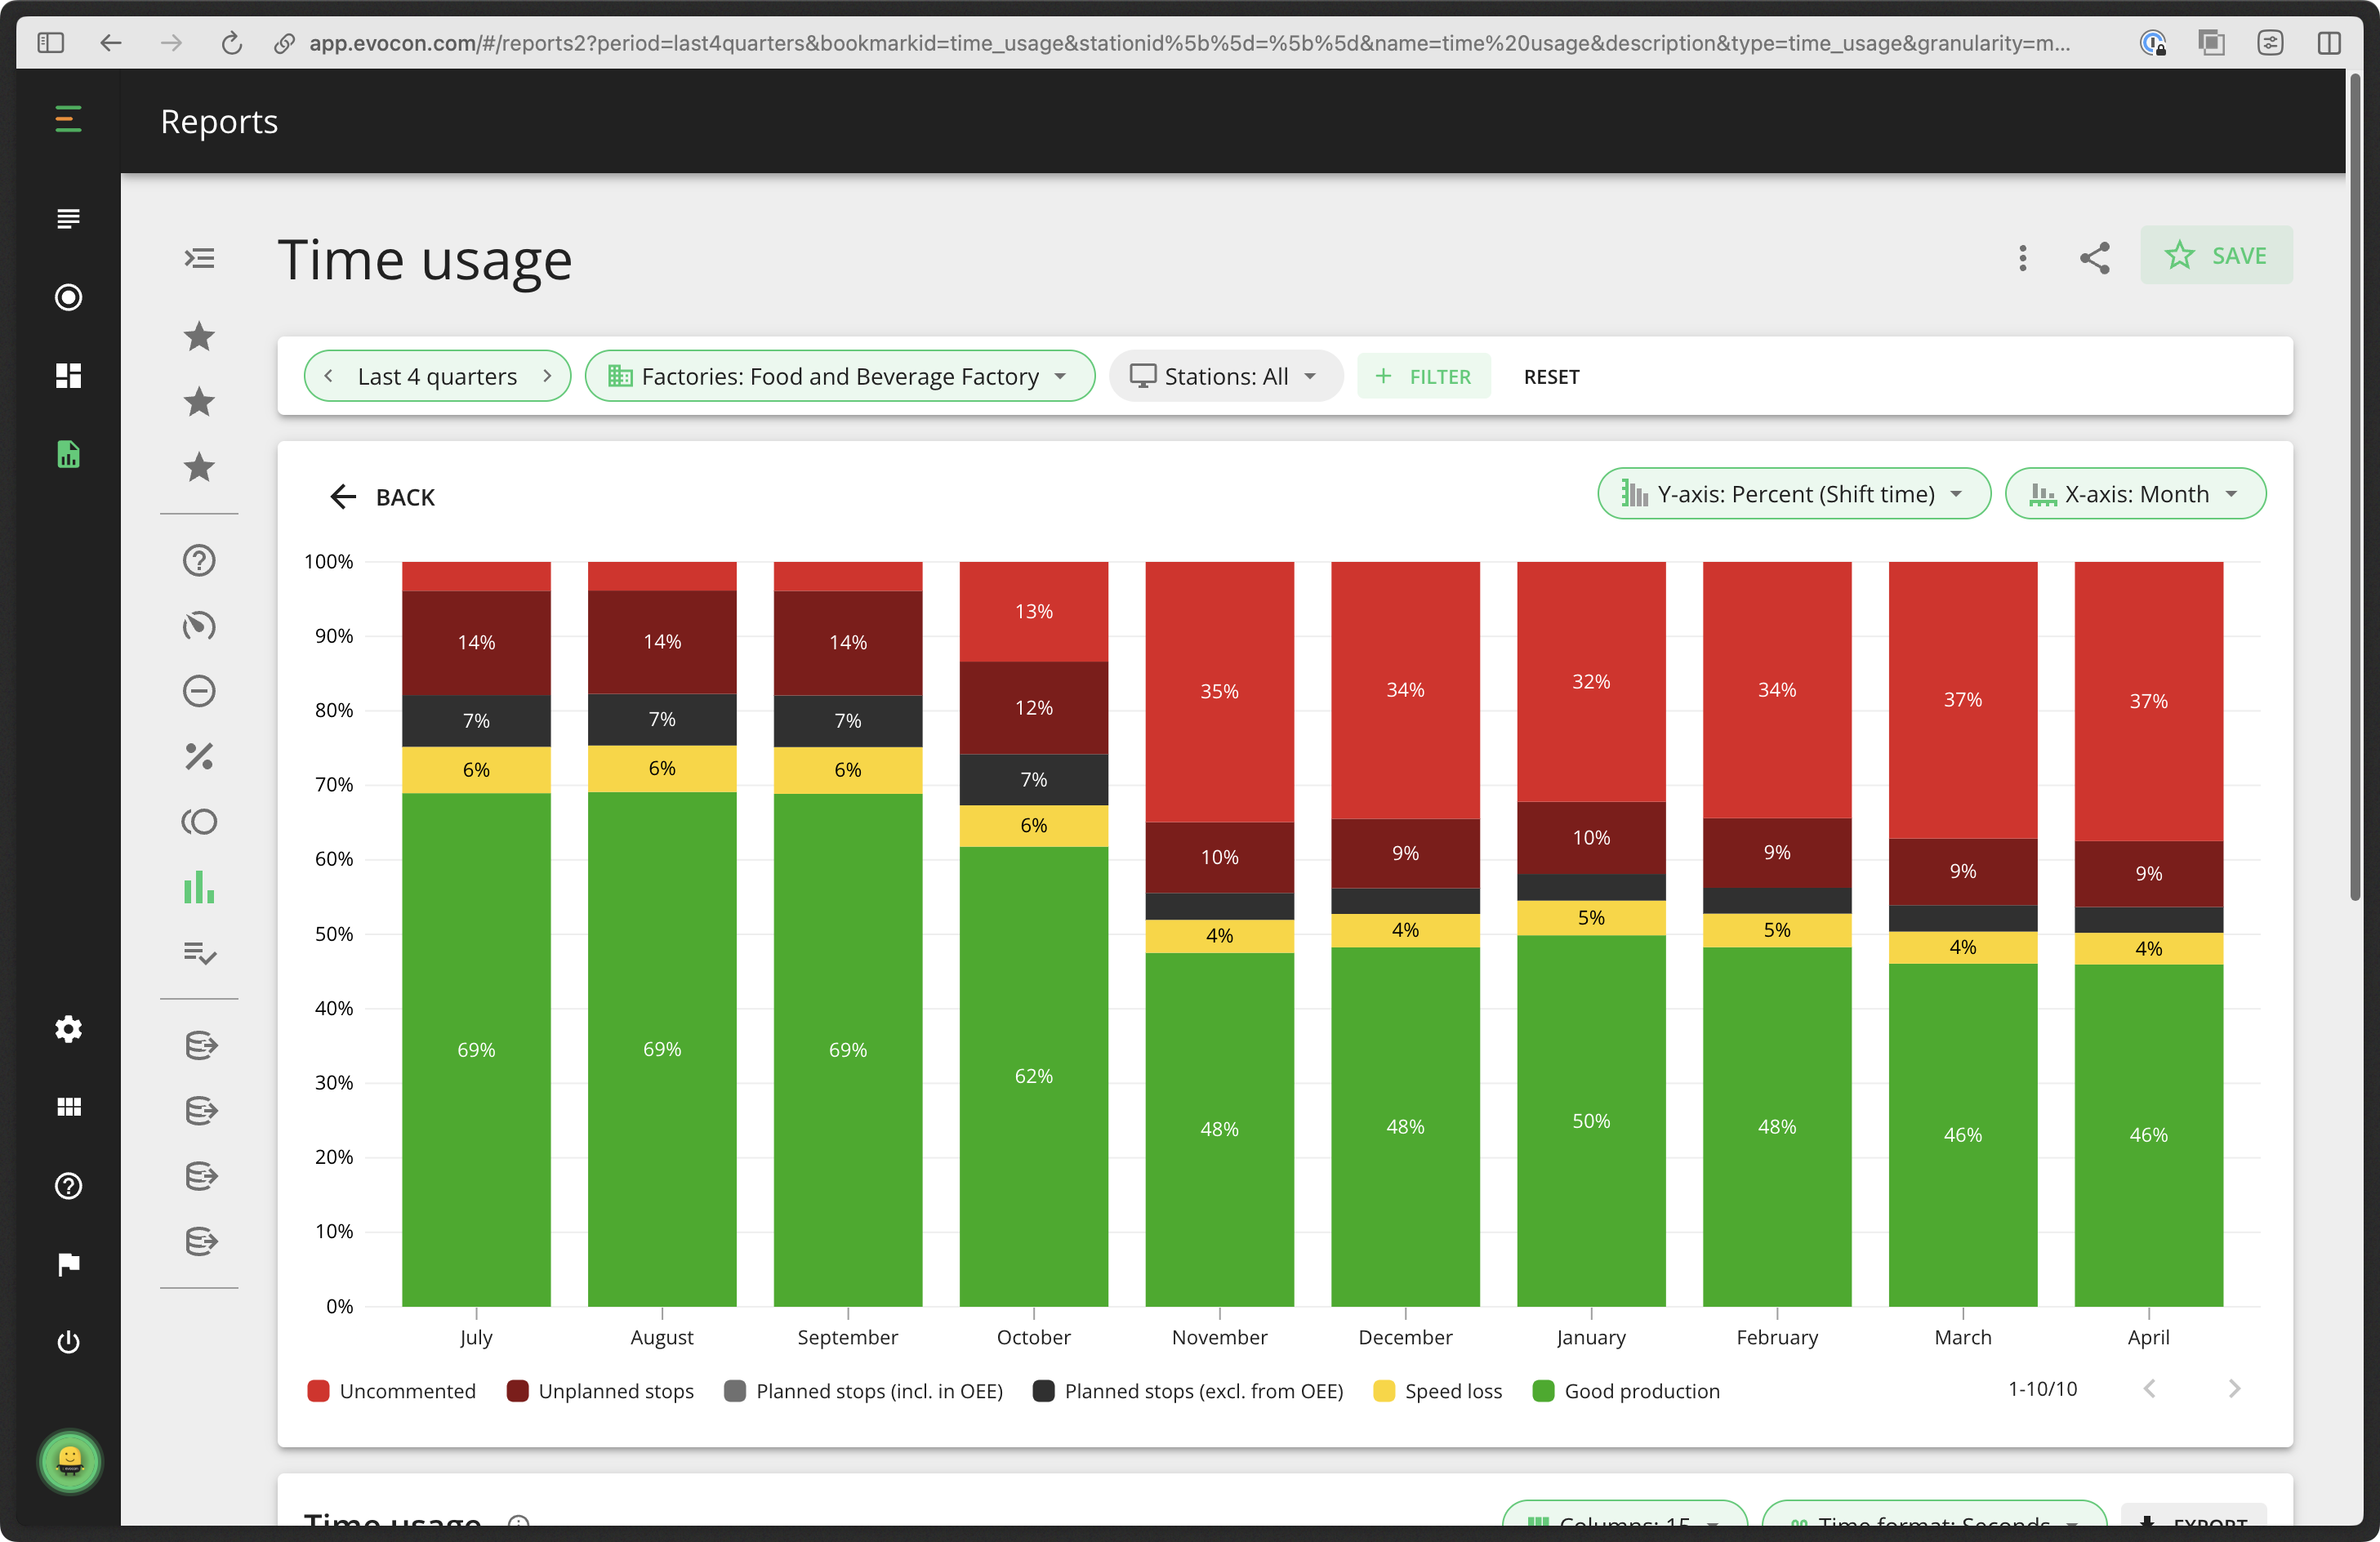
- Data visualization and reporting:
A monitor placed near the production line displays real-time line status and OEE, and a large TV screen on the shop floor gives an overview of all lines connected to Evocon. The plant manager checks production status on a mobile phone, downloads a report for senior leaders once a week, and exports detailed data for in-depth analysis once a month.
- Decision-making and action:
Operators address the largest identified downtime reasons. The performance manager shortens target cycle times when line speed improves, and investment is reallocated to another line, which proves to be a more significant bottleneck.
Why Is Production Monitoring Important?
Monitoring production lines solves many existing problems in factories at every level. In this section, we will look at problems and solutions from three different angles:
- Big-picture strategic benefits that affect your overall business decisions.
- Hands-on tactical benefits that improve the performance of all departments and coordinate their efforts.
- Day-to-day operational benefits you’ll see directly on your production line.
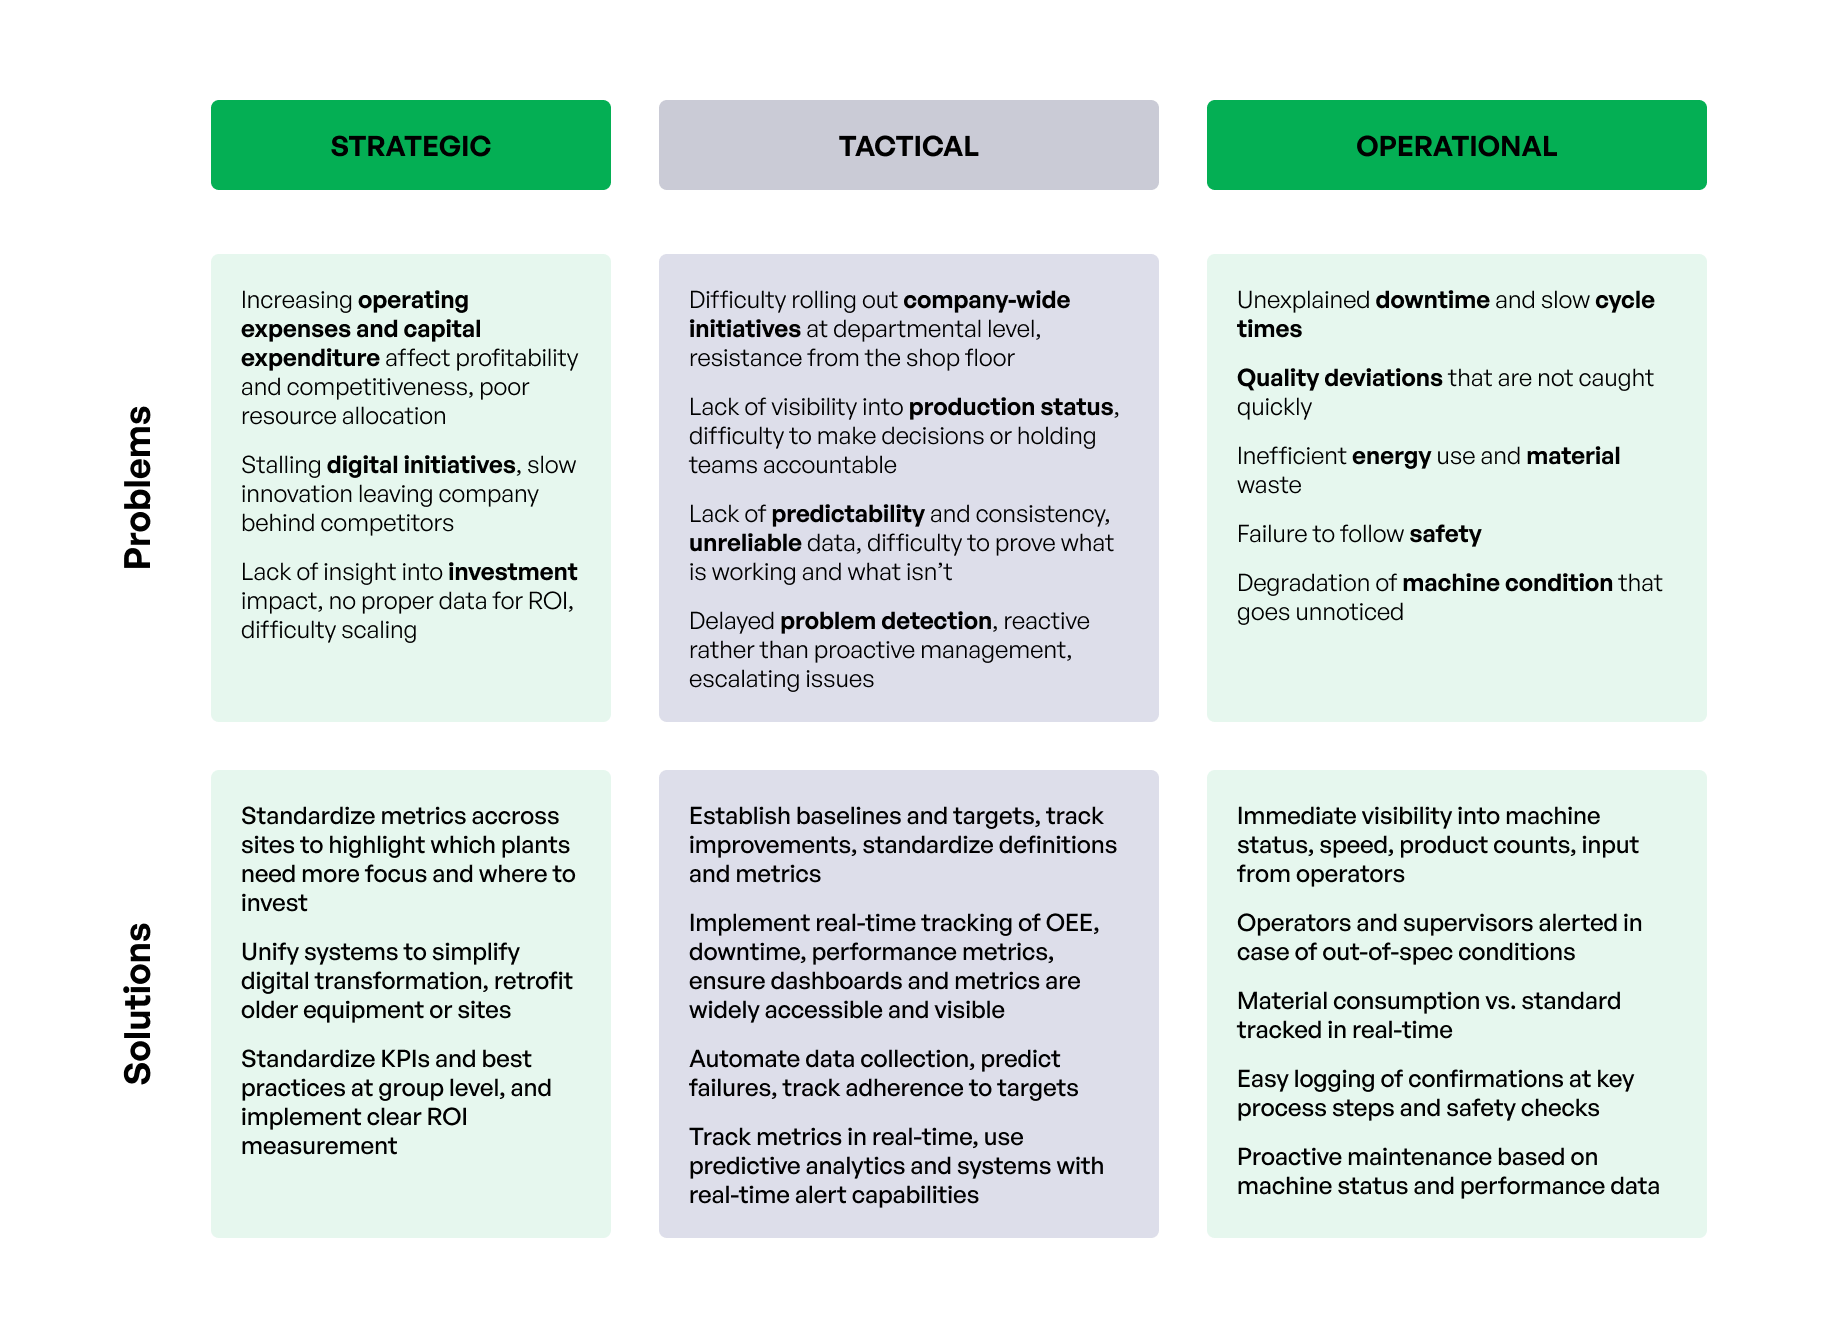
Strategic benefits
| The Problem | The Solution |
| Increasing operating expenses and capital expenditure affect profitability and competitiveness, and lead to poor resource allocation | Standardize metrics accross sites to highlight which plants need more focus and where to invest |
| Stalling digital initiatives or slow innovation leaving the company behind competitors | Unify systems to simplify digital transformation, and retrofit older equipment or sites |
| Lack of insight into investment impact, with no accurate ROI data, and difficulty scaling | Standardize KPIs and best practices at group level, and implement clear ROI measurement |
Tactical benefits
| The Problem | The Solution |
| Difficulty rolling out company-wide initiatives at departmental level, and resistance from the shop floor | Establish baselines and targets, track improvements, and standardize definitions and metrics |
| Lack of visibility into production status leading to difficulty making decisions or holding teams accountable | Implement real-time tracking of OEE, downtime, performance metrics, and ensure dashboards and metrics are widely accessible and visible |
| Lack of predictability and consistency, unreliable data, making it difficult to prove what is working and what isn’t | Automate data collection, predict failures, and track adherence to targets |
| Delayed problem detection, reactive rather than proactive management leading to escalating issues | Track metrics in real-time. Use predictive analytics and systems with real-time alert capabilities |
Operational benefits
| The Problem | The Solution |
| Unexplained downtime and slow cycle times | Immediate visibility into machine status, speed, product counts, and input from operators |
| Quality deviations that are not caught quickly | Operators and supervisors are alerted in case of out-of-spec conditions |
| Inefficient energy use and material waste | Track material consumption against standard in real-time |
| Failure to follow safety procedures | Easy logging of safety checks and confirmations at key process steps |
| Degradation of machine condition that goes unnoticed | Proactive maintenance based on machine status and performance data |
Overview of all the benefits of production monitoring
How to Implement Production Tracking in Manufacturing
Choosing how to implement production tracking involves several key decisions, each with different options and challenges. Getting these choices right, from the initial strategy to the specific details, is crucial for a successful project that delivers real value. The following list outlines these major decision points in a typical order to help guide your planning.
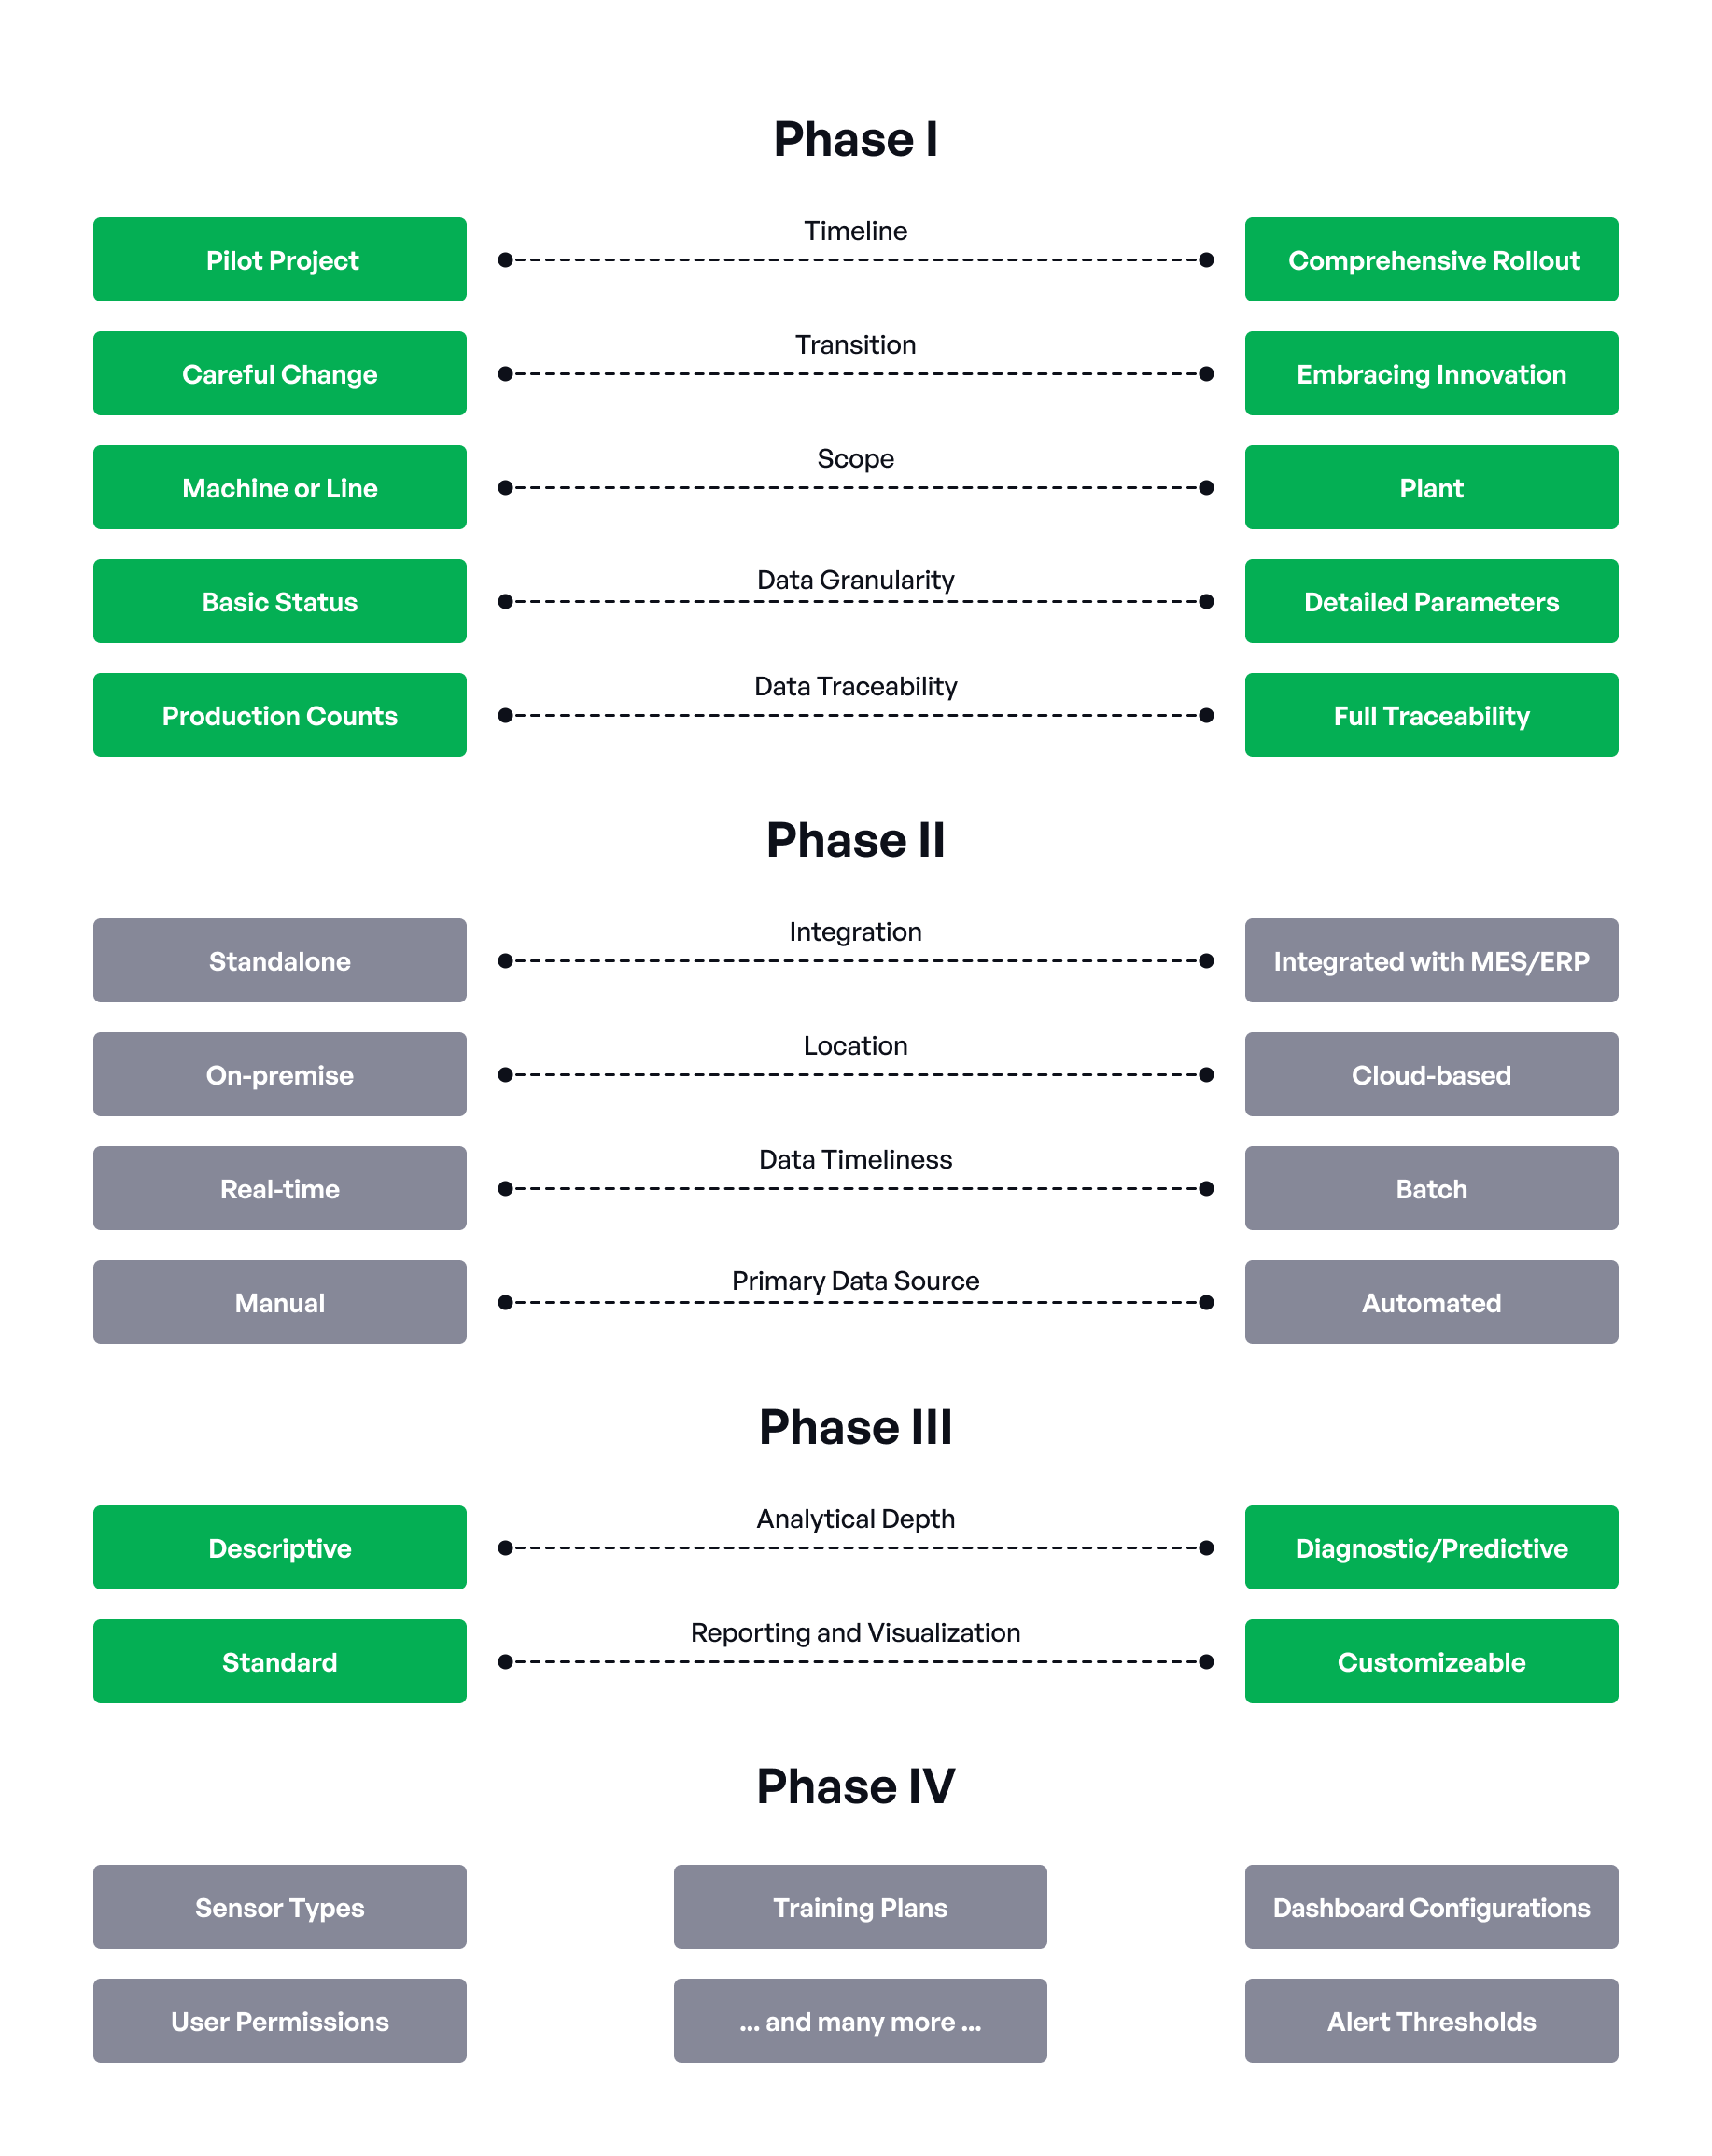
Phase I: Early strategic & scoping decisions
- Timeline: Focused pilot project vs. comprehensive rollout
Are you targeting one critical machine/line/problem first, or attempting a wider implementation from the start? This impacts budget, risk, resources, and timelines significantly. This is often the very first strategic choice. We have real-world examples of both:
A successful pilot in Equatorial Coca-Cola Bottling Company
A rapid deployment across multiple sites at MegaLabs.
👉 Evocon’s free trial is a convenient way when choosing a small pilot approach. This allows you to involve operators early, gain their buy-in, and evaluate the system’s user-friendliness before scaling organization-wide. - Transition management: Careful change vs. embracing innovation
This ties closely to the timeline considerations above. How will the new systems align with existing workflows and habits? What is the plan to enhance the outcomes without disrupting existing routines? Or is there a way to demonstrate the benefits clearly and to enable a quick shift to the new technology? - Scope: Machine, line, or plant?
Where should you start? A single critical bottleneck machine? An entire production line, or multiple lines?
👉 Evocon is most suitable for monitoring production lines and machines where production is repetitive and discrete, meaning output can be counted as pieces, length, volume, or bulk produce. Monitoring CNC machines is common as well. One-off (job shop) production is less typical, but it is possible to implement with a cleverly placed sensor or a push-button approach. Continuous processes (i.e., oil refinery) require more parameters to be measured. While we have clients in these industries, Evocon is not the only solution and is integrated with other systems for complete coverage. - Data granularity:
Based on the problem you’re solving or your goals, what level of detail do you actually need? Just uptime/downtime, or do you need specific process variables like temperature, pressure, and speed?
👉 In Evocon’s case, the level of detail is high, and we can measure not only product units but also temperature, speed, pressure, volume, and length, for example. - Data traceability:
Beyond basic tracking, what known and unknown questions do you expect this data to answer? Do you need detailed traceability of materials, operators, batches for in-depth quality investigations, compliance requirements, or a thorough root cause analysis? What potential future questions might arise?
👉 Evocon can provide a high level of traceability because sensor data is tied to ongoing batches, operator information, and specific lines and locations.
Phase II: System architecture and approach decisions
- Integration: standalone vs. MES/ERP integrations
Does this system need to exchange data with your existing business systems (like importing production orders from ERP or reporting back statistics about completed orders)? This is a major choice that will affect which production tracking software you select.
👉 Evocon is a standalone product primarily specializing in monitoring OEE, but integrations with other systems are available. - On-premise vs. cloud-based
Where will the software run, and will data be stored locally or on the cloud? This involves IT infrastructure, cost model, scalability, internal IT capabilities, and continued support. There are many benefits to choosing a cloud-based OEE system, while opting for an on-premise setup typically requires in-house development.
👉 Evocon is a cloud-based platform leveraging modern web technologies, which allows for continuous updates and rapid deployment of fixes for potential security vulnerabilities (more on our approach to security). We do not offer an on-premise approach. - Data timeliness: Real-time vs. batch
How quickly do you need the information? Is near real-time data essential for immediate alerts and control, or is collecting data periodically (batch) sufficient for reporting?
👉 Evocon tracks production in real-time. - Primary data source: Manual vs. automated
What’s the primary method for getting data into the system? Will you rely mainly on operator input or invest in direct connections to machines (PLCs, sensors) for automation? In our experience, direct operator input is often underestimated.
👉 In Evocon’s case, data collection is primarily automated. Operators can also enter additional data for downtime reasons and quality check results.
Phase III: Functional & vendor selection decisions
- Analytical depth: Descriptive vs. diagnostic/predictive
What level of analysis capability do you need? Basic reporting of what happened, tools to help figure out why it happened, or more advanced predictive capabilities? - Reporting and visualization: Standard vs. customizable
Are the standard reports offered by systems sufficient, or do you need highly flexible, customizable dashboards and reporting tools for different roles (operators, managers, VPs)?
👉 Evocon’s reporting and visualization are both standard and customizable. Exporting to Excel allows for the highest customizability and integration with other business KPIs.
Phase IV: Detailed implementation choices
Finally, more granular choices are made closer to or during implementation — sensor types, dashboard configurations, user permissions, alert thresholds, specific training plans, and more.
In addition to a wide range of sensors, Evocon has the possibility to create and share custom dashboards and reports, set alerts and checklists, configure user permissions, and much more.
Summary of production monitoring implementation phases
Bonus Section: The Future of Production Monitoring in Manufacturing
Artificial intelligence (AI) and machine learning (ML)
Arguably the most significant trend right now, AI and ML are transforming industries worldwide, and manufacturing is no exception.
- Key applications
Predictive maintenance, process optimization, anomaly detection, waste reduction
- Current situation
According to Deloitte’s 2024 Future of the Digital Customer Experience survey, 55% of industrial product manufacturers already use generative AI (GenAI)
- Prediction
The same study mentions that over 40% of manufacturers are planning to increase their investments in AI over the next three years.
This topic is also covered in our free e-book Trends Impacting Shop Floors in 2025.
Industry 5.0
A more forward-looking concept aiming to better integrate human workers with smart systems (like AI and robotics) and place greater emphasis on sustainability and resilience, potentially leading to new monitoring metrics and approaches. A nice example of this is how workplace safety can be improved by automatically detecting people without PPE (personal protective equipment).
- Key applications
Human-robot collaboration, AI powered worker assistance, resource optimization and sustainability, resilient supply chain, personalized and customizable manufacturing, virtual reality for operations
- Current situation
While the underlying technologies (AI, robotics) are useful now, the full vision of Industry 5.0 is still developing.
- Prediction
Adoption rate may accelerate if driven strongly by governmental policies or by increasing need for operational resilience and continued advancements in technologies
Digital twins
Creating dynamic virtual replicas of physical assets or processes using real-time monitoring data.
- Key applications
Simulating different operating conditions, testing process changes virtually, predicting failures, training staff without impacting physical production
- Current situation
Proving useful, particularly for complex scenarios, by reducing risks associated with implementing changes.
- Prediction
Transitioning is increasing, particularly among larger enterprises. The future outlook is very strong.
Enhanced IIoT connectivity
More sensors, machines, and systems are being connected, generating more granular and real-time data than ever before. Wireless technologies are also making it easier to connect previously isolated equipment.
- Key applications
Real-time data collection from machines and sensors, remote monitoring and control, connecting previously isolated legacy equipment, supporting edge computing
- Current situation
Integral to Industry 4.0 and considered to be well-established. The principle of connecting assets is a prerequisite for most advanced monitoring and analytics initiatives.
- Prediction
The trend is towards broader, deeper, and more sophisticated connectivity. With more sensors, richer data types, increased 5G use, and seamless integrations, rapid growth is expected.
Cloud platforms and integration
Continued use of cloud platforms for scalable data storage, powerful analytics, and easier integration between monitoring tools and other business software (ERP, MES, SCM). The trend is towards seamless data flow across systems.
- Key applications
Scalable storage for large volumes of data, AI and ML platforms, secure remote access to dashboards and reports, data exchange between systems
- Current situation
Cloud platforms are widely adopted and considered mature technology. Integration is in focus, but still presents challenges
- Prediction
The trend is towards hybrid cloud/edge architectures and deeper cloud integration and lower barriers to entry for SMEs
💡Download the infographic for a visual summary of the production monitoring implementation guide.